S
C
I
E
N
T
I
F
I
C
-T
E
C
H
N
I
C
A
L
High shear dispersion of tracers in polyolefins
for improving their detection
Valérie Massardier
1*, Molka Louizi
1, Elisabeth Maris
2and Daniel Froelich
21
UMR 5223 Ingénierie des Matériaux Polymères, Centre National de la Recherche Scientifique – CNRS,
Institut National des Sciences Appliquées de Lyon – INSA Lyon, Villeurbanne, France
2
Laboratoire Conception Produit Innovation, Chambéry, Arts et Métiers ParisTech, Savoie Technolac,
Le Bourget du Lac, France
Abstract
An eficient recycling of end-of-life products is of crucial interest from an economical and ecological point of view. However, the near infrared spectroscopy often used for the optic sorting processes is limited because of the absorption of carbon black present in black plastics and as it only sorts as a function of chemical formulas. The tracing technology developed in this study is based on the dispersion of lanthanide complexes particles into polymers to give them a code that can be related to their formulation and viscosity that are important parameters for their re-processing. As the success of this technology is conditioned by achieving a ine dispersion of the tracer particles, we also focus on accomplishing a ine dispersion of tracer particles by using a high shear process. Processing under high shear rate (N= 800 rpm) has proved to play a determining role in dispersing inely and homogenously tracer particles within PP matrix. Thanks to the good quality of dispersion, the detection of three tracers at a level of 0.1 wt% has been successfully achieved, even in black matrices for an acquisition time of 10 ms.
Keywords: tracers, polyoleins, automated sorting, UV luorescence, high shear extrusion, recyclability.
1. Introduction
The plastics success is owing to their attractive performances, inexpensive, durable materials, lightweight, recyclable, as well as adjustable properties depending on their formulation[1]. Polyolefins[2] represent a very important family of polymers, constituting more than a third of the total plastics demand in Europe.
Recycling of post-consumer products requires their sorting that is often based on sink and float separation. This technique allows the separation of shredded plastics according to their densities[3] but is not very efficient for separating plastics and formulations that have very close densities, such as HDPE, LDPE, PP, etc.
In addition to the existing automated sorting systems mentioned above, tracing technologies based on tracer systems can be used to refine the sorting of end-of-life products, especially those having close densities or black ones. The tracer signature is also relevant to increase the selective sorting of end-of-life products by providing a signature for polymer type and grade in complex mixtures. Tracing technologies consist in adding small amounts of tracer into plastics during the compounding process. The tracer is expected to emit a signature detectable by either magnetic or NIR detectors, UV, X-ray fluorescence-spectrometry, etc. Several studies have been conducted to apply and evaluate the efficiency of tracing technologies. In the earlier 90’s, Ahmad[4] and Simmons et al.[5] have used a tracer system to ensure a high speed positive sorting of plastic bottles. By combining three fluorescent tracers dispersed in polymers, it was possible to detect their signature by UV-spectroscopy and thus identify PEHD bottles. This
technique was also successfully applied for identification of HDPE, LDPE, PP, EVA, PVC and PET polymers. In addition, the chosen tracers were compatible and chemically non-reactive with the matrices, did not affect the plastics transparency but were poorly detected in black plastics. In their study, Corbett et al.[6] have also shown the efficiency of UV-spectroscopy to detect luminescent phosphor based molecules in white polymers for the separation of waste polymers. Other researches[7,8] have confirmed the effectiveness of tracing technologies for enhancing the sorting of shredded wastes by simple use of flame retardants (FR) as tracers and identifying them by X-ray fluorescence spectrometry (XRF). Moreover, the near-infrared technique (NIR) can be used to detect the fluorescence of tracers based on rare earths with concentrations ranging from 0.001 to 1 ppm in polymers. However, this method has shown its limitation to detect a signal when the matrix is black because the carbon black used as colorant significantly absorbs all of the rays in the NIR[9].
They are essentially polymers that are dark-colored and have the same densities. Bezati et al.[11-14] have shown that the X-ray fluorescence allows the detection of few tracers, while the magnetic detection is applied for the detection of only one tracer. Furthermore, the X-ray fluorescence detection which is a volume detection, can be a reliable method for high speed identification and sorting of black plastics into different families and grades. Moreover, the tracers adapted for the XRF detection process are the elements belonging to Mendeleyev’s Periodic Table (Yttrium (Y), Cerium (Ce), etc.) and with concentration levels of about 500 ppm or less. Nevertheless, the drawback of this study is that the choice of tracers is limited by Mendeleyev’s Periodic Table elements which are neither present in polymers nor in their additives.
The choice of tracers with UV signal seems to be more opened and Lambert and Hachin[15,16], Maris et al.[17] have shown that tracers (T1 and T2), at percentages lower than 250 ppm were detected in white and black colored PP and ABS by UV fluorescence spectrometry as the identification technique, even after ageing standard tests.
The idea of tracing polymers for recycling seems to have potential benefits, especially to increase not only selective sorting of black colored polymers but also sorting as a function of viscosity and composition. As regards the criteria for the choice of tracers, they must be stable at processing temperatures (extrusion or injection molding conditions), non reactive, non-hazardous, non-toxic to the environment and human life, stable at climatic conditions in particular to UV radiations, non-expensive (with cost less than 0.06 €/kg) to facilitate their implementation in the industrial process. In addition, with regard to their detectability, tracers must have strong signal intensity, low fluorescence lifetime and well distinguished peaks to avoid overlap with other elements even in the presence of pigments and carbon black. Regarding the detection system, it must have a high detection rate per second, be able to identify rapidly tracers contained in grinded plastics (black or white) with sizes of about 20 mm, singly or in any combination at very high speeds (10 ms).
The quality of detection is strongly related to the dispersion of tracers that often depends on the choices of extrusion parameters (screw profile and speed, etc). As regards the influence of twin-screw extrusion conditions, measurable
extrusion characteristics were found to be of critical importance to find relationships between extrusion process, morphology development and finally polymer blends properties. In this field, different pioneering works have been carried out few years ago in twin screw extruders[18,19]. Recently, high shear processes[20-23] have proved to be an effective way for polymer blending. For example, high screw speed can give rise to the development of nanostructured blends with properties impossible to reach with classical processing techniques (twin-screw extruder, internal mixer, etc.). Concerning high shear extrusion, Louizi et al.[24,25] and Bouaziz et al.[26] have recently shown that the final morphology of polymer blends is significantly influenced by extrusion parameters such as mean residence time and screw rotation speed. Moreover, the specific mechanical energy “SME”, which characterizes the extrusion process (with parameters such as torque, temperature, rotation speed, and throughput), can be correlated with the quality of the final product.
As outlined above, processing under high shear flow can provide strong shear stress on an extruded material by simple adjustment of screw rotation speeds, and thus improve the fragmentation and dispersion of tracer particles in polymer blends. Therefore, in this study, we investigate the effect of extrusion (variation of speed for a screw profile dedicated to dispersion of fillers) on the morphological development, thermal, mechanical as well as optical properties of a traced polyolefin formulation.
2. Experimental Part
2.1 Materials
The materials investigated in this study are commercial grades used in the automotive and electrical & electronic fields: i) PP108MF97 is a white high impact polypropylene, also named (PP108 MF 97), manufactured by Sabic, made of 78 wt % isotactic PP and 22 wt % ethylene-propylene-rubber random copolymer (EPR), does not contain carbon black, its melt flow index MFI is 10 g/10 min under 2.16 kg at 230°C and its specific gravity equals 0.915 g/cm3; ii) BMU 133 is a black polypropylene copolymer provided by Exxon Mobil Chemicals. It contains 10% mineral filled elastomer, shows a melt flow index MFI = 15 g/10 min under 2.16 kg at 230°C and a specific gravity of 0.970 g/cm3.
Table 1. A comparative study of the detection techniques used for detecting a tracer system[10].
Detection technique Advantages Limits
UV High speed identification. Tracer concentration: (30-100 ppm)
Higher quantities of tracer for dark plastics than for white.
Fluorescence of the polymer matrix. Clean surface detection.
Near Infrared High speed identification. Unsuitable for the identification of tracers in dark plastics.
Mid Infrared Tracers’ identification in dark plastics. Unsuitable for high-speed identification. XRF
(X-ray fluorescence)
Tracers’ identification in dark plastics. High speed identification. Volume detection.
Number of tracers limited by the Mendeleyev’s Periodic Table
Three fluorescent tracers (T1, T2 and T3) were tested and belong to the inorganic family of the lanthanide complexes. T1 is an aluminium barium magnesium oxide, T2 is a doped aluminium and barium oxide, T3 is a doped vanadium trioxide. These tracers do not chemically react with the materials and were provided by the start up Tracing Technologies. They are thermally stable at high temperatures, compatible with the REACH regulations. Their essential feature is that when they are excited with a UV source between 300 and 400 nm, they fluoresce in the visible light spectrum.
2.2 Preparation of traced blends
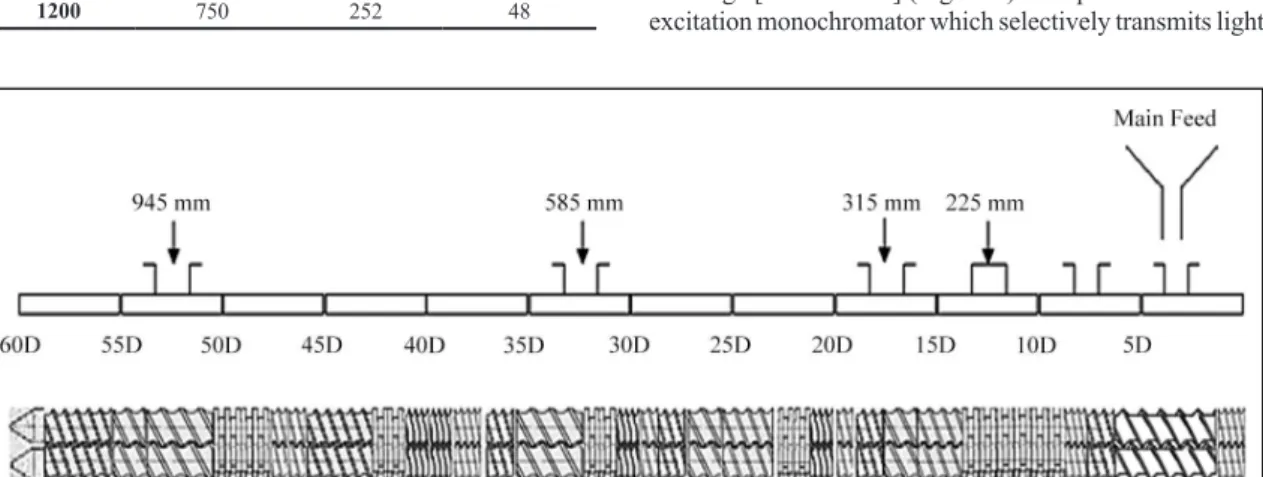
All traced blends are prepared with a co-rotating twin screw-extruder (TSE) Leistritz ZSE 18 HP. The screw profile, with a screw diameter of 18 mm and a L/D ratio of 60, used for all the experiments is illustrated in Figure 1.
The originality of this extruder lies on reaching high shear rates on extruded blends by adjusting the screw rotation speed. In addition, this technique has proven to be a key to the preparation of well-dispersed silica nanofillers within polypropylene matrix. We extrapolate these results to achieve a fine dispersion of tracers within PP matrix. Indeed, a good dispersion of the tracer is required for a good detection by UV spectrometry. The chosen rotation speeds are set to 300, 800 and 1200 rpm. These screw rotation speeds from 300 to 1200 rotations per minute correspond to shear rates ranging from 220 to 750 s–1 calculated thanks to Ludovic software[27]. The extrusion temperature and the feed rate (Q) are 200°C and 3 kg/h, respectively. The tracer concentration in all samples is 0.1% by weight. For each processing condition, the mean residence time is evaluated by adding one coloured pellet into the hopper. The melt temperature at the die exit is measured by introducing a thermocouple into the bulk extrudate (Table 2). These experimental parameters are determined in order to find a relationship between the extrusion process and the final properties of traced blends.
At the die exit of the extruder, the extrudates are pelletized and then moulded at 200°C through a Battenfeld 350 PLUS injection moulding machine. Standard tensile and rectangular bars are produced for mechanical tests.
2.3 Characterization of tracers’ dispersion and structure
The structure of tracers and their dispersion in the selected polymers were investigated by Scanning Electron Microscopy (SEM) using a Hitachi S800 model at an accelerating voltage of 30 kV. Prior to observations, samples were cryo-fractured in liquid nitrogen to avoid any plastic deformation.
2.4 Mechanical tests
Tensile tests of the prepared blends were determined by means of an Instron machine MTS 2/M tester, at a crosshead speed of 30 mm/min at room temperature. Impact tests were performed by means of a Zwick D7900 Type 5102-100/00 instrument in compliance with standard ISO 179 on notched specimens conditioned at –22°C for 48h. All the reported values are averages of ten experimental results to check reproducibility.
2.5 Thermal properties
The thermal properties of blends before and after UV irradiation were carried out by differential scanning calorimetry using DSC Q10 of TA instruments. To perform these tests, samples were cut into pellets and placed in aluminium pans. A scan was performed from 10 to 200°C, further maintained for 2 min at 200°C to erase the thermal history of the blends and then cooled down from 200°C to 10°C. The heating and cooling rate was fixed at 10°C/min.
The degree of crystallinity, χC, was calculated considering
a melting enthalpy of 209 J/g for a 100% crystalline polypropylene.
2.6 Detection of tracer signature by UV fluorescence spectrometry
The detection of the tracers’signal for the traced blends was performed by UV fluorescence spectrometry. The laboratory apparatus used is a UV fluorescence spectrometer Horiba Jobin Yvon type Fluomax. A 150 W Xenon lamp emits photons with broad energy spectrum in the range [250-900 nm] (Figure 2). The photons reach the excitation monochromator which selectively transmits light
Figure 1. Screw configuration of the co-rotating high shear extruder. Table 2. Experimental processing parameters.
Screw speed
(rpm)
Maximal shear rate
(s–1)
Melt temperature
(°C)
Mean residence
time (s)
100 140 210 85
800 500 231 55
of a wavelength in a band centered on the specified excitation wavelength. The light is reflected at specific angle to the sample and then transmitted to emission monochromator. The photomultiplier signal amplifies the signal and accounts the number of photons in count per second.
Grating, sensor mirrors lenses, beam splitters have a response that depends on the wavelength and must be subtracted to the signal. The acquisition of a corrected spectrum is necessary to characterize a new component and for quantum yield measurements. The excitation spectrum is between 240 and 600 nm and the emission spectrum between 290 and 850 nm.
The number of photons emitted is counted and averaged for each wavelength referring to the integration time (IT). Part of the signal is due to noise (dark count: distortion of the detector signal) and is substracted. Arbitrary unit is used for the intensity measurement.
The experimental features are excitation wavelength: 325 nm, integration time: 0.1 s, excitation/emission
monochromator slit i) for black polymer: 0.59 mm/0.23 mm, ii) for white polymers: 0.23 mm/0.04 mm.
In order to validate the UV-ray fluorescence measurements, the criteria that must be taken into account are the following: eliminate the Rayleigh scattering with a filter, search for a linearity perimeter between the intensity of the signal and concentration, validate an excitation wavelength allowing discrimination between the fluorescence of the tracers and that of the matrix. Finally, the intensity of the tracer’s fluorescence signal must be greater than three times the one of the white matrix signal standard deviation in order to be validated.
Moreover, the features of the fluorescence emission are the intensity and the relative standard deviation (RSD). The intensity of tracer signal must be significantly higher than the signal of the instrument and the polymer fluorescence. The relative standard deviation (RSD) gives information about the dispersion of the tracers for the same average surface analyses.
Since the UV spectroscopy is a surface detection method, 20 measurements are carried out on the exposed surface.
3. Results and Discussions
3.1 Characterization of the dispersion and structure of T3 tracer
After validating the detection of fluorescent tracers by using UV-fluorescence spectrometry, it is another aim of this study to achieve a fine and homogenous dispersion of tracers within two PP matrices. Indeed, an efficient dispersion of tracer particles is of great importance since it may not only improve their detection but also lead to enhanced mechanical properties of traced blends[14,28].
Before proceeding to the characterization of tracer’s dispersion, in the first instance, it was appropriate to examine the structure of T3 tracer which was delivered in micrometer powder. A concise analysis was carried out by Scanning Electron Microscopy (SEM) to evaluate its structure.
As clearly seen from SEM micrographs taken at different magnifications (Figure 3), the T3 powder is organized
Figure 2. Scheme of the spectrometer. The source (a) is a Xe
lamp of 150 W, emitting from 240 to 850 nm. The beam enters an excitation monochromator (b) and exits as a UV monochromatic light. The beam reaches the sample with a 60 degree incidence angle. The reflected light on the sample (c) is composed of fluorescence lines and Rayleigh scattering. Then, a high-pass filter with a 370 nm cut-off wavelength is added before an emission monochromator (b’) and a photomultiplier (e).
in form of sticks which aggregate together to form large agglomerates. In order to separate these agglomerates into finer particles, it is necessary to apply strong forces. That is why a high-shear extruder is used for preparing traced blends. This recent generation of extruder is of scientific importance and possesses a profound prospect in industrial applications: it facilitates the dispersion of fillers in matrices thanks to strong shear forces by simply adjusting the screw rotation speed without any additive[29,30].
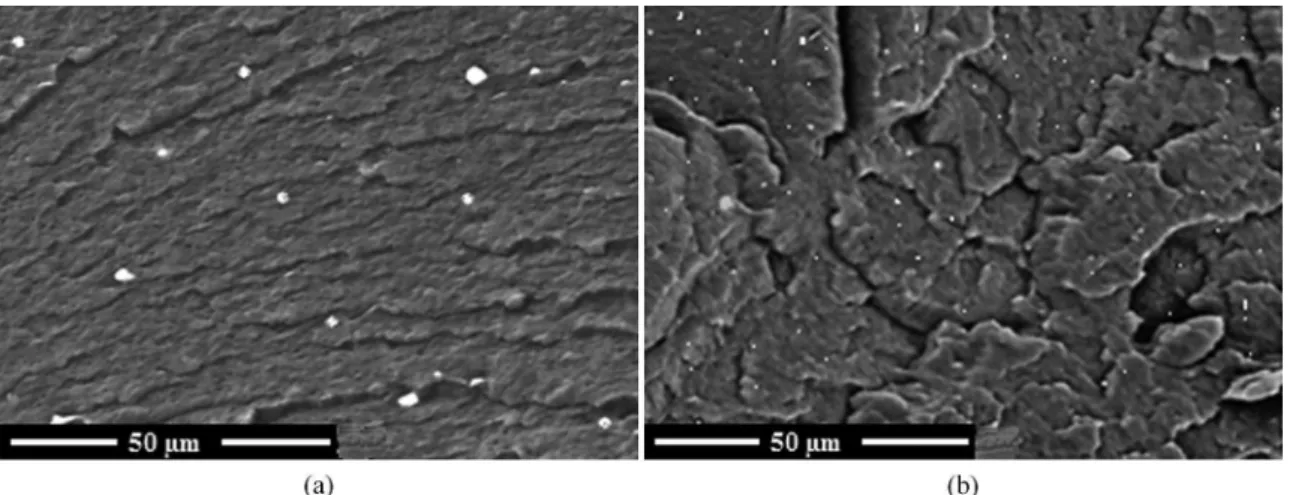
To highlight the high shear effect, the micrographs displayed in Figure 4a and b depict the morphologies of traced blends ((PP108 MF 97-T3-0.1) and (BMU133-T3-0.1)) as a function of the screw speed, respectively 100 rpm (a) and 800 rpm (b).
For the traced blends (PP108 MF97-T3-0.1) processed under low shear rate (100 rpm), numerous agglomerates of T3 tracer are seen on SEM micrographs (Figure 4a) with sizes ranging from 2 to 5 µm inducing agglomeration problems as well as heterogeneous distribution. This can be ascribed to the inadequacy of the applied shear rate (i.e. 220 s–1) during compounding to break agglomerates into finer ones. Interestingly, by increasing the screw rotation speed up to 800 rpm, the size of tracer agglomerates is reduced to less than 80 nm and a homogeneous dispersion of these
particles is achieved, leading to decreased distances between particles. (Figure 4b). This finer dispersion is due to the high shear stresses (from 220 to 550 s–1) applied on the tracer agglomerates and resulting in their division into finer ones within PP matrices. Such an effect was recently observed by other authors[31,32]. They showed that the rotation speed increase, which mainly controls the shear conditions during extrusion, has a high influence on the dispersion of fillers.
As regards the black colored traced polymer (BMU133-T3-0.1), it is not easy to distinguish tracers in form of particles or agglomerates. Apparently, the presence of other additives such as mineral fillers and carbon black contained in BMU 133 polymer can mask the T3 tracer.
3.2 Mechanical properties
By means of SEM observations, it is shown that the increase of screw speed greatly impacts the dispersion of tracer particles within the polyolefin matrices; consequently, the mechanical properties should also be influenced. Indeed, a homogenous and fine dispersion of fillers induces an improvement of the mechanical properties of materials, such as poor dispersion as well as presence of agglomerates that lead to structural defects. To evaluate the effect of adding tracers on the mechanical properties of traced polymers as a
Figure 4. Morphologies of PP108 MF 97-T3- 0.1 traced blends extruded at (a) 100 rpm and (b) 800 rpm.
Table 3. Mechanical properties of PP108 MF 97 and BMU 133 polymers as received and their traced blends processed at various screw
speeds.
Samples E
(MPa)
σm
(MPa)
εb
(%)
Impact Strength (kJ/m2)
PP108 MF 97-reference (W) 450± 10 20 ±10 530± 04 8±01
PP108 MF 97-T3- 0.1 (100 rpm) 470±10 19 ±05 480± 10 6±02
PP108 MF 97-T3- 0.1 (800 rpm) 440±08 20 ±06 570± 05 14±01
PP108 MF 97-T3- 0.1 (1200 rpm) 280±04 19 ±04 410±10 9±01
BMU133-reference (B) 420±10 13±03 187±10 7±01
BMU133-T3- 0.1 (100 rpm) 453±05 12±05 106±20 6±01
BMU133-T3- 0.1 (800 rpm) 410±08 13±06 251±10 12±01
BMU133-T3- 0.1 (1200 rpm) 283±07 12±02 145±10 8±01
BMU133-T2- 0.1 (100 rpm) 461±04 12±01 136±03 7±02
BMU133-T2- 0.1 (800 rpm) 430±08 13±08 224±02 11±02
BMU133-T2- 0.1 (1200 rpm) 245±02 11±05 132±08 6±01
function of screw rotation speeds (100, 800 and 1200 rpm), tensile stress (σm), tensile modulus (E), elongation at break
(εb) and impact strength are investigated and summarized
in Table 3.
As reported in Table 3, on one hand, the addition of tracer particles to the selected polymers induces a slight increase of Young’s modulus from 20 to 40 MPa, compared to PP matrix. This increase is not significantly important and can be induced by the reinforcing effect of tracer particles. Furthermore, the elongation at break decreases for all traced polymers processed at 100 rpm. This decrease must be related to the extended agglomeration of tracer particles as observed earlier in Figure 4. These tracer agglomerates can act as stress concentrators, initiate the specimen fracture and cause mechanical failure points. On the other hand, it can be observed that by increasing the screw speed up to 800 rpm, the elongation at break and impact strength values of traced formulations are close to the ones of the polymers as received, as extrusion at screw speed of 800 rpm significantly increases the mechanical properties of neat PP/EPR[23]. Similarly, Louizi et al.[25] have shown that the increase of screw speed leads to higher mechanical energy (SME), which quantifies the level of energy transferred to the blends by mechanical input during extrusion[24,33]. They have shown that the breakup of agglomerates (such
as silica ones) in a PP matrix is favoured by high shear rates and results in a greater dispersion of the fillers.
For polymer blends, Teyssandier et al.[23] have observed improved elongation at break and impact strength values for polyamide 12 (PA12)/plasticized starch blends processed at high-shear rates. This improvement is attributed to very fine dispersion of starch particles in the PA12 matrix.
Nonetheless, all the traced blends processed at 1200 rpm reveal a noticeable reduction in mechanical properties owing to the degradation of the PP polymer chains resulting from all the thermal and mechanical history experienced by the polymer blends during the process[34,35].
Obviously, by examining the experimental processing parameters reported in Table 2, it can be noted that the increase of the screw speed from 800 to 1200 rpm induces self heating leading to a sharp increase of the extruder exit temperature from 232 to 252°C as well as a slight decrease in mixing time from 55 to 48 s. Thus, processing under high shear rate (800 rpm) plays a determining role in dispersing finely and homogenously the tracer particles within PP matrix; this is fundamental for the conservation or even enhancement of the mechanical properties of the traced blends.
Figure 5. Crystallization (a) and melting (b) peaks of BMU 133 with T3 tracer.
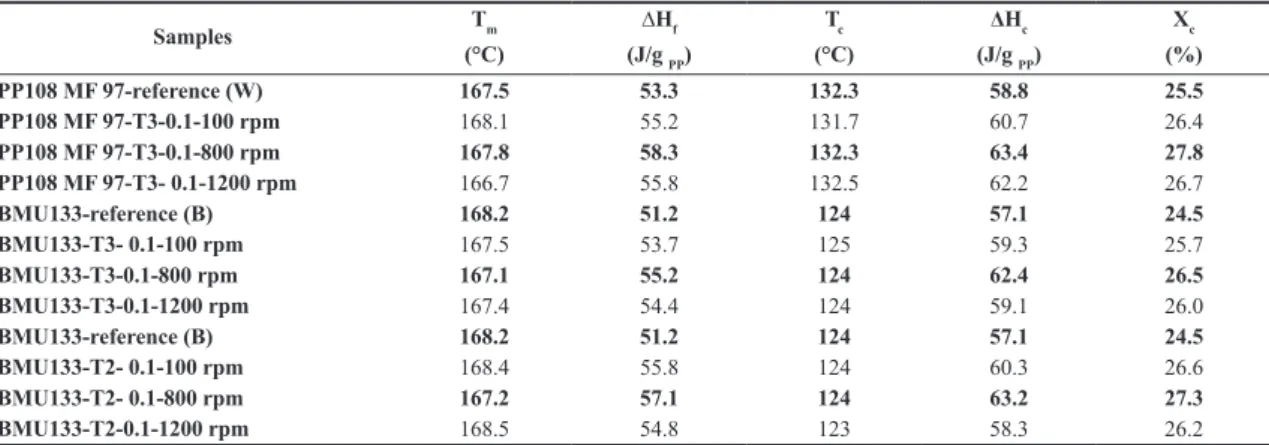
Table 4. Thermal properties and crystallinity degrees (obtained by DSC and TGA) of PP108 MF 97 and BMU 133 polymers as received
and their traced blends processed at various screw speeds.
Samples Tm
(°C)
∆Hf (J/g PP)
Tc
(°C)
ΔHc (J/g PP)
Xc
(%)
PP108 MF 97-reference (W) 167.5 53.3 132.3 58.8 25.5
PP108 MF 97-T3-0.1-100 rpm 168.1 55.2 131.7 60.7 26.4
PP108 MF 97-T3-0.1-800 rpm 167.8 58.3 132.3 63.4 27.8
PP108 MF 97-T3- 0.1-1200 rpm 166.7 55.8 132.5 62.2 26.7
BMU133-reference (B) 168.2 51.2 124 57.1 24.5
BMU133-T3- 0.1-100 rpm 167.5 53.7 125 59.3 25.7
BMU133-T3-0.1-800 rpm 167.1 55.2 124 62.4 26.5
BMU133-T3-0.1-1200 rpm 167.4 54.4 124 59.1 26.0
BMU133-reference (B) 168.2 51.2 124 57.1 24.5
BMU133-T2- 0.1-100 rpm 168.4 55.8 124 60.3 26.6
BMU133-T2- 0.1-800 rpm 167.2 57.1 124 63.2 27.3
3.3 Thermal properties
The effect of adding T3 and T2 tracers on the thermal properties of traced blends processed at various screw speeds were analyzed by differential scanning calorimetry (DSC) and thermogravimetric analyses under nitrogen (Figure 5 and 6). Table 4 summarizes the results, listing the melting/crystallization temperatures as well as crystallization/ melting enthalpies of traced blends. In addition, the temperature at maximum weight loss (Tmax) which is defined at the peak
of the derivative of the TGA curves has been measured (Table 4). Whatever the screw rotation, the addition of tracer particles at a concentration of 0.1% to the black or white PP matrix does neither affect their melting nor their crystallization temperatures.
Nevertheless, at N=800 rpm, the tracer particles seem to increase slightly the crystallinity degree of PP, which suggests that added particles may behave like centers of germination and nucleation. Such a behavior was already observed by Liu et al.[36] who found that fine powders of rare earth oxides may act as nucleators and influence the growth rate of polypropylene spherulites. The study of Xiaomin et al.[37] shows that the addition of 1 wt % of yttrium oxide (Y2O3) as a tracer acts as a nucleating agent and increases the crystallinity degree of the investigated polymer. However, recently, Bezati et al.[11,14] have shown that the dispersion of 0.1% cerium oxide to a PP matrix, under classical extrusion conditions, does not influence the thermal properties.
Thus, extrusion at a high screw speed of 800 rpm (Table 4) seems to improve the dispersion of our fillers that can act as nucleating agents able to increase the cristallinity degree.
However, TGA reveals that the variation of screw rotation does not affect the thermal stability of the traced blends (Figure 6).
3.4 Detection of tracers using UV-fluorescence spectrometry
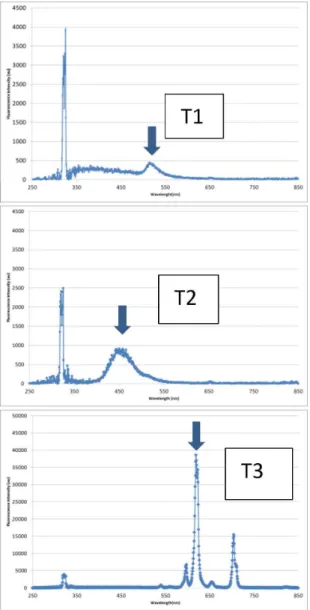
The first objective is to show the three fluorescent tracers are detected in both white and black polyolefin matrices. The excitation wavelength is the same for each tracer. The three fluorescence emission wavelengthes correspond to green, blue and red colours (Figure 7). Fluorescence emission spectrum of T3 displays several peaks characteristic of rare earth complexes with peak width of about 5 nm at its base. T1 and T3 tracers both display one peak with peak width of about respectively 50 and 100 nm at their base. The fluorescence lifetime is of about 10-3 s for lanthanide complexes and of about only 10-9 s for organic tracers. The commercial tracers (T1, T2 and T3) were primarily selected on the basis of their good excitation wavelength in the [310-370 nm] spectral band range as well as of their fluorescence emission band signatures in the visible band range of the spectrum. As shown in the spectra, the signature of each tracer, at concentration rates of 0.1wt%, is clearly visible and distinguishable from the “background” sample. It seems that the signal of the T3 tracer is more intense than those of T1 and T2 tracers. The T3 tracer is very interesting for the rest of the study because, as its signal intensity is the most important, it can be added to the polymer matrix in less than 1000 ppm, down to 30 ppm as was already verified by laboratory equipments. In what follows, we have focused the experiments on blends with T3 and T2 tracers at 1000 ppm concentration to analyze their influence on the final properties of traced blends. As T3 does, tracers can display several peaks, which can facilitate their detection. Inorganic tracers often present finer peaks than inorganic ones, which are more easily distinguishable from the polymer fluorescence peaks.
Figure 7. Spectra of virgin black BMU 133 with T1, T2, T3 tracers
at concentrations of 1000 ppm.
Table 5a. Measured values of UV-detection of traced white blends
(PP108 MF 97-T3) processed at various screw speeds.
Traced blends AFI1 SD2 RSD3 PP108
MF 97-T3-0.1-100 rpm
4.8 E+07 9.3E+06 19%
PP108
MF 97 -T3-0.1-800 rpm
5.8 E+07 8.1E+06 14%
PP108
MF 97-T3-0.1-1200 rpm
6.1 E+07 8.5E+06 14%
1: Average Fluorescence Intensity. 2: Standard Deviation. 3: Relative Standard Deviation.
Table 5b. Measured values of UV-detection of traced black blends
containing T3 or T2 tracers (BMU 133-T2-0.1 and BMU 133-T3-0.1) processed at 800 rpm.
Traced blends (800 rpm)
BMU133-T2-0.1 BMU133-T3-0.1
Average Fluorescence intensity (AFI)
1.9 E+06 1.1 E+06
Standard deviation (SD)
4.1 E+05 2.6 E+05
Relative standard deviation (RSD)
21% 22%
3.5 Study of the relation between dispersion and detection of tracers
Since the shear rate exerted during melt mixing has shown a significant influence on the dispersion as well as on the distribution of tracer particles, the average fluorescence intensity should also be enhanced. From Table 5a, it can be observed that the processing of traced blends at
N = 800 and 1200 rpm displays lower relative standard deviation for the measurements of fluorescence intensity compared to the traced blends processed at 100 rpm. This is ascribed to the fine dispersion of tracer particles within the PP matrix obtained when processing at high shear rates. As the conservation of mechanical properties and good detection of tracers are two necessary conditions for the success of the tracing technology, in what follows, the UV-detection is achieved only for samples processed at 800 rpm. In fact, the processed samples at 1200 rpm show failures in mechanical properties (Table 3).
As 800 rpm is a good compromise for both detection and maintenance of mechanical properties, the BMU 133 based black formulation has been processed at this rate and the detection of both T2 and T3 is good.
As clearly shown in Table 5b, the average fluorescence signal of black traced blends is less intense than for white ones. The signal is attenuated by the presence of carbon black, but the signal/noise ratio is sufficiently high for the detection to be positive. It is worth noting that the dispersion of 0.1 wt% of T2 or T3 tracer in the PP copolymer containing 1 wt% of carbon black is more difficult to accomplish compared to the white PP because of lower fluidity of the black colored formulation. When processing at 800 rpm, the relative standard deviation of fluorescence intensity of BMU 133-T2-0.1 and BMU133-T2-0.1 is higher (respectively around 21% and 24%) compared to the white PP108MF97-T3-0.1 (14%).
4. Conclusion
5. Acknowledgements
The authors would like to thank the National Research Agency (ANR) for its contribution to the funding of this work and for providing industrial orientations and scientific supervision to the research. Authors also wish to acknowledge P. Alcouffe and the ‘‘Centre de Microstructures et d’analyses, plateforme Lyon 1” of the University Lyon 1 for his assistance in the SEM characterization and valuable discussions.
6. References
1. Aouachria, K., Quintard, G., Massardier-Nageotte, V., &
Belhaneche-Bensemra, N. (2014). The effect of di-(-2-ethyl
hexyl) phthalate (dehp) as plasticizer on the thermal and mechanical properties of pvc/pmma blends. Polímeros. Ciência
e Tecnologia, 24(4), 428-433.
http://dx.doi.org/10.1590/0104-1428.1588.
2. Plastics Europe. (2013). Plastics – the facts 2013. An analysis
of European latest plastics production, demand and waste data. Belgium: Plastics Europe. Retrieved in 12 November
2014, from http://www.plasticseurope.org/documents/ document/20131014095824-final_plastics_the_facts_2013_ published_october2013.pdf
3. Altland, B. L., Cox, D., Enick, R. M., & Beckman, E. J. (1995).
Optimization of the high-pressure, near-critical liquid-based microsortation of recyclable post-consumer plastics.Resources, Conservation and Recycling, 15(3-4), 203-217. http://dx.doi.
org/10.1016/0921-3449(95)00031-3.
4. Ahmad, S. R. (2004). A new technology for automatic identification
and sorting of plastics for recycling.Environmental Technolology, 25(10), 1143-1149. Retrieved in 12 November 2014, from http://
www.tandfonline.com/doi/abs/10.1080/09593332508618380
5. Simmons, B. A., Overton, B. W., Viriot, M., Ahmad, S. R.,
Squires, D. K., & Lambert, C. (1998). Fluorescent tracers
enable automatic identification and sorting of waste plastics. British Plastics and Rubber, 8, 4-12.
6. Corbett, E. C., Frey, J. G., Grose, R. I., Hendra, P. J., &
Taylorbrown, T. (1994). An investigation into the applicability
of luminescent tagging to polymer recovery.Plastics Rubber and Composites Processing and Applications, 21(1), 5-11.
Retrieved in 12 November 2014, from http://eprints.soton. ac.uk/id/eprint/15926
7. Maris, E., Froelich, D., Lambert, C., & Hachin, J-M. (2015). FR
Patent No 3010789 (A3). Paris: TRACING TECHNOLOGIES
Société à responsabilité limitée. Retrieved in 12 November
2014, from http://worldwide.espacenet.com/publicationDetails/ biblio?DB=worldwide.espacenet.com&II=0&ND=3&adjace nt=true&locale=en_EP&FT=D&date=20150320&CC=FR& NR=3010789A3&KC=A3
8. American Plastics Council (2003). An industry full of potential:
ten facts to know about plastics from consumer electronics.
Virginia: APC. Retrieved in 12 November 2014, from http://
plastics.americanchemistry.com/An-Industry-Full-of-Potential-Consumer-Electronics
9. Eisenreich, N., Kull, H., & Thinnes, E. (1992). Rapid
identification of plastics with fast near-infrared spectroscopy. In Proceedings of the 23rd International Annual Conference of
ICT: waste management of energetic materials and polymers (pp. S.59.1-59.12). Karlsruhe: Fraunhofer-Institut für Chemische
Technologie.
10. Froelich, D., Maris, E., Haoues, N., Chemineau, L., Renard, H., Abraham, F., & Lassartesses, R. (2007). State of the art
of plastic sorting and recycling: feedback to vehicle design. Minerals Engineering, 20(9), 902-912. http://dx.doi.org/10.1016/j.
mineng.2007.04.020.
11. Bezati, F., Froelich, D., Massardier, V., & Maris, E. (2010).
Addition of tracers into the polypropylene in view of automatic sorting of plastic wastes using X-ray fluorescence spectrometry. Waste Management (New York, N.Y.), 30(4), 591-596. http://
dx.doi.org/10.1016/j.wasman.2009.11.011. PMid:20018501. 12. Bezati, F., Massardier, V., Froelich, D., Maris, E., & Balcaen, J.
(2010). Elaboration and characterization of traced polypropylene
with rare earth oxides for automatic identification and sorting of end-of-life plastics.Waste and Biomass Valorization, 1(3), 357-365. http://dx.doi.org/10.1007/s12649-010-9028-4. 13. Bezati, F., Froelich, D., Massardier, V., & Maris, E. (2011).
Addition of X-ray fluorescent tracers into polymers, new technology for automatic sorting of plastics: proposal for selecting some relevant tracers.Resources, Conservation and Recycling, 55(12), 1214-1221. http://dx.doi.org/10.1016/j.
resconrec.2011.05.014.
14. Bezati, F., Massardier, V., Balcaen, J., & Froelich, D. (2011).
A study on the dispersion, preparation, characterization and photo-degradation of polypropylene traced with rare earth oxides.Polymer Degradation & Stability, 96(1), 51-59. http://
dx.doi.org/10.1016/j.polymdegradstab.2010.11.008. 15. Lambert, C., Hachin, J. M. (2010). FRPatent No WO2010012892A2.
Paris: TRACING TECHNOLOGIES Société à responsabilité
limitée. Retrieved in 12 November 2014, from http://
worldwide.espacenet.com/searchResults?ST=singleline&l ocale=en_EP&submitted=true&DB=worldwide.espacenet. com&query=WO2010012892
16. Lambert, C., & Hachin, J. M. (2010). USPatent No 2010089804A1.
Paris: TRACING TECHNOLOGIES Société à responsabilité
limitée. Retrieved in 12 November 2014, from http://worldwide.
espacenet.com/publicationDetails/biblio?DB=worldwide. espacenet.com&II=4&ND=3&adjacent=true&locale=en_EP &FT=D&date=20100415&CC=US&NR=2010089804A1&K C=A1
17. Maris, E., Aoussat, A., Naffrechoux, E., & Froelich, D. (2012).
Polymer tracer detection systems with UV fluorescence spectrometry to improve product recyclability.Minerals Engineering, 29,
77-88. http://dx.doi.org/10.1016/j.mineng.2011.09.016. 18. Lim, S., & White, J. L. (1994). Influence of a compatibilizing
agent on the phase morphology of a polyethylene-polyamide 6 blend in a modular intermeshing co-rotating twin screw extruder.Polymer Engineering and Science, 34(3), 221-228. http://dx.doi.org/10.1002/pen.760340308.
19. Shon, K., & Bumm, S. H. (2011). Polymer blend compounding
and processing. In A. I. Isayev (Ed.), Encyclopedia of Polymer
Blends: Processing (Vol. 2, pp. 1-26). Weinheim: Wiley-VCH
Verlag GmbH & Co. KGaA. Retrieved in 12 November 2014,
from http://www.wiley-vch.de/books/sample/3527319301_c01.
20. Li, Y., & Shimizu, H. (2009). Toward a stretchable, elastic,
and electrically conductive nanocomposite: morphology and properties of poly[styrene-b-(ethylene-co-butylene)-b-styrene]/ multiwalled carbon nanotube composites fabricated by high-shear processing.Macromolecules, 42(7), 2587-2593. http://
dx.doi.org/10.1021/ma802662c.
21. Shimizu, H., Li, Y., Kaito, A., & Sano, H. (2005). Formation of
nanostructured PVDF/PA11 blends using high-shear processing. Macromolecules, 38(19), 7880-7883. http://dx.doi.org/10.1021/
ma051395f.
22. Li, Y., & Shimizu, H. (2011). Fabrication of nanostructured
optical and mechanical properties by high-shear.Processing Polymer Engineering and Science, 51(7), 1437-1445. http:// dx.doi.org/10.1002/pen.21879.
23. Teyssandier, F., Cassagnau, P., Gerard, J. F., Mignard, N., &
Melis, F. (2012). Morphology and mechanical properties of
PA12/plasticized starch blends prepared by high-shear extrusion. Materials Chemistry and Physics, 133(2-3), 913-923. http://
dx.doi.org/10.1016/j.matchemphys.2012.01.117.
24. Louizi, M., Massardier, V., Mélis, F., Alcouffe, P., & Cassagnau,
P. (2014). High shear processing of polypropylene/silica
nanocomposites: improvement of structure-properties. International Polymer Processing, 29(1), 118-127. http:// dx.doi.org/10.3139/217.2819.
25. Louizi, M., Massardier, V., & Cassagnau, P. (2014). Contribution
of high-shear processing to the compatibilization of (PP/EPR)/ PE ternary blends.Macromolecular Materials and Engineering, 299(6), 674-688. http://dx.doi.org/10.1002/mame.201300268. 26. Bouaziz, A., Jaziri, M., Dalmas, F., & Massardier, V. (2014).
Nanocomposites of silica reinforced polypropylene: Correlation
between morphology and properties.Polymer Engineering
and Science, 54(9), 2187-2196. http://dx.doi.org/10.1002/ pen.23768.
27. Vergnes, B., Valle, G. D., & Delamare, L. (1998). A global
computer software for polymer flows in corotating twin screw extruders.Polymer Engineering and Science, 38(11), 1781-1792. http://dx.doi.org/10.1002/pen.10348.
28. Gendron, R., & Binet, D. (1998). State of dispersion: Polypropylene
filled with calcium carbonate.Journal of Vinyl and Additive Technology, 4(1), 54-59. http://dx.doi.org/10.1002/vnl.10011.
29. Chen, G. H., Li, Y., & Shimizu, H. (2007). Ultrahigh-shear
processing for the preparation of polymer/carbon nanotube composites.Carbon, 45(7), 2334-2340. http://dx.doi.org/10.1016/j.
carbon.2007.07.017.
30. Li, Y., & Shimizu, H. (2007). High-shear processing induced
homogenous dispersion of pristine multiwalled carbon nanotubes in a thermoplastic elastomer.Polymer, 48(8), 2203-2207. http://
dx.doi.org/10.1016/j.polymer.2007.02.066.
31. Domenech, T., Peuvrel-Disdier, E., & Vergnes, B. (2012).
Influence of twin screw processing conditions on structure and properties of polypropylene-organoclay nanocomposites. International Polymer Processing, 27(5), 517-526. http://dx.doi. org/10.3139/217.2591.
32. Villmow, T., Kretzschmar, B., & Pötschke, P. (2010). Influence
of screw configuration, residence time, and specific mechanical energy in twin-screw extrusion of polycaprolactone/multi-walled carbon nanotube composites.Composites Science and Technology, 70(14), 2045-2055. http://dx.doi.org/10.1016/j.
compscitech.2010.07.021.
33. Serpe, G., Jarrin, J., & Dawans, F. (1990).
Morphology-processing relationships in polyethylene–polyamide blends. Polymer Engineering and Science, 30(9), 553-565. http:// dx.doi.org/10.1002/pen.760300908.
34. Bouaziz, A., Massardier, V., Louizi, M., & Jaziri, M. (2015).
Reinforcement of polyolefins-based nanocomposites: combination of compatibilizer with high shear extrusion process.Polymer Engineering and Science, 55(10), 2328-2338. http://dx.doi. org/10.1002/pen.24120.
35. Wu, S. H. (1987). Formation of dispersed phase in incompatible
polymer blends: interfacial and rheological effects.Polymer Engineering and Science, 27(5), 335-343. http://dx.doi. org/10.1002/pen.760270506.
36. Liu, J., Tang, G., Qu, G., Zhou, H., & Guo, Q. (1993).
Crystallization of rare earth oxide-filled polypropylene.Journal of Applied Polymer Science, 47(12), 2111-2116. http://dx.doi.
org/10.1002/app.1993.070471204.
37. Xiaomin, Z., Jingshu, L., Zhihui, Y., & Jinghua, Y. (1996).
Rheological properties and crystallization behavior of yittrium oxide filled low ethylene content polypropylene copolymer. Journal of Applied Polymer Science, 62(2), 313-318. http://
dx.doi.org/10.1002/(SICI)1097-4628(19961010)62:2<313::AID-APP6>3.0.CO;2-#.
Abbreviations
ABS: Acrylonitrile Butadiene Styrene resins DSC: Differential Scanning Calorimetry EVA: Ethyl Vinyl Acetate copolymer FR: Flame Retardant
LDPE: Low Density Polyethylene HDPE: High Density Polyethylene NIR: Near Infra Red
PET: Poly(ethylene terephtalate) PP: Polypropylene
PS: Polystyrene
PVC: Poly(Vinyl Chloride) RSD: Relative Standard Deviation SEM: Scanning Electron Microscopy UV: Ultra Violet
χC: Crystallisation Degree
![Table 1. A comparative study of the detection techniques used for detecting a tracer system [10] .](https://thumb-eu.123doks.com/thumbv2/123dok_br/18869555.419742/2.765.70.715.101.307/table-comparative-study-detection-techniques-used-detecting-tracer.webp)