Corresponding author: Carlos Wanderlei Piler de Carvalho, Embrapa Food Technology, Av. das Américas, 29501, Guaratiba, CEP 23020-470, Rio de Janeiro, RJ, Brasil, e-mail: [email protected]
Characterization of Cassava Starch Processed in an
Internal Mixer
Marcia Cristina da Silva
Institute of Chemistry, Federal University of Rio de Janeiro
Diego Palmiro Ramírez Ascheri
Science and Technology University Unity of Anapolis, State University of Goias
Carlos Wanderlei Piler de Carvalho, Melicia Cintia Galdeano
Embrapa Food Technology
Cristina Tristão de Andrade
Institute of Macromolecules Professor Eloisa Mano, Federal University of Rio de Janeiro
Abstract: An internal mixer connected to a torque rheometer was used to investigate the effect of moisture content
(13.2 to 46.8 g.100g–1), rotation speed (13.2 to 46.8 rpm) and processing temperature (53.2 to 86.8 °C), applying
a factorial central composite design, on the specific mechanical energy (SME), pasting viscosity and crystallinity of cassava starch. Torque values were highly significant for the three variables, showing decrease with increasing
moisture, temperature and rpm. The highest cold viscosity (CV) was obtained at 13.18 g.100g–1 moisture, 86.87 °C and
30 rpm due to increased rupture of starch granules caused by processing at lower moisture condition. Peak viscosity (PV) values were higher than CV values which indicated that the processing was not able to destroy completely the molecular integrity of the starch granules. Smaller setback (SB) at high temperature and rpm and low moisture showed possible starch depolymerization causing loss of recrystallization capacity. Processing under low moisture content resulted in reduction of crystallinity. The results showed that the effect of moisture was more pronounced than rotation speed and processing temperature of cassava starch.
Keywords: Specific mechanical energy, pasting viscosity, crystallinity.
Introduction
Starch, a major storage polysaccharide in plants, is used in a wide range of industries including confectionery, beverage or liquid flavor emulsions, pharmaceuticals, cosmetic products. It also used in non-food applications[1]. Recently, it has being used as primary
material for building biodegradable materials due to its abundance and low cost. Although raw granular starch is widely available, its physical properties compromise its use when plastic property is desirable, therefore the study of starch plasticity in non-food application has been receiving greater attention in recent literature[2-4],
Still, the knowledge of starch mixing properties is still needed.
Starch is a mixture of two macromolecular
α-glucans, linear amylose and branched amylopectin[5].
The use of starch as a biopolymer for films production is based on its chemical, physical and functional properties of amylose to form gels and its ability to form films. The amylose molecules in solution, due to their linearity, tend to oriented parallel and to form hydrogen bonds
between hydroxyls of adjacent polymers[6].
The granular starch has no thermoplastic characteristics[6]. To obtain a thermoplastic material, its
semi-crystalline granular structure needs to be destroyed to give a homogeneous and essentially amorphous
polymeric matrix[1]. The concomitant changes of
measurable properties, such as viscosity, crystallinity and size variation of starch granules, have been used to detect the extent of starch modification[7].
The starch modification process may be performed using equipment such as extruders, injection molding, cylinders, internal mixers and others[8].
The preliminary processing of the starch in an internal mixer connected to a torque rheometer is capable of providing an indication of the initial conditions to be used in the extrusion process[9].
According to Kromer[10] torque rheometer is
considered a process analyzer because it measures the work accomplished in the process of compounding materials under closely controlled conditions of temperature, shear and time. Changes in chemical state or viscosity can be continuously recorded using sensors in production equipment such as mixers and extruders. The torque data produced is interpreted in terms of work and power, which denote power requirements. Since torque can be related to any process, the torque rheometer covers a broad range of uses. Furthermore, it is an advantageous method because it provides immediate responses using smaller volume of sample when compared to processing in the extruder[9].
The aim of this study was to evaluate the influence of water content, rotors rotation speed and temperature
A
R
T
I
G
O
T
É
C
N
I
C
O
C
I
E
N
T
Í
F
I
C
in the processing of cassava starch in an internal mixer connected to a torque rheometer. The behavior of the mixtures was investigated by torque and temperature curves, obtained by processing. Other measurements were paste viscosity and relative crystallinity.
Material and Methods
Material and chemical analyses
Cassava starch was supplied by Granfino Indústria de Alimentos (Nova Iguaçu, Brazil). The chemical composition of cassava starch was 10.09% moisture, 89.66% carbohydrates, 0.14% proteins, 0.08% fat and 0.03% ash, which was obtained following the methodology described by AOAC standard methods: protein content method n. 46-13 (1995), fat content method n. 945.38 (2005), ash content method n. 923.03 (2005), moisture content was determined in oven at 105 °C until constant weight and carbohydrate by difference.
Sample processing
Mixtures of cassava starch and distilled water were prepared in the proportions shown in Table 1 and kept at 18 °C for 24 h before processing. The samples were processed for 20 min at different temperatures and rotations rates (Table 1) in a Rheomix 600 internal mixer equipped with counter-rotating roller type rotors in line connected to a Rheocord 9000 torque rheometer (Thermo Haake, Karlsruhe, Germany).
Torque and temperature curves were recorded over processing time in order to evaluate the flow behavior of the mixture. The area under the curve is related to the
energy absorbed by the material during processing[11].
Specific mechanical energy (SME) required for the processing of each sample was calculated according to equation SME = 2 π N / m ∫C(t)dt. Where N is the rotation
speed (rpm), m is the total sample mass (g), t is the
processing time (min) and C(t) is the total torque produced during the processing time (Nm). The SME was expressed in kJ/kg. After processing, the samples were allowed to cool, dried in oven for 10 h at 60 °C, milled in a disk mill 3600 (Perten Instruments, Huddinge, Switzerland) and in a roller mill QU-J (Brabender, Duisburg, Germany) and sieved. The sieved fraction between 106 and 212 µm aperture was used for measuring pasting properties and X-ray diffraction.
Pasting properties
A Rapid ViscoAnalyser (RVA-4) (Newport Scientific Pty. Ltd., Warriewood, Australia) was used to measure the apparent viscosity of the grinded samples, as a function of
temperature[12]. Three grams of sample, adjusted to 14%
moisture on a wet basis, were added on 25 g of distilled water. The suspension was sheared at 960 rpm for 10 s for homogenization and then at 160 rpm. Samples were kept at 25 °C for 4 min, then heated to 95 °C at a constant
heating rate of 14 °C min–1, held at this temperature for
3 min, cooled down to 25 °C in 5 min at the same rate and finally held at 25 °C for more 4 min. Cold viscosity (CV),
peak viscosity (PV) and setback (SB) were measured.
Crystallinity
Assays were performed in a X-ray diffractometer (Rich-Seifert and Co., Ahrensburg, Germany) using
copper Kα radiation, at 30 kV and 15 mA and analysis
done between 2θ=5° and 2θ=35°, at an angular interval of
0.05°. The relative crystallinity (dimensionless number) was calculated following the methodology described by Lopez-Rubio et al.[12] by integration of the area under the
peaks, reflecting the loss of crystallinity due to starch conversion.
Experimental design
The Central Composite Design (CCD) with three independent variables (moisture content, temperature and
rotation speed) was used[13]. The range of the independent
variables was established based on preliminary tests. For instance, the gelatinization temperature of cassava starch in excess of water, which occurs around 68 °C, was considered as a midpoint. For water content range, care was taken for not using too much water that would leak through the rotor seals, hence water content close to 50% was set as the maximum. Three levels, coded
as –1, 0 and +1 and two axial points (–α and +α) were
employed to fit a full quadratic response surface model. The real and coded levels are shown in Table 1. Five central points were included in the design in order to estimate the variability and to determine the precision of the mathematical model. The total number of runs was 20. Experimental conditions, selected for each variable, were based on prior studies. A second order polynomial model was used to fit the experimental data using the Statistica 8.0 (StatSoft, Tulsa, USA) computer software. Response surface methodology (RSM) was used to analyze the effect of the independent variables on the responses (dependent variables) (CV, PV, SB and crystallinity). Three-dimensional plots were obtained from the regression equation, keeping the response function on the Z axis with X and Y axes representing the independent variables, while keeping the other variable constant at the central points. Simultaneous optimization was carried out according to the methodology suggested
by Derringer and Suich[14], where all the individual
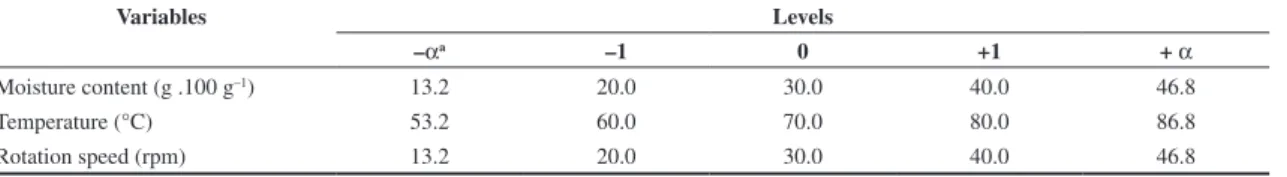
Table 1. Process variables and their real and coded levels.
Variables Levels
–αa –1 0 +1 + α
Moisture content (g .100 g–1) 13.2 20.0 30.0 40.0 46.8
Temperature (°C) 53.2 60.0 70.0 80.0 86.8
Rotation speed (rpm) 13.2 20.0 30.0 40.0 46.8
desirability functions (D) were combined into an overall desirability function, which is defined as the geometric
mean of individual desirability functions (di). The higher
the desirability value, the more desirable was the system.
Results and Discussion
Evaluation of processing in the mixing chamber
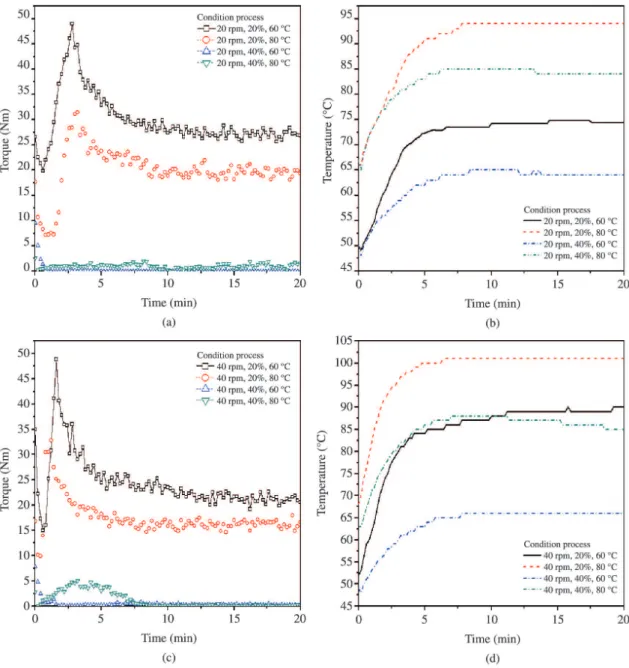
Typical curves of torque and temperature variation versus time are shown in Figure 1. Torque is related to viscosity of the material during processing and corresponds to the resistance to flow[9].
The combination of the parameters rotation speed, moisture content and temperature had significant influence on the torque values. Figure 1 (a, c) can be
analyzed based on Byrne[9] that described a typical
curve for a torque rheometer with two maximum peaks can be observed. The first occurred during loading and corresponded to the typical resistance imposed on the rotors due to introduction of the material into the mixer. When this resistance was overcome, torque required to move the rotors decreased. The second peak represented the phase transition of starch granules under shear stress. Afterwards, a steady state resulting in decreasing torque was achieved, indicating no further degradation under the conditions used.
According to the results obtained in this work, increasing moisture content torque was reduced, indicating that the destruction of crystalline structure of starch granules was favored in the presence of water. Silva et al.[15] reported that starch conversion/melting in
the presence of small amount of water is difficult and requires more energy to occur. This behavior has been explained based on plasticization of starch by water. Native starch melts above its degradation temperature and it is necessary to add a plasticizer in order to facilitate
processing[2]. Water acts as a plasticizer reducing
intermolecular interactions between adjacent molecules and the glass transition temperature (Tg) of starch while improving processability[16].
At high moisture content (40%), torque was close to zero (excluding the compaction peak) (Figure 1a, c) which can be explained by the reduction of Tg and increase of mobility of the polymeric chains, offering no resistance to the rotors.
It should be noted that, due to shear stress, temperature increased gradually with increasing time, which also resulted in a decrease of torque (Figure 1b, d). It is also clearly visible that temperature decreased with increasing water content. Mixtures with 40% moisture were able to hold temperature at values near to set temperature (programmed value). Deviations from set temperature was about 5 °C above the programmed value at 40% moisture, and between 15-20 °C at low moisture (20%). These results show the effect of moisture on Tg of starch: that is the greater the Tg reduction (high moisture), the easier the processing, which reduces the amount of shear
and mechanical energy being converted into heat[15].
Higher mechanical and thermal energy (high temperature and high rpm) favored the processing since the torque values were lower (Figure 1a, c). This is due to the fact that this energy generated favors the starch breakdown
resulting in reduced viscosity[15]. Increasing rpm from
20 to 40 rpm during processing, increased temperature approximately 10 °C at 20% moisture (Figure 1b, d). At high moisture (40%) this effect was not observed.
The effect of moisture was more pronounced than rpm and temperature. Two highest torque values (stabilized close to 30 Nm and 25 Nm for 20 and 40 rpm, respectively) were obtained at lower moisture content (20%).
Functional properties
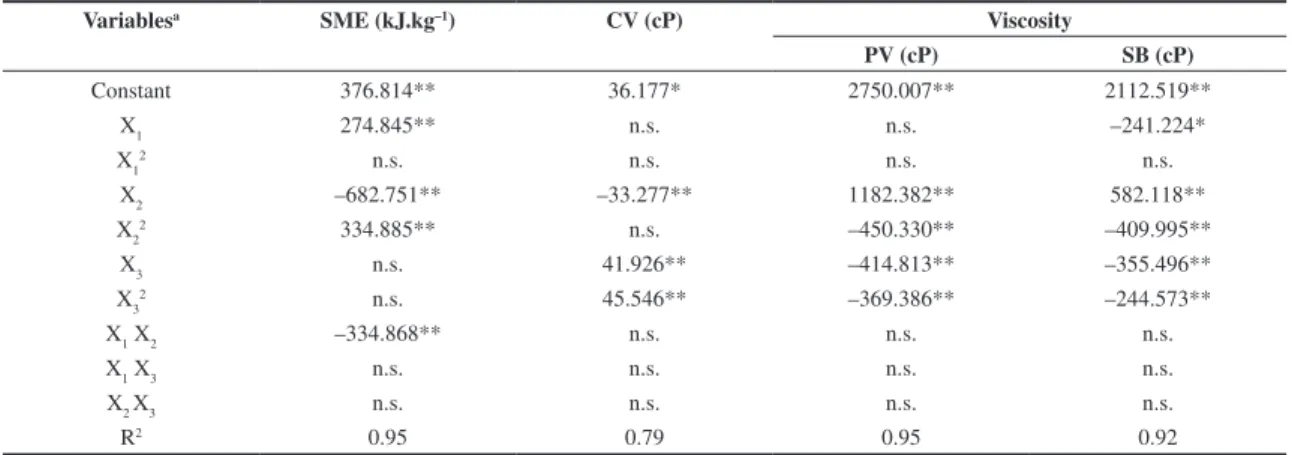
Regression models for the variables studied are shown in Table 2. All main effects (linear, quadratic and
interaction) were calculated for each model. According to analysis of variance (ANOVA), SME, PV and SB
models showed R2 greater than 92% indicating a good
fit to experimental data while regression model of CV
presented the smallest R2 value(79%).
SME is a good parameter to characterize the processing conditions and it may be defined as the energy input transmitted to the material during processing[17].
Linear effects of moisture and rotation speed and their interactions as well as the quadratic effect of moisture
were highly significant (p ≤ 0.01) for SME (Table 2).
Lower moisture and higher rpm resulted in higher SME. Positive effect of rotors speed implies in greater energy expenditure with this variable in its upper level. By contrast, the higher the moisture content the lower the SME. However, the interaction effect of moisture and rotation speed indicated that the increase of these both variables resulted in a reduction of SME values.
Low SME at high moisture content (Figure 2) could be explained by the decrease of shearing, attributed to the lubricating effect of water by reducing the total molecular
Table 2. Regression coefficients of mathematical models.
Variablesa SME (kJ.kg–1) CV (cP) Viscosity
PV (cP) SB (cP)
Constant 376.814** 36.177* 2750.007** 2112.519**
X1 274.845** n.s. n.s. –241.224*
X12 n.s. n.s. n.s. n.s.
X2 –682.751** –33.277** 1182.382** 582.118**
X22 334.885** n.s. –450.330** –409.995**
X3 n.s. 41.926** –414.813** –355.496**
X32 n.s. 45.546** –369.386** –244.573**
X1 X2 –334.868** n.s. n.s. n.s.
X1 X3 n.s. n.s. n.s. n.s.
X2 X3 n.s. n.s. n.s. n.s.
R2 0.95 0.79 0.95 0.92
SME=specific mechanical energy; CV=cold viscosity; PV=peak viscosity; SB=setback viscosity. aX
1= Rotation speed (rpm); X2= Moisture
content (g H2O .100 g–1); X
3= Temperature (°C).
n.s.No significant; *Significant at p ≤ 0.05; **Significant at p ≤ 0.01.
weight in the mixer, whereas an increase of SME with increase of rpm is due to the molecular friction caused by the simultaneous increase in shear rate[18].
Minimum (13.21 kJ.kg–1) and maximum
(3861.93 kJ.kg–1) SME values were obtained at rotation
speed, moisture content and temperature of 26.0 rpm,
38.0 g.100 g–1 and 70.0 °C and 46.81 rpm, 13.18 g.100 g–1
and 70.0 °C, respectively.
SME values were well correlated with torque measurements showing that the highest torque and SME were obtained at lowest moisture content. These results were similar to the findings of Silva et al[15] that showed
the effect of low plasticizer content during processing requires more energy to be performed, as the interaction forces between starch chains are higher resulting in low mobility and greater resistance to flow.
Pasting viscosity analysis is often used as an indicator of the degree of starch conversion and degradation
during processing[19]. Rotation speed did not affect cold
viscosity peak (CV) and peak viscosity (PV) (Table 2). Only the linear and quadratic effects of water content and
temperature (p ≤ 0.01) were significant. Setback viscosity
(SB) was negatively influenced by rotation speed and temperature indicating lower gel recovering. In contrast, the positive linear effect of moisture showed higher tendency to retrogradation at higher moisture content.
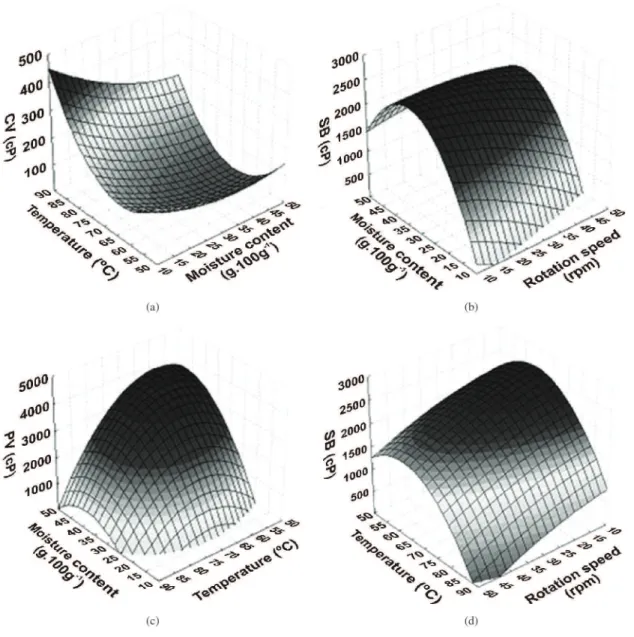
High CV values were found at higher temperature and lower moisture as shown in Figure 3. The highest
value (297.53 cP) was obtained at 13.18 g.100g–1
moisture content, 86.81 °C and 30 rpm. Lower water
content resulting in higher CV was also observed by
Silva et al.[15]. This behavior showed increased starch
breakdown caused by processing, thus leading to an
increased water retention capacity and higher CV[20]. In
contrast, higher moisture resulted in lower CV indicating
the presence of large amount of intact granules. Ayoub[21]
Figure 3. Effect of temperature and moisture content on cold viscosity (CV) and peak viscosity (PV) (a, b) and effect of rotation speed,
found that the reduction of starch conversion explained by the lubricating effect of water. These results confirm the data obtained from the torque curves (Figure 1) and SME measurements (Figure 2). The high CV value at low moisture (higher torque and SME) showed that the equipment needed to work harder under these processing conditions[15].
The increase of CV was caused by increasing
temperature. Li et al.[22] explained that when starch
granules are heated in the presence of water, the intermolecular hydrogen bonds break down, favoring the water and reduced viscosity. However, the high CV value (maximum 450 cP) indicates large amount of intact granules.
Starch granules not rupture during processing contributed to the high PV values were observed in the high moisture and low temperature specimens (Figure 3b).
PV values were higher than CV values (Figure 3a, b).
At 65 °C and 44.0 g.100g–1 moisture the PV was
3567.1 cP, showing that the processing was not able to destroy completely the starch molecular integrity. This residual starch was gelatinized during RVA analysis contributing to the pronounced increase of PV value.
Retrogradation tendency (SB) during cooling, when the amylose and amylopectin chains realign themselves, is another important characteristic of amylaceous products. Low SB values indicate a low rate of starch retrogradation[23].
Decreaseinmoisture contentcaused adecreaseinSB
while temperature and rpm were inversely proportional to SB, ie, the higher the temperature and rpm, the smaller the SB. Low SB indicates greater granular degradation and possible starch depolymerization, causing loss of recrystallization capacity. Severe processing conditions such as lower moisture, higher rpm and higher temperature are responsible for this effect[24]. The highest
SB (2466.6 cP) was found at low rpm (13.18 rpm), intermediate temperature (63 °C) and moisture content at the central point (30 g.100g–1).
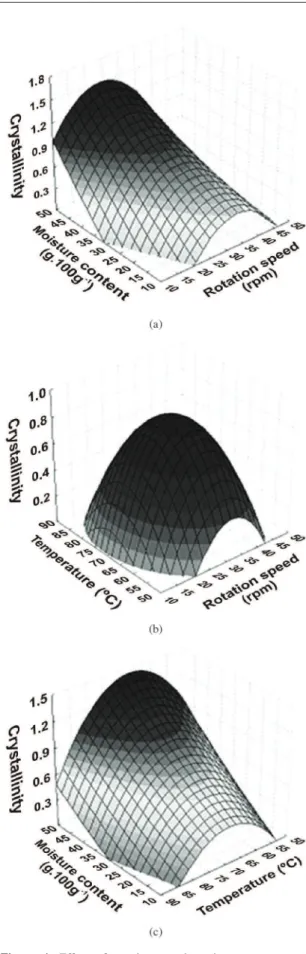
X-ray diffraction technique was used in order to study the effect of variables on loss of relative crystallinity of cassava starch after processing on a torque rheometer. Crystallinity values are dimensionless numbers and the smaller the value, the lower the crystallinity and the higher the process severity.
As expected, under low moisture condition the crystallinity was reduced (Figure 4). In this case, starch molecules can be depolymerized easily by heated or heated-sheared treatment, and the shear force in addition to the heat treatment contributed significantly to molecular cleavage[25]. Chang et al.[26] adds that starch granules may
resist under high moisture or low shear conditions, but with the increasing severity of treatment, the granules lose their semi-crystalline character.
At 13.18 rpm, 46.82 g.100g–1 moisture and 70 °C high
crystallinity value was obtained (1.14). The same value
was also reached at maximum moisture (46.82 g.100g–1),
minimum temperature (53.18 °C) and intermediate rpm (30 rpm). However, crystallinity decreased (0.85) when rotation speed and temperature values were minimum
(13.18 rpm and 53.18 °C, respectively) at 30 g.100g–1
Figure 4. Effect of rotation speed, moisture content and
temperature on crystallinity (a=temperature 70 °C; b=moisture
moisture. This behavior shows that the effect of moisture was more pronounced than rotation speed and processing temperature.
Rotation speed and temperature also affected the crystallinity. At intermediate temperature and rotation only partial disappearance of the crystalline structure of the starch took place, while increasing severity of thermal treatment and shear rate the granules lose their organized structure. A known effect of temperature on product transformation is the enhancement of the disruption of
the granules by gelatinization process[27]. Huneault and
Li et al.[28] also demonstrated that at higher extrusion
temperatures (140 °C), the structure of wheat starch was completely destroyed, leading to an X-ray pattern typical of an amorphous state.
The loss of crystallinity at low moisture condition
agrees with SME values. Xie et al.[29] reported that high
mechanical energy damages starch granules, the original crystallinitydramatically.
Since the processing in internal mixer modifies the
amylaceous material[15], its optimization was performed
considering the plastic characteristics of modified cassava starch. It should have high CV, intermediate PV value, minimum SB and low crystallinity, dissipating minimal energy during processing. Thus, the desirability function adopted were: 0, 0.5 and 1.0 as lower, intermediate and upper limits, respectively, for SME, crystallinity and CV and as lower, intermediate and upper limits values of 0, 1.0 and 0 for PV and 1.0, 0.5 and 0 for SB. Overall desirability score of 0.7633 was obtained when SME, crystallinity, CV, PV and SB values were 149.65 kJ/kg, 0.04, 242.32 cP, 953.43 cP and 1121.18 cP, respectively. These values were obtained when the independent variables rotation speed, moisture content and temperature were 16.55 rpm,
30.56 g.100g–1 and 86.82 °C, respectively.
Conclusion
The use of internal mixer coupled to a rheometer was successful in the direct measurement of some properties of cassava starch. An increase in moisture content decreased torque, SME and cold viscosity (CV) and increased peak viscosity (PV), retrogradation tendency (SB) and crystallinity. The lowest CV values were reached at the highest moisture content, confirming the higher torque and SME values. The loss of crystallinity that occurred at low moisture condition agrees with SME values. Cassava starch had its organized crystalline structure only partially destroyed since its observed PV values were higher than CV values. The most important factor affecting the starch modification was moisture content. Processing resulted in high CV, intermediate PV, minimum SB and low crystallinity; minimal energy dissipation was achieved at
16.5 rpm, 30.6 g.100g–1 moisture content and 86.8 °C.
Acknowledgements
The authors thank the financial support of Fundação Carlos Chagas Filho de Aparo à Pesquisa do Estado do rio de Janeiro (FAPERJ), Conselho Nacional de Desenvolvimento Científico e Tecnológico (CNPq) and
Coordenação de Aperfeiçoamento de Pessoal de Nível Superior (CAPES).
References
1. Mali, S.; Grossmann, M. V. E. & Yamashita, F. - Semina, 31,
p.137 (2010).
2. Galdeano, M. C.; Grossmann, M. V. E.; Mali, S.; Bello-Perez, L. A.; Garcia, M. A. & Zamudio-Flores, P. B. - Mat.
Sci. Eng. C, 29, p.492 (2009). http://dx.doi.org/10.1016/j.
msec.2008.08.031
3. Melo, C. P. B.; Grossmann, M. V. E.; Yamashita, F.; Youssef, E. Y.; Dall-Antônia, L. H. & Mali, S. J. - Polym.
Environm., 19, p.739 (2011). http://dx.doi.org/10.1007/
s10924-011-0325-1
4. Nafchi, A. M.; Moradpour, M.; Saeidi, M. & Alias, A.
K. - Starch/Stärke, 65, p.61 (2013).
5. Ellis, R. P.; Cochrane, M. P.; Dale, M. F. B.; Duffus, C. M.; Lynn, A.; Morrison, I. M.; Prentice, R. D. M. & Tiller,
S. A. - J. Sci. Food Agric., 77, p.289 (1998). http://dx.doi.
org/10.1002/(SICI)1097-0010(199807)77:3<289::AID-JSFA38>3.0.CO;2-D
6. Wurzburg, O. B. – “Cross-linking starches”, CRC Press, Boca Raton (1986). PMid:3703392.
7. Xue, T.; Yu, L.; Xie, F.; Chen, L. & Li, L. - Food
Hydrocolloids, 22, p.973 (2008). http://dx.doi.
org/10.1016/j.foodhyd.2007.05.008
8. Wiedmann, W. & Strobel, E. - Starch/Stärke, 43, p.138
(1991). http://dx.doi.org/10.1002/star.19910430404 9. Byrne, R. – “What is a torque rheometer?”, HaakeBuchler,
New Jersey (1984).
10. Kromer, H. M. – “Introduction to Torque Rheometry”, Saddle Brook, New Jersey (1978).
11. Fichatali, J. & Van Der Voort, F. R. - Cereal Foods
World, 34, p.921 (1989).
12. Lopez-Rubio, A.; Flanagan, B. M.; Gilbert, E. P. & Gidley,
M. J. - Biopolymers, 89, p.761 (2008). PMid:18428208.
http://dx.doi.org/10.1002/bip.21005
13. Montgomery, D. C. - “Design and Analysis of Experiments”, John Wiley and Sons, New York (1997).
14. Derringer, G. C. & Suich, R. - J. Quality Technol., 12,
p.214 (1980).
15. Silva, M. C.; Thiré, R. M. S. M.; Pita, V. J. R. R.; Carvalho,
C. W. P. & Andrade, C. T. - Cienc. Tecnol. aliment, 24,
p.303 (2004).
16. Bendaoud, A. & Chalamet, Y. - Carbohyd. Polym., 97,
p.665 (2013). PMid:23911499. http://dx.doi.org/10.1016/j. carbpol.2013.05.060
17. Ortiz, J. A. R.; Carvalho, C. W. P.; Ascheri, D. P. R.; Ascheri, J. L. R. & Andrade, C. T. Ciênc. Tecnol.
Alim., 30, p.205 (2010).
http://dx.doi.org/10.1590/S0101-20612010000100030
18. Liu, X.; Wang, Y.; Yu, L.; Tong, Z.; Chen, L.; Liu, H. & Li,
X. - Starch/Stärke, 65, p.48 (2013).
19. Zhang, Y.; Huang, Z.; Yang, C.; Huang, A.; Hu, H.; Gong,
Z.; Sun, G. & Huang, K. - Starch/Stärke, 65, p.461 (2013).
20. Nascimento, E. M. G. C.; Carvalho, C. W. P.; Takeiti, C. Y.;
Freitas, D. G. C. & Ascheri, J. L. R. - Food Res. Int., 45, p.434
21. Ayoub, A.; Liu, Y.; Miller, D. D. & Rizvi, S. S. H. - Starch/
Stärke, 65, p.517 (2013).
22. Li, J.; Vasanthan, T. & Bressler, D. C. - Carbohydr.
Polym., 87, p.1649 (2012). http://dx.doi.org/10.1016/j.
carbpol.2011.09.061
23. Hagenimana, A.; Ding, X. & Fang, T. - J. Cereal Sci., 43,
p.38 (2006). http://dx.doi.org/10.1016/j.jcs.2005.09.003 24. Menegassi, B.; Leonel, M.; Michan, M. M. & Pinho, S.
Z. - Cienc. Agrotec., 31, p.1780 (2007).
25. Taghizadeh, A. & Favis, B. D. - Carbohydr. Polym., 92,
p.1799 (2013). PMid:23399222. http://dx.doi.org/10.1016/j. carbpol.2012.11.018
26. Chang, Y. K.; Martinez-Bustos, F.; Park, T. S. & Kokini, J.
L. - Braz. J. Chem. Eng., 16, p.285 (1999).
27. Colonna, P. & Mercier, C. - Carbohydr. Polym., 3, p.87
(1983). http://dx.doi.org/10.1016/0144-8617(83)90001-2
28. Huneault, M. A. & Li, H. - J. Appl. Polym. Sci., 126, p.E96
(2012). http://dx.doi.org/10.1002/app.36724
29. Xie, F.; Halley, P. J. & Avérous, L. - Progr. Polym. Sci., 37,
p.595 (2012).