* e-mail: [email protected]
1. Introduction
Engineering structures experience degradation of strength with time due to environmental effects, in addition to long term effects during their service life. Study on aging of structures is necessary to model degradation mechanisms, in order to optimize the scheduling of inspections and repairs. Chloride induced corrosion of the reinforcing steel is identiied as one of the major causes of premature rehabilitation in reinforced concrete structures. Especially for bridge structures in chloride rich environments like coastal zone or subjected to de-icing salt treatment in winters, chloride induced corrosion forms the major cause of structural degradation. Premature rehabilitation is an obvious road block in the progress of infrastructure development. For this reason, considerable amount of research has been carried out in this area during past three decades, with an aim to cut down the funds spent on repair of built structures, so that it can be diverted to construction of new structures. Pioneers like Tuutti1 gave the basic corrosion initiation and propagation models. The mechanism of corrosion in RC members, starting from the initiation of corrosion (Collerpardi et al.2, Enright & Frangopol3, Kirkpatrick et al.4), to the propagation, leading to cracking/spalling of cover concrete (Liu & Weyers5, Alonso et al.6, Xia & Jin7) is very well investigated over the years. Corrosion in marine environments was elaborately studied by Melchers & Li8. Statistical model for concentration of chlorides in concrete was proposed by Engelund & Sorensen9. Improvements to existing corrosion deterioration models and life-cycle reliability models were proposed by
Vu & Stewart10. Enright & Frangopol3,11 published statistical characteristics of material properties and analytical degradation models based on investigations on existing structures. Most recent works of Possan & Andrade12 involve probabilistic modelling of degradation of concrete members by using homogeneous Markov chains.
Strength of a structural member decreases with time due to long term effects and environmental factors. The parameters affecting the strength are random variables. Structural design provisions of existing design codes like Indian Standard codes, do not give direct insight in the service life, the necessary maintenance or the probability of premature failure. Rather, the design rules are presented as deem-to-satisfy rules, assuming a structure is durable if the rules are satisied. Explicit service life design models are developed by some researchers and committees, like the Life 365 model13 and DuraCrete model14. Life 365 model follows a simpliied deterministic procedure, whereas DuraCrete model takes the uncertainties associated with the capacity and degradation mechanism in to account, and follows similar design methodology given by structural design codes, through a semi-probabilistic approach14. Modern performance based sustainable design methodologies require the inspection and repairs during the service life of a structure, to be taken care in the design stage itself. Eficient inspection scheduling can thus assist the engineer, to make a detailed cost-beneit analysis including the cost of repairs.
Design strategy for durability is to select an optimal material composition and cross-sectional detailing in order to reliably resist the degradation threatening the structure,
Stochastic Analysis of Flexural Strength of RC Beams Subjected to
Chloride Induced Corrosion
Parammal Vatteri Ahsanaa*, Kanchi Balaji Raob, Madambikattil Bharathan Anoopb
aAcademy of Scientiic and Innovative Research, Chennai, Tamil Nadu, India
bStructural Engineering Research Centre – CSIR, CSIR Campus, Taramani, Chennai 600113, India
Received: July 27, 2015; Revised: September 21, 2015
Importance of consideration of chloride induced corrosion in service life design of reinforced concrete (RC) structures situated in marine environment is well known. This paper attempts to provide, within the framework of Monte Carlo Simulation, methodologies for durability based service life design of RC members. A methodology using fragility curves is proposed to assist in the service life design of freely degrading RC lexural beams. For maintained RC beams, a methodology is developed, that incorporates the concepts of virtual aging, failure rate approach and time-variant reliability analysis. By addressing maintenance at the design stage itself, the methodology developed would help in sustainability based service life design. The use of both the methodologies is demonstrated by considering an example of T-beam. From the results of the example problem considered, it has been found that corrosion initiation time would govern the service life. 30% replacement of cement with pulverized fuel ash is considered as a sustainable alternative for construction of durable structures satisfying the service life performance targets with lesser number of repairs.
for a prescribed period of time. Design decisions are beset with uncertainties and hence, it is important to handle them in decision making. Probability based durability design techniques have been successfully implemented in construction of important structures, like container structures and sea side cities exposed to marine/coastal environment (Gjorv15). This paper is an attempt to develop such frameworks incorporating the uncertainties in variables, to analyse and design a new structure for a desired service life in given environmental exposure conditions. Hence, a time dependent stochastic analysis is required to formulate a framework for the reliability based service life design of RC structures (in this paper an RC beam is considered). Results presented in the form of fragility curves, which is the plot of conditional probabilities of failure, against various damage states, at different time instants, facilitate the design of freely degrading lexural members for a target failure probability at a given time in their service life. A novel methodology based on virtual aging concept (Brown & Proschan16, Kijima17, Balaji Rao et al.18) is proposed for reliability analysis of maintained lexural members, which can be used to analyse expected times of inspection and repair, against speciied durability limit states in RC structures. The methodology identiies that the corrosion initiation time is a random variable. This methodology can assist in durability-based design decision making, giving an opportunity to compare various options, in selection of type of concrete and cover thickness, and their respective future repair requirements and thus making the design consider the sustainability issues also. Further sustainable solution to durability problems is sought, by partial replacement of ordinary Portland cement (OPC) with pulverized fuel ash (PFA) in concrete, as it was observed to have profound inluence on the service life of RC lexural members subjected to chloride induced corrosion (Balaji Rao et al.19). An example problem of an RC T-beam is presented, to illustrate the proposed methodology.
2. Corrosion Initiation and Propagation
2.1. Corrosion initiation
From the review of literature it is known that the service life of RC members, subjected to pitting type of corrosion, is governed more or less by corrosion initiation time20. The ingress of chloride ions through the cover concrete is assumed to be governed by Fick’s second law of diffusion (Collerpardi et al.2, Enright & Frangopol3, Kirkpatrick et al.4). Thus the concentration of chloride ions at a distance ‘y’ from the surface of the member at any given time is given by
( , ) 0 y
c y t c 1 erf 2 Dt
= −
(1)
where c0is the surface chloride concentration at the surface of the member (assumed to be time invariant or constant source of chlorides is available), D is the time invariant diffusion coeficient of cover concrete and erf(.) is the error function evaluated at (.)
When the concentration of chloride ions at the surface of the reinforcing bars attain a value of critical chloride concentration (whose value depends on type of reinforcing bar material and type of concrete), depassivation of steel
would occur and corrosion of reinforcement is initiated. Thus, the corrosion initiation time using Equation 1, is given by,
~2 2
1 0 cr i 0 c c c T erf 4D c − − − = (2)
wherec~ is the clear cover to the reinforcement. By considering the variables ~c, , D c and c0 cr as random variables (depending on quality of workmanship and aggressiveness of environment), Ti becomes a random variable. Cover thickness plays an important role in deciding the initiation time of corrosion, as it can be observed from Equation 2. The diffusion coeficient depends on the type of concrete. It is lesser for PFA concrete compared to OPC concrete, thus delaying the initiation time of corrosion in PFA concrete members, compared to OPC concrete members of same sectional properties under same exposure conditions.
2.2. Corrosion propagation
After the initiation, corrosion propagates in the reinforcing bar, mainly depending on the availability of oxygen, the amount of RH and magnitude of temperature20. In some cases, the end of service life of a structure is deined by the appearance of cracks in cover concrete or when a speciied maximum crack width is reached. Thus, it is important to consider these two time instants also during the service life estimation. A good review of existing models for prediction of crack width can be found in Anoop21 and Otieno22. Some of the notable contributions in developing corrosion propagation models are summarized in Table 1, with their respective contributions and limitations (Markeset & Myrdal20, Malumbela23).
The reduction in reinforcing bar diameter during the corrosion propagation regime is given by1,3
( )t = ( )0 r− corr(t T− i)
φ φ (3)
where φ( )t is the remaining diameter at time t, φ( )0 is the initial diameter of bar. The rate of corrosion, rCORR given by7
.
corr corr
r =0 0116I α (4)
where ICORR is the corrosion current density in μA/cm2, α
is the pitting factor and 0.0116 is a conversion factor from μA/cm2 to μm/year.
A simple model to estimate time to irst crack from the initiation time of corrosion as proposed by Alonso et al.6 is used in this study, with a modiication to include pitting corrosion. In Alonso et al.6, it is assumed that irst crack is detected when the crack width is 0.05mm.
The time from corrosion initiation to irst cracking of the cover concrete, tCR, in years is given by,
p0 cr corr x t r
= (5)
~ /
p0
x = +a b cφ (6)
where a=7.53 and b=9.32 (from regression), ~c is the clear cover in mm, ϕ is the diameter of reinforcement in mm. IS code 45629 restricts the maximum crack width to 0.1 mm in structures exposed to coastal environment. Hence, a crack width of 0.1 mm is considered as one of the serviceability limit states in this paper.
The relationship proposed by Rodriguez et al.27 is used here to evaluate the crack width at time t, from attack penetration depth.
. ( p p0)
w 0 05= +β x −x (7)
where w is the crack width in mm,xpis the attack penetration corresponding to crack width in concrete at time t, and β is a factor equal to 0.01 for top cast bars and 0.0125 for bottom cast bars.
3. Time Variant Reliability Analysis
In the reliability analysis of degrading RC structural members time embeds in it, the information regarding probability distribution of available strength of the member. To study the evolution of this distribution over time, it is necessary to obtain the strength distributions at various time instances.
3.1. Resistance ratio
In this paper, to carry out time variant reliability analysis the resistance ratio, ψ(t), is considered. The same is given by,
( ) ( ) ( ) R t t R 0 =
ψ 0≤ψ
( )
t <1 0 t, ≤ < ∞(8)
where R(t) is the moment of resistance of the lexural member at time t, and R(0) is the initial moment of resistance (i.e. at time t=0). Once the reinforcement starts corroding, the moment of resistance of the cross-section decreases because of the loss in area of cross-section of the bars. Due to randomness in environmental parameters (that is, ICORR and α) the resistance ratio, ψ(t), in Equation 8, at any
given time t1, is a random variable. A general discussion on the expected nature of probability density function of ψ(t) at different times is presented in Section 3.2.
3.2. Distribution of resistance ratio
It can be expected that in the very early ages of the structure, the chance that it will have corroded reinforcement is very less and hence, resistance ratio is one. As time progresses, some of the sections undergo deterioration due to corrosion while the others would not have corroded reinforcement, depending on whether the corrosion initiation time associated with the cross-section is less than the time instant considered. This situation makes the nature of the probability distribution of resistance ratio non-stationary. As time progresses, more number of cross-sections will have corroded reinforcement and the nature of probability distribution is expected to stabilize. This aspect in the distribution of resistance ratio is incorporated in the present study. The conceptual igure representing the time embedding the distribution of resistance ratio is shown in Figure 1. Details of the parameters involved in the simulation of such distributions are discussed later in section 5.
Table 1. Some of the models for corrosion propagation.
Researchers Contributions Limitations
Bazant24 Analytical model for time to corrosion cracking, based
on the principle of a thick-walled (concrete) cylinder under uniform internal pressure caused by expansive corrosion products.
Inability to recognize that concrete is a porous material and contains voids.
Liu & Weyers5 Models consider: (i) the importance of cover thickness
in estimating the resistance of concrete to cracking due
to reinforcement corrosion, and (ii) the inluence of ICORR in estimation of the time to irst crack
Chlorides were added to concrete while mixing-hence initiation time of corrosion was not considered, sensitivity of a key parameter, viz. pore band around steel/concrete interface was not studied.
El Maaddawy & Soudki25
Model developed based on Faraday’s law; Considers the bar diameter, the current density, and the cover to bar diameter ratio as important factors.
Considers Poisson’s ratio and amount of voids in concrete as the only physical properties of concrete that affect its resistance to cracking.
Alonso et al.6
Expression for time to irst crack; relation between ~ c
/ϕ ratio and attack penetration; relationship between
maximum crack width and attack penetration.
Chlorides were added to concrete while mixing-hence initiation time of corrosion is not considered, cracks
smaller than 0.05mm are not identiied.
Rasheeduzzafar et al.26 Model for corrosion cracking dependent on bar
diameter, cover and concrete quality; Effect of corrosion on bond strength.
A very high corrosion current density was used, results differed from other studies.
Rodriguez et al.27 Model for evaluation of crack width as a function of
attack penetration.
Chlorides were added to concrete while mixing-hence initiation time of corrosion is not considered, crack widths were measured only at the end of testing, so progression with time was not captured.
Vidal et al.28 Model for crack width estimation, relating to steel
cross-section loss, without accelerated corrosion tests.
3.3. Development of Fragility curves for time
variant reliability analysis
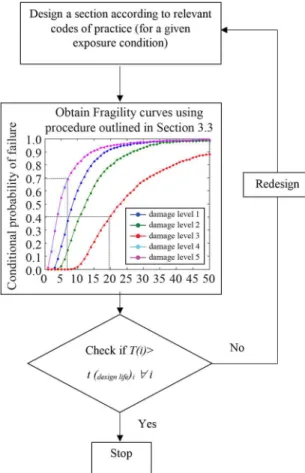
In order to carry out a durability based service life design, as a decision making problem, reliability analysis results have to be presented in a ready to use format. Fragility curves are the plots of conditional probabilities of failure of a freely degrading structure with time, with respect to various damage levels considered. To achieve cost-beneit effects in making engineering decisions, it is important to include more number of limits (in terms of damage levels) in the design-analysis. In the time varying reliability analysis procedure for freely degrading structures proposed in this paper, the following limits are identiied: Damage levels 1 to 3 correspond to different percentage losses of tensile steel as identiied in Table 2, damage level 4-time to irst corrosion crack in cover concrete and damage level 5- time to achieve a crack width of 0.1 mm. A limiting value of 0.1 mm is considered since the member is assumed to be exposed to marine environment. If the exposure is moderate then a limiting crack width of 0.3 mm can be used. Visual indications of corrosion is linked to speciic percentage loss of reinforcement by Andrade et al.30 as shown in Table 2.
Probability of failure can either be estimated in resistance domain or in time domain. Since damage levels 1 to 3 are directly related to the loss in steel area, which correspond to a speciic resistance ratio, it is easier to estimate probability
of failure in resistance domain. Probability of failure, PF against any one damage level k, is given by,
[
]
( ) ( )
f k
P t =Pψ t ≤ψ = 1-Fψ
( )
ψk (9)whereψkis the reference resistance ratio corresponding to the damage level k and FΨ
( )
ψ is the cumulative distributionfunction of ψ(t) at a given time t.
On the other hand, damage levels 4 and 5 are related to the attack penetration by Equations 5 and Equation 7 and the corresponding time instances can be calculated using these equations. Hence, PF against these damage levels can be estimated by posing the reliability analysis problem in the time domain. Time to irst crack of cover concrete (tcr) and time to achieve a corrosion crack width of 0.1 mm (tw) are then evaluated. tcr and tware random variables, since the corrosion rate is random. Conditional probabilities of failure against damage levels 4 and 5 are given by P tf( )=P t[ >tcr] and P tf( )=P t[ >tw], conditioned on tcr and tw. respectively. From the time-variant probabilities of failure against different damage levels, fragility curves can be plotted.
3.4. Methodology for service life design of freely
degrading systems using fragility curves
Fragility curves help in designing the sustainable structures, for given exposure conditions. A low chart of the design decision making process using fragility curves is presented in Figure 2. As shown in Figure 2, adequacy of a designed section for a desired performance level against ive damage levels mentioned above, can be ensured and redesigned if necessary. Designer can choose one or more desired damage level, kI (i=1 to 5) as the limit state of concern, and their corresponding allowable probabilities of failure
( )
falli
P and
the times within which these allowable values should not be exceeded. Let this
( )
falli
P be not exceeded up to a desired time during the service life, denoted by t(design)I. The time at which
( )
falli
P is exceeded is denoted by T(i). If the time
T(i) is less than t(design)I (for all i), redesigning is required to ensure required performance.
In most of the practical cases, structures are not allowed to degrade freely, instead they are maintained before they reach the end of service life. Reliability assessment and maintenance scheduling of such structures are addressed next.
4. Time Variant Reliability Analysis of
Maintained RC Flexural Members
One of the major features of performance based sustainable design methodology is that, it takes into account the maintenance of the structure as an integral part of the
Figure 1. Conceptual representation of time embedding resistance ratio distribution of the cross-section considered.
Table 2. Target serviceability limit states, proposed by Andrade et al.30.
Damage level
Reduction in area of reinforcement
Visual Indications
Colour changes Cracking Spalling
1 5% Rust stains Several longitudinal some on stirrups
Some
2 10% Rust stains Extensive Extensive
design itself (Trinius & Chevalier31). This paper addresses the sustainable design requirement (i.e. maintenance scheduling) through a methodology that integrates concepts of virtual aging, failure rate and time-variant reliability analysis. Virtual aging has been identiied as an attractive concept that can be utilized for scheduling repairs by Deodatis et al.32. Though virtual aging is a familiar concept in other engineering branches, it is hardly being explored for structural engineering applications. The concepts of virtual aging and failure rate approach are discussed below followed by a methodology for time-variant reliability analysis and maintenance scheduling, using them.
4.1. The concept of virtual aging
The term “virtual age” was originally deined as the corresponding “equivalent” age of a repairable item when a repair is imperfect. It works on the principle that, when a system is repaired to a desired level of resistance, it further undergoes degradation as if it is degrading from a time prior to the time of repair, at which the system had equivalent resistance (Figure 3). Due to the repair, a part of the degraded resistance of the member is restored. The amount of restoration of resistance depends upon the degree of repair, z, deined as the ratio of restored resistance to the un-degraded (initial) resistance. The effect of repair on resistance of the member is modelled by determining the virtual resistance ratio, V [ψ(t)] of the member.
Consider the case of a beam subjected to chloride induced corrosion of reinforcement. The value of ψ(t) reduces from 1.0 as the time, t increases (Figure 3). Assuming that a repair with z = z1 is carried out at time t = t1. As can be seen from Figure 3, degradation in resistance ratio from the initial resistance ratio (i.e., 1.0) after the completion of the irst repair is given by
(
)
{
( )
}
1 1 1
V = 1 z 1 V− − ψ t (10)
where V[ψ(t1)] = ψ(t1). Thus, after the repair, the resistance ratio of the member is (1.0-V1). Let t1* be the time corresponding to the value of the resistance ratio equal to the virtual resistance ratio at the completion of the irst repair. Thus, the virtual resistance ratio of the member after the irst repair is given by,
( )
(
(
*)
)
1 1 1
V ψ t =ψ t− t −t (11)
Similarly, after the second repair (t = t2)
(
)
{
( )
}
2 2 2
V = 1 z− 1 V− ψ t (12)
Let t2* be the time corresponding to the value of the resistance ratio equal to the virtual resistance ratio at the completion of second repair. Thus, the virtual resistance ratio of the member after the second repair is given by,
( )
(
(
*)
)
2 2 2
V ψ t =ψ t− t −t (13)
In general
(
)
{
( )
}
n n n
V = 1 z− 1 V− ψ t (14)
( )
(
(
*)
)
;
n n n n n 1
V ψ t =ψ t− t −t t ≤ ≤t t+ (15) where ‘n’ is the number of repairs, tN is the time of nth repair, zN is the degree of nth repair, V[ψ(t
N)] is the virtual resistance
ratio of the member just before the nth repair, t
N* is the time
corresponding to the value of the resistance ratio equal to the virtual resistance ratio at the completion of nth repair.
There will be variations in the values of D, c0, cCR, ICORR, and α due to the changes in exposure conditions (viz. Figure 2. Flow chart of Methodology for design decision making
for freely degrading systems using Fragility curves.
Figure 3. Virtual Aging-Resistance ratio Vs Time (Note: X(t) in
temperature, humidity). Also, the strengths of concrete and steel, and the cross-sectional dimensions of the member are stochastic in nature. In order to take into account these uncertainties, V[ψ(t)], at any time t, is considered as a random variable, similar to the resistance ratio of freely degrading RC beam.
4.2. Determination of Reliability using failure
rate approach
Failure rate approach for determination of reliability is a general method that can be integrated with virtual aging concept. The concept of virtual aging assumes that the system degrades at the same failure rate before and after a repair. Hence this approach is used to determine the reliability of the RC lexural member. Reliability against damage level k, by failure rate approach is given by18,
( )
( )
k
0 d
k
R =e− ∫
ψ
λ ψ ψ
ψ (16)
where ψK is the resistance ratio corresponding to the damage level k, λ(ψ) is the intensity or hazard rate or failure rate. Hazard rate is the conditional probability that failure of a structure or component occurs in the time interval (t, t + dt), given that the structure or component has survived up to time t. The hazard rate is given by18,
( ) ( ) ( ) ( ) ; ( ) . ( ) V V f
0 V 1 0 1 F = ≤ ≤ − ψ ψ ψ
λ ψ ψ
ψ (17)
where fV( )ψ ( )ψ is the probability density function of V(ψ) and fV( )ψ ( )ψ is the cumulative distribution function of V(ψ).
4.3. Methodology for reliability estimation and
maintenance scheduling
Using the concept of virtual aging and failure rate approach, a methodology is developed in this section for time variant reliability estimation incorporating maintenance scheduling. Assumptions and procedure of this methodology are discussed below.
Assumptions:
• The moment of resistance of the member reduces due to chloride induced corrosion of reinforcement.
• Deterministic repairs are carried out at speciied times when reliability falls below a pre-set target value.
• Time taken to repair is small compared to the service life of the structure.
• The time to corrosion initiation is random.
• The target resistance ratio, ψk, corresponding to the damage level k, is deterministic. It is to relect a true design scenario.
Step-by-step procedure for reliability estimation and maintenance scheduling:
1. Preliminary design: Design a preliminary cross-section of a T-beam for the required flexural capacity (demand) according to IS 45628. Obtain cross-section details from the design and statistical properties of random variables involved in the estimation of random resistance of the section from the literature.
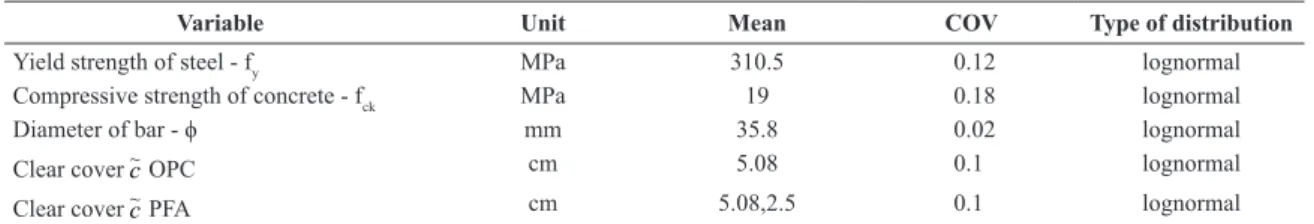
2. Generation of one thousand cross-sections: Using the statistical properties of compressive strength of concrete, yield strength of steel, diameter of bar, clear cover and cross-sectional properties (as given in Table 3, for instance), simulate one thousand cross-sections of the T-beam. Obtain the random initial resistance R(0) for all the simulated cross-sections.
3. Determination of distribution of Ti: Evaluate corrosion initiation time (Ti) using statistical properties of associated variables D, c0, cCR and
clear cover, obtained from literature (Table 4, for instance) for the given exposure conditions. Obtain the distribution of Ti.
Table 3. Random variables involved in Moment carrying capacity of the beam cross-section3.
Variable Unit Mean COV Type of distribution
Yield strength of steel - fy MPa 310.5 0.12 lognormal
Compressive strength of concrete - fck MPa 19 0.18 lognormal
Diameter of bar - ϕ mm 35.8 0.02 lognormal
Clear coverc~OPC cm 5.08 0.1 lognormal
Clear coverc~PFA cm 5.08,2.5 0.1 lognormal
Table 4. Random variables inluencing corrosion initiation time.
Variable units Distribution Parameters OPC Parameters PFA
C034 %wt of concrete Rectangular [0.211,0.401] [0.405,0.647]
Ccr34 %wt of concrete Rectangular [0.073, 0.182] [0.05, 0.15]
D34 cm2/yr lognormal Mean= 4.88
COV = 0.257
Mean= 0.1989 COV = 0.057
~
c3 cm lognormal Mean= 5.08
COV = 0.1
4. Setting target damage level: Identify the damage level (k) against which reliabilities are to be determined. In this investigation reliabilities against damage levels 1-3 (corresponding to 5%, 10% and 25% loss in steel area) are considered for the maintained systems.
5. Determining target resistance ratio: Determine the deterministic moment of resistance of the cross-section, RK, considering the loss in area of reinforcement corresponding to the damage level k and corresponding resistance ratio ψK = (RK/ R0). The initial resistance R0 is considered to be deterministic in order to obtain a deterministic target ψK.
6. Calculation of random rate of corrosion: To consider the randomness in environmental exposure by taking ICORR and α as random variables, one thousand random values of rCORR are generated and assigned to one thousand cross-sections considered.
7. Determination of remaining bar diameter: For each of the thousand cross-sections, at a speciied time, t, the time instant considered is compared with
the corresponding Ti , if t >Ti, the remaining area of steel is calculated using Equation 3. In calculating ϕ(t), the random value of rCORR associated with the cross-section is used.
8. Determination of time-variant resistance ratios: Determine the random moment of resistance at time t, R(t), using the remaining area of reinforcement at time t, and compute the resistance ratio of the cross-section, ψ(t). Fit truncated two parameter Weibull to the ψ(t) data.
9. Determination of mean virtual resistance ratio curve: If no repair has been carried out until t, virtual resistance ratio is same as resistance ratio. V[ψ(t)]=ψ(t). Otherwise calculate V[ψ(t)] by using Equation 15 , and with the help of mean resistance ratio degradation curve. This step is important to know the trend of variation of mean ψ(t) or V[ψ(t)].
10. Estimation of reliability: At each time step, calculate reliability based on failure rate approach by Equation 16 and Equation 17. Probability density- and cumulative distribution- functions of the itted distribution of ψ(t) (or V[ψ(t)] after 1st repair) can be used in the estimation of failure rate λ.
11. Repair decisions: If at any time, reliability falls below a speciied value (slightly less than 0.6 in following example), carry out a repair. Degree of repair can be chosen from a set of values corresponding to each event of repair. (in the following example, the values of degree of repair are taken as 0.95, 0.90, 0.90, 0.85, 0.85, 0.80, 0.80, 0.75, 0.75, 0.70, 0.70, 0.70, 0.65, 0.65, 0.65, 0.60, 0.60, 0.60, 0.55 and 0.55) (Balaji Rao et al.18). It is to be noted that the decision regarding the level of
repair should also take into account the eficiency of repair.
12. Estimation of degradation in virtual resistance ratio just after a repair: Degradation in resistance ratio from the initial resistance ratio (i.e., 1.0) at the completion of nth repair, V
n, is computed using Equation 14.
13. Computation of previous time instant with equivalent ψ(t): Compute the previous instant of time, tN* at which the value of resistance ratio is same as the regained (virtual) resistance ratio at the completion of nth repair. This can be achieved by interpolating the mean resistance ratio curve at the level of regained resistance ratio after repair.
14. Degradation after repair: Allow the system to degrade further at the same rate as before, as if it is degrading from tN*. Steps from 10 to 13 are to be repeated each time the reliability estimated in step 10 falls below a value of 0.6, in any one year time step. The system will then be repaired immediately. Continue the procedure till the end of desired service life is reached.
The proposed procedure is demonstrated with an example T-beam problem in the next section.
5. Example problem
A singly reinforced RC T-beam considered by Enright & Fangopol3 (Figure 4) is taken for demonstrating the usefulness of the methodologies presented in Sections 3.4 and 4.3. It is a singly reinforced T-beam, which is the part of a simply supported bridge of span 9.1 m. Site investigation data regarding this T-beam is available in the literature, which are the inputs for the present study. Probabilistic analyses are carried out for the two cases - considering the beam to be (i) freely degrading and the other (ii) assuming that the system is maintained. Studies are conducted on OPC and 30% PFA concrete beams. Monte –Carlo Simulation technique with one thousand simulations is applied to evaluate the time to initiation of corrosion, resistance ratio and reliability of the system against reference serviceability limit states as mentioned before.
Details of variables involved in determining the initial moment carrying capacity of the cross-section and initiation time of corrosion are given by Table 3 and Table 4, respectively.
Moment carrying capacities at times beyond initiation time of corrosion are calculated using reduced area of reinforcing steel. Details of variables related to the propagation of corrosion are given in Table 5. A service life of the bridge is considered as 50 years under sever exposure conditions33.
6. Results and Discussion
6.1. Initiation of corrosion
By considering random variables presented in Table 4, probabilistic analyses of Ti have been carried out. Histograms of Tiobtained for OPC and PFA concrete are shown in Figure 5. Table 6 compares the statistical properties of
i
T, for OPC concrete beam, with a clear cover of 5.08 cm, 30% PFA concrete beam with the same clear cover, and also having clear covers of 3.0 and 2.5 cm. For 30% PFA concrete beam two other clear covers are chosen, keeping
the effective depth the same, to examine whether the same target reliabilities can be achieved with lesser cover thickness. Mean initiation time of corrosion for OPC concrete beam is 6.69 years, whereas, for 30% PFA concrete beam having the same cover, the mean initiation time of corrosion is around 40 years. As service life is mainly governed by the initiation of corrosion (Liam36, Markeset & Myrdal20), this indicates that, replacement of 30% OPC with PFA can improve the service life approximately by about 6 times. For the target service life of 50 years, 30% PFA concrete beam with a lesser cover thickness of 2.5 cm still has superior durability properties than OPC concrete beam with 5.08 cm clear cover. This can bring considerable reduction in initial cost and also improved sustainability in to construction. The increase in Ti of 30% PFA concrete can be attributed, amongst others, to the experimental indings of Dhir & Byars37, that, 30% PFA concrete has a reduced permeability compared to the OPC concrete, both having been designed for the same compressive strength.
As can be observed from Figure 5 and Table 6, the variability of Ti (COV=1.08) for OPC concrete beam is very high, compared to that of 30% PFA concrete beam with varying cover thicknesses for which COV is around 0.35. Three candidate distributions - Normal, lognormal
Table 5. Random variables affecting the Propagation of corrosion.
Variable Unit Range Type of distribution
α7,34 - [4, 6] Rectangular
Icorr34,35 μA/cm2 [1, 10] Rectangular
Figure 5. Histogram of Ti- for OPC and 30% PFA concrete beams. (a) OPC concrete beam with cover 5.08 cm, (b) 30% PFA concrete
and Weibull - are itted to the random variable TI. At 5% signiicance level, acceptable value for K-S test statistic is 0.0438. As noted from Table 7, all the three distributions pass the test, , although it can be inferred that Weibull distribution and lognormal distribution it better for the corrosion initiation time of OPC and 30% PFA RC beams, respectively.
6.2. Resistance ratio
As expected, the probability distribution of resistance ratio is found to evolve with time (Figures 6 and 7). In the very early ages, the distribution of ψ(t) has a large peak at a value of 1, and a small tail. This indicates that in only a small fraction of one thousand beams corrosion would have
Table 6. Comparison of statistical properties of Ti, for beam cross-sections with OPC and 30% PFA concrete.
Type of concrete Mean of Ti (years) Standard deviation of Ti
(years)
COV of Ti
OPC- cover 5.08 cm 6.69 7.80 1.16
30% PFA- cover 5.08 cm 40.70 14.60 0.359
30% PFA- cover 3.00 cm 13.90 4.94 0.355
30% PFA- cover 2.50 cm 9.72 3.67 0.377
Table 7. Critical value of K-S test statistic for suitability of distribution itted to Ti.
Concrete type Lognormal Normal Weibull
OPC with clear cover 5.08 cm 0.032821 0.025323 0.023046 PFA with clear cover 2.5 cm 0.01776 0.023687 0.030199
initiated. As the time progresses, the distribution becomes more diffused. While the range space increases with the time, the form of resistance ratio distribution seems to stabilize (viz. at t = 30 and 40 years in Figures 6 and 7.
Mean resistance degradation of 30% PFA concrete beam is studied as an option towards the objective of achieving more economical and sustainable solution for durability problems compared to OPC. Mean of the resistance ratio of the OPC concrete beam with a cover of 5.08 cm, at times 10, 20, 30, and 40 years are 0.911, 0.754, 0.615 and 0.495 respectively, showing the decrease in lexural capacity of the beam with time. In the case of 30% PFA concrete beam with a lesser clear cover of 2.5 cm, the mean of the resistance ratios at these times are 0.968, 0.821, 0.678 and 0.553. The comparison of these values with those of OPC indicates the eficacy of the use of 30% PFA concrete to achieve the design objectives.
In order to characterize the non-stationarity of the distribution of ψ(t), variations in moments of the distribution with time are studied for both OPC and 30% PFA concrete beams. The same are presented in Figures 8a and 8b. It is observed from these igures that skewness and kurtosis tend to quickly stabilize with time, i.e. just after ive years. This
observation indicates that the type of distribution may not signiicantly vary after about ive years.
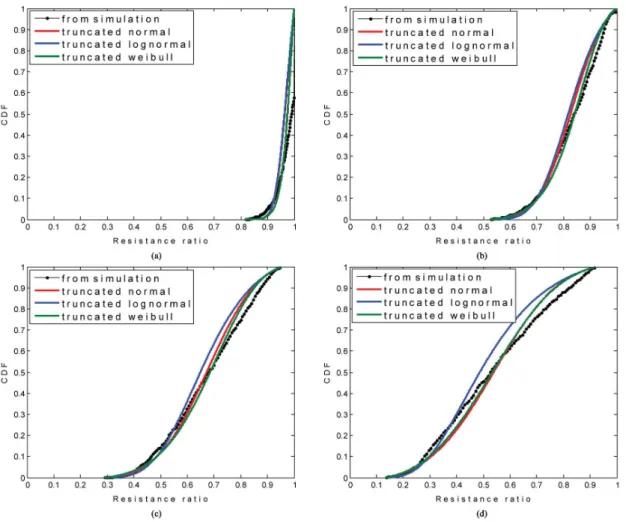
An attempt is made to ind best-it distribution for ψ(t). Three commonly used candidate distributions are considered for this purpose. Since values of resistance ratio ranges from zero to one, truncated distributions are used. Three distributions considered are 1) truncated normal, 2) truncated lognormal and 3) truncated two parameter Weibull distributions. The cumulative distribution functions of the candidate distributions are compared with those obtained from simulation at the ages of 10, 20, 30 and 40 years for both OPC and 30% PFA concrete members (Figures 9 and 10). K-S test are performed at different times, for the distributions considered, and the results are presented in Table 8. From this table, it can be noted that though none of the three distributions pass the K-S test at 5% signiicance level, truncated Weibull distribution is found to give a better it to the resistance ratio, compared to other two distributions. Also, results in Table 8 indicate that except at 40 years, K-S test value is least when two parameter truncated Weibull distribution is itted to the resistance ratio. Moreover, Weibull distribution is a well-accepted distribution for life analysis in engineering applications (Pham39,40). Hence, in the reliability analysis this distribution is used.
Figure 8. Moments of distribution of resistance ratio with time for OPC and 30% PFA concrete beams. (a) Variation of Mean and Standard Deviation of Resistance ratio with time-OPC (5.08 cm clear cover) & 30% PFA (2.5 cm clear cover), (b) Variation of Skewness and Kurtosis of Resistance ratio with time-OPC (5.08 cm clear cover) and 30% PFA (2.5 cm clear cover).
6.3. Reliability estimation
Using the resistance ratio distribution at a time step of one year over the service life of the beam, reliability is evaluated from the simulated data, and also from the itted distributions to the resistance ratio and using Equation 9. Reliability of the freely degrading OPC concrete beam (5.08cm clear cover) and 30% PFA concrete beam (2.5 cm clear cover), against damage level 3, are shown in Figure 11. At later ages, i.e. beyond half of the service life, the predicted reliability by itted distribution is conservative compared to the reliability values obtained from the simulation. In both
the cases, doubly truncated Weibull and normal distributions predict the time-variant reliabilities satisfactorily.
6.4. Fragility curves of freely degrading RC beam
Fragility curves for OPC concrete beam with 5.08cm cover and 30% PFA concrete beam with 5.08 cm and 2.5 cm covers are presented in Figure 12 against the ive damage levels considered (Section 3.3). As expected, for higher damage levels, the conditional probability of failure of the beam at any time is lesser compared to lower target damage levels. Fragility of 30% PFA concrete beam even with 2.5 cm clear cover is slightly lesser compared to the
Figure 10. Comparison of CDF of resistance ratio at different instances of time-30% PFA concrete (2.5 cm clear cover). (a) Time t=10 years, (b) Time t=20 years, (c) Time t=30 years, (d) Time t=40 years.
Table 8. K-S test results for resistance ratio distributions at different ages.
K-S test value-OPC* K-S test value-PFA*
Time(years) Truncated
Normal
Truncated Lognormal
Truncated Weibull
Truncated Normal
Truncated Lognormal
Truncated Weibull
10 0.1792 0.1915 0.1409 0.3614 0.3637 0.3593
20 0.1118 0.1362 0.0815 0.0948 0.1230 0.0532
30 0.0866 0.1248 0.0765 0.0623 0.1056 0.0471
40 0.0762 0.1326 0.0842 0.0612 0.1263 0.0632
Figure 11. Reliability of the freely degrading RC beam with time against damage level 3. (a) OPC concrete - 5.08 cm cover, (b) 30% PFA concrete – 2.5 cm cover.
fragility of OPC concrete beam with 5.08cm clear cover, against the corresponding damage levels, at a given time.
In OPC concrete beam, mean times to reach damage levels 1, 2 and 3 (i.e. mean time to attain 5%, 10% and 25% reduction in steel area) obtained from probabilistic analyses are 10.63, 14.69 and 27.25 years respectively. Hence, the mean corrosion initiation time (6.69 years) corresponds to 62.91%, 45.53% and 24.54% of these times. PFA concrete beam with the same cover as OPC concrete beam has very low probabilities of failure against all damage levels, at corresponding ages. At the end of 50 years, probability of failure against damage level 3, is less than 50% in the case of PFA concrete beam compared with OPC concrete beam having same cover. Another observation is that, there is 90% chance that the OPC beam develops corrosion cracking by the age of 10 years. In the case of 30% PFA concrete with the same cover, this serviceability limit state is arrived with 90% chance, only after 50 years of service life. Similar analyses
for the case of PFA concrete beam even with 2.5 cm cover reveal that, mean times at which damage levels 1, 2 and 3 are reached are 13.83, 17.97 and 31.16 years respectively. The mean initiation time (9.72 years) is 70.25%, 54.08% and 31.19% of these times. These results also bring out the importance of initiation time in determining total service life of RC members subjected to chloride induced corrosion of reinforcement.
From Figure 12, it can be noted that the fragility curves corresponding to damage levels 4 and 5, irrespective of the type of concrete and cover thickness, are close to each other. This indicates that once initiated, propagation of corrosion and degradation of cover concrete is very fast for the range of corrosion current density considered which is in agreement with what is reported in literature20. By generating these type of fragility curves and following a procedure shown in Flow Chart (Figure 2), it is possible to carry out durability based service life design of reinforced concrete members (degrading
freely due to chloride induced corrosion of reinforcement) by also considering sustainability aspects.
6.5. Reliability of maintained RC beam
From the probabilistic analyses of resistance ratio of OPC and 30% PFA concrete beams, whose results are presented in Section 6.3, it is found that the variations in ψ(t) can be described by doubly truncated two parameter Weibull distributions. Using this information and using the methodology presented in Section 4.3, the number of repairs required against three damage levels considered throughout the service life of the beam are found out. Three damage levels considered are those corresponding to the loss of area of reinforcement and the target reliability of slightly less than or equal to 0.6 is also considered for each damage level. As pointed out in Section 4.3, formulations related to reliability analysis are made in resistance space. Following the methodology outlined in section 4.3, time variant reliability analyses are carried out for the following three cases: (a) T-beam made of OPC with a clear cover of 5.08 cm, (b) T-beam made of 30% PFA concrete with a clear cover of 5.08 cm, and (c) T-beam made of 30% PFA concrete with a clear cover of 2.5 cm. The maintenance scheduling for these cases are shown in Figure 13 and the number of repairs required during the service life are presented in Table 9.
It is observed from Table 9 that partial replacement of OPC with PFA reduces the number of repairs required against all target damage levels. For the same cover thickness of the sections, and the service life of 50 years, OPC concrete beam requires 13 repairs, whereas 30% PFA concrete beam requires only 1 repair, against damage level 1. For the service life of 50 years, it may be more economical to use 30% PFA concrete with a lesser cover of 2.5 cm, which reduces the number of repairs against target damage level 1, from 13 to7 when compared to OPC concrete beam with clear cover of 5.08 cm. As the target damage level considered is higher (i. e. 25% reduction in area of reinforcing bar), the number of repairs required is lesser, compared to a lower target value of 5% or 10% reduction in area of bars.
7. Summary and Conclusions
Based on the investigations carried out, the initiation time of corrosion (Ti), is found to follow two parameter Weibull and lognormal distributions in the case of OPC and 30% PFA concrete beams, respectively. It is observed that mean initiation time constitutes around 60% of the mean time to achieve 5% loss in steel area due to corrosion, in OPC concrete beam. The same in the case of 30% PFA concrete beam with a cover of 2.5 cm, is approximately 70% of the mean time to achieve 5% loss in steel area,
which indicates that initiation time is even more important in this case. It is also to be noted that the use of 30% PFA concrete is preferred over the OPC concrete since the mean time to corrosion initiation is 9.72 years as against 6.69 years for OPC concrete. A case study of a jetty structure by Liam et al.36 and the COIN report20 also present similar observation, that initiation time of corrosion governs the service life of a RC structure in aggressive environmental conditions.
For important structures such as bridges, power plant structures, container terminals and sea space city infrastructure, probability based durability design procedures need to be evolved (viz. Gjorv15). Also, as pointed out by Trinius & Chevalier31, use of different materials need to be explored at the design stage to achieve sustainability and, inspection and possible maintenance scheduling is an integral part of the sustainability based design. Towards this objective two methodologies, irst based on fragility analysis of freely degrading RC beams and the latter based on virtual aging concept for maintained RC beams are proposed in this paper.
Using the results of fragility analyses, it was noted that OPC concrete despite having a cover of 5.08 cm, will almost certainly develop corrosion cracks by 15 years. In order to delay the development of cracks, a designer shall look for options like altering material composition of concrete, type of steel, additional surface protective measures etc. This paper considers the option of changing the composition of materials in concrete. Thus, using 30% PFA concrete in a beam having same cover, the probability of developing cracks is reduced to almost nil, at 15 years, and the same limit state is obtained, with 90% chance, only after 50 years (Figure 12b). Hence, it is suggested that PFA concrete can be used as an economical and sustainable alternative for obtaining the durability37.
Inspection/maintenance scheduling has been obtained by the application of the second methodology, for OPC and 30% PFA concrete beams. Number of repairs against damage levels 1 and 2 were found to approximately get halved, by using 30% PFA concrete even with a cover of 2.5 cm (comparing rows 1 and 3 of Table 9). This foresight into maintenance requirements of a structure helps the designer in decision making regarding material composition and approximate times for inspections. The proposed method can be extended to other types of concrete with mineral admixtures such as ground granulated blast furnace slag, silica fume, for different exposure conditions.
Acknowledgements
This paper is being published with the kind permission of Director, CSIR-SERC.
Table 9. Number of repairs for the T-beam with service life of 50 years.
Type of concrete Damage level 1 Damage level 2 Damage level 3
OPC-cover 5.08cm 13 8 2
30% PFA-cover 5.08 cm 1 1 1
References
1. Tuutti K. Corrosion of reinforcement in concrete. Stockholm: Swedish Cement and Concrete Research Institute; 1982. CBI report 4:82.
2. Collepardi M, Marcialis A and Turriziani R. Penetration of chloride ions into cement pastes and concretes. Journal of
the American Ceramic Society. 1972; 55(10):534-535. http:// dx.doi.org/10.1111/j.1151-2916.1972.tb13424.x.
3. Enright MP and Frangopol DM. Probabilistic analysis of resistance degradation of reinforced concrete bridge beams under corrosion. Engineering Structures. 1998; 20(11):960-971. http://dx.doi.org/10.1016/S0141-0296(97)00190-9.
4. Kirkpatrick TJ, Weyers RE, Anderson-Cook CM and Sprinkel MM. Probabilistic model for chloride induced corrosion service life of bridge decks. Cement and Concrete Research. 2002; 32(12):1943-1960. http://dx.doi.org/10.1016/S0008-8846(02)00905-5.
5. Liu Y and Weyers RE. Modelling the time-to-corrosion cracking in chloride contaminated reinforced concrete structures. ACI
Materials Journal. 1998; 95(6):675-681.
6. Alonso C, Andrade MC, Rodriguez J and Diez JM. Factors controlling cracking of concrete affected by reinforcement corrosion. Materials and Structures. 1998; 31(7):435-441. http://dx.doi.org/10.1007/BF02480466.
7. Xia J and Jin W. Prediction of corrosion-induced crack width of corroded reinforced concrete structures. In: Proceedings of
the 4th International Conference on the Durability of Concrete Structures; 2014. West Lafayette: Perdue University; 2014. 8. Melchers RE and Li CQ. Reinforcement corrosion and activation
time in concrete structures exposed to sever marine environments.
Cement and Concrete Research. 2009; 39(11):1068-1076. http:// dx.doi.org/10.1016/j.cemconres.2009.07.003.
9. Engelund S and Sorensen JD. A probabilistic model for chloride-ingress and initiation of corrosion in reinforced concrete structures. Structural Safety. 1998; 20(1):69-89. http://dx.doi. org/10.1016/S0167-4730(97)00022-2.
10. Vu KAT and Stewart MG. Structural reliability of concrete bridges including improved chloride-induced corrosion models.
Structural Safety. 2000; 22(4):313-333. http://dx.doi.org/10.1016/ S0167-4730(00)00018-7.
11. Frangopol M. Life-cycle performance, management, and optimization of structural systems under uncertainty: accomplishments and challenges. Structure and Infrastructure Engineering: Maintenance,
Management, Life-Cycle Design and Performance. 2011; 7(6):389-413. http://dx.doi.org/10.1080/15732471003594427. 12. Possan E and Andrade JJO. Markov chains and reliability
analysis for reinforced concrete structure service life. Materials Research. 2014; 17(3):593-602. http://dx.doi.org/10.1590/ S1516-14392014005000074.
13. Ehlen MA, Thomas MDA and Bentz EC. Life-365 service life prediction model version 2.0. Concrete International. 2009; 31(5):41-46.
14. Siemes T and Edvardsen C. Duracrete: service life design for
concrete structures: a basis for durability of other building materials and components? Canada: National Research Council Canada; 1999. p. 1343-1356.
15. Gjorv OE. Durability design and quality assurance of major concrete infrastructure. Advances in Concrete Construction. 2013; 1(1):45-63. http://dx.doi.org/10.12989/acc.2013.1.1.045. 16. Brown M and Proschan F. Imperfect repair. Journal of
Applied Probability. 1983; 20(4):851-859. http://dx.doi. org/10.2307/3213596.
17. Kijima M. Some results for repairable systems with general repairs. Journal of Applied Probability. 1989; 26(1):89-102. http://dx.doi.org/10.2307/3214319.
18. Balaji Rao K, Anoop MB and Appa Rao TVSR. Reliability analysis of stochastic degrading and maintained systems. In:
Proceedings of the 6th International Conference on Probabilistic Safety Assessment and Management; 2002; Puerto Rico. Puerto Rico: Internation Association for PSAM; 2002.
19. Balaji Rao K, Anoop MB and Appa Rao TVSR. A methodology for reliability-based design of concrete cover thickness with reference to chloride induced corrosion of reinforcement. In
Proceedings of the International Conference on Civil Engineering; 2001; Bangalore. Bangalore: Department of Civil Engineering, Indian Institute of Science; 2001. p. 215-221.
20. Markeset G. and Myrdal R. Modelling of reinforcement corrosion
in concrete - state of the art. Blindern: SINTEF Building and Infrastructure, Concrete Innovation Center; 2008. COIN Project report 7.
21. Anoop MB. Remaining life assessment of reinforced concrete
structural elements subjected to chloride induced corrosion of reinforcement. [Thesis]. Bangalore: Indian Institute of Science; 2009.
22. Otieno M. Corrosion propagation in cracked and uncracked
concrete. [Thesis]. Cape Town: University of Cape Town, 2008. 23. Malumbela G. Measurable parameters for performance of
corroded and repaired RC beams under load [Thesis]. Cape Town: University of Cape Town; 2010.
24. Bazant ZP. Physical model for steel corrosion in concrete sea structures–applications. Journal of Structural Division, 105(ST 6), 1155-1165, 1979.
25. El Maaddawy T and Soudki K. Model for prediction of time from corrosion initiation to corrosion cracking. Cement and
Concrete Composites. 2007; 29(3):168-175. http://dx.doi. org/10.1016/j.cemconcomp.2006.11.004.
26. Rasheeduzzafar, Al-Saadoun SS and Al-Gahtani AS. Corrosion cracking in relation to bar diameter, cover, and concrete quality.
Journal of Materials in Civil Engineering. 1992; 4(4):327-342. http://dx.doi.org/10.1061/(ASCE)0899-1561(1992)4:4(327). 27. Rodriguez J, Ortega LM, Casal J and Diez JM. Corrosion of
reinforcement and service life of concrete structures. Durability
of Building Material Components. 1996; 7(1):117-126. 28. Vidal T, Castel A and Francois R. Analyzing crack width to
predict corrosion in reinforced concrete. Cement and Concrete
Research. 2004; 34(1):165-174. http://dx.doi.org/10.1016/ S0008-8846(03)00246-1.
29. Bureau of Indian Standards – BIS. IS 456:2000: Indian Standard:
plain and reinforced concrete- code of practice. New Delhi: BIS; 2000.
30. Andrade MC, Alonso C and Gonzalez JA. An initial effort to use corrosion rate measurements for estimating rebar durability corrosion rates of steel in concrete. ASTM Special Technical
Publication. 1990; 1065:29-37.
31. Trinius W and Chevalier J-L. Sustainable construction in ISO/TC59, action for sustainability. In: Proceedings of the
2005 World Sustainable Building Conference; 2005; Tokyo. Tokyo: Institute of International Harmonization for Building and Housing; 2005.
32. Deodatis G, Ellingwood BR and Frangopol DM. Safety,
33. Indian Railway Standard, Code of practice for plain, reinforced
& prestressed concrete for general bridge construction. India; 1997. IRS Concrete Bridge Code.
34. Balaji Rao K and Anoop MB. Stochastic analysis of reinforced concrete beams with corroded reinforcement. In: Proceedings
of the Institution of Civil Engineers - Construction Materials;
2014. London: ICE; 2014. v. 167. p. 26-35.
35. Ausin V, Rodriguez J and Ortega LM. Measurement of corrosion rates on R.C. structures: a contribution to the assessment of damaged structures. Bulletin of the International Association
of Shell and Spatial Structures. 1991; 32(2):87-94.
36. Liam KC, Roy SK and North wood DO. Chloride ingress measurements and corrosion potential mapping study of a
24-year-old reinforced concrete jetty structure in a tropical marine environment. Magazine of Concrete Research. 1992; 44(160):205-215. http://dx.doi.org/10.1680/macr.1992.44.160.205. 37. Dhir RK and Byars EA. Pulverized fuel-ash concrete-intrinsic
permeability. ACI Materials Journal. 1993; 90(6):571-580. 38. Ang AHS and Tang WH. Probability concepts in engineering
planning and design. New York: Wiley; 1975. v. 1. 39. Pham H. Handbook of reliability engineering. London:
Springer-Verlag London Limited; 2003.
Notations
RC - Reinforced concrete.
OPC - Ordinary Portland cement.
PFA - Pulverized Fuel Ash.
c(y,t) - Concentration of chlorides at a depth y, at time t in % weight of concrete.
c0 - Concentration of chlorides on the surface of the concrete member, assumed as constant, in % weight of concrete.
ccr - Critical concentration of chlorides in % weight of concrete. D - Diffusion coeficient of concrete.
erf - Error function.
~
c - Clear cover to reinforcement.
Ti - Initiation time of corrosion.
tcr - Time to irst cracking ( 0.05 mm wide) in cover concrete.
tw - Time to crack width reaching 0.1 mm width.
Icorr - Corrosion current density in μA/cm2 α - Pitting factor.
rcorr - Rate of corrosion penetration μm/year. ϕ -Diameter of the bar.
ψ(t) - Resistance ratio at time t. P[.] -Probability of the event [.]
PF - Probability of failure.
xp0 - Attack penetration corresponding to 0.05 mm crack width in cover concrete.
xp -Attack penetration corresponding to crack width at time t.
z - Degree of repair.
V[ψ(t)] - Virtual resistance ratio.
R[ψk] - Reliability against damage level k. λ - Hazard rate.
( )( ) V
F ψ ψ - Cumulative distribution function of virtual resistance ratio.
( )( ) V
f ψ ψ - Probability density function of virtual resistance ratio.