, v.60, n.3, p.433-440, Jul./Sept. 2003
SOYBEAN YIELD ESTIMATION BY AN
AGROMETEOROLOGICAL MODEL IN A GIS
Luciana Miura Sugawara Berka; Bernardo Friedrich Theodor Rudorff*; Yosio Edemir Shimabukuro
National Institute for Space Research Remote Sensing Division, Av. dos Astronautas, 1758 12227010 -São José dos Campos, SP - Brasil.
*Corresponding author <[email protected]>
ABSTRACT: Agrometeorological models interfaced with the Geographic Information System – GIS are an alternative to simulate and quantify the effect of weather spatial and temporal variability on crop yield. The objective of this work was to adapt and interface an agrometeorological model with a GIS to estimate soybean [Glycine max (L.) Merr.] yield. Yield estimates were generated for 144 municipalities in the State of Paraná, Brazil, responsible for 90% of the soybean production in the State, from 1996/1997 to 2000/2001. The model uses agronomical parameters and meteorological data to calculate maximum yield which will be penalized under drought stress. Comparative analyses between the yield estimated by the model and that reported by the Paraná State Department of Agriculture (SEAB) were performed using the “t” test for paired observations. For the 1996/1997 year the model overestimated yield by 10.8%, which may be attributed to the occurrence of fungal diseases not considered by the model. For 1997/1998, 1998/1999 and 1999/2000 no differences (P > 0.05) were found between the yield estimated by the model and SEAB’s data. For 2000/2001 the model underestimated yield by 10.5% and the cause for this difference needs further investigation. The model interfaced with a GIS is an useful tool to monitor soybean crop during growing season to estimate crop yield. Key words: geographic information system, municipalities, weather, crop
PRODUTIVIDADE DE SOJA ESTIMADA POR MODELO
AGROMETEOROLÓGICO NUM SIG
RESUMO:Os modelos agrometeorológicos integrados em Sistemas de Informação Geográfica - SIG são uma alternativa para simular e quantificar o efeito da variabilidade espacial e temporal do clima sobre a produtividade agrícola.O objetivo deste trabalho foi adaptar e integrar um modelo agrometeorológico num SIG para estimar a produtividade da soja [Glycine max (L.) Merr.]. Foram geradas estimativas de produtividade para 144 municípios do Estado do Paraná, responsáveis por 90% da produção de soja no Estado, em cinco anos-safra no período de 1996/1997 a 2000/2001. O modelo utiliza parâmetros agronômicos e dados meteorológicos para o cálculo da produtividade máxima, a qual é penalizada quando ocorre estresse hídrico. A análise da comparação entre as estimativas municipais obtidas pelo modelo e aquelas divulgadas pela Secretaria de Estado da Agricultura e do Abastecimento (SEAB) do Paraná foi feita através do teste “t” para pares de observação. No ano safra 1996/1997 o modelo superestimou a produtividade em 10,8% em relação à SEAB, o que pode ser atribuído à ocorrência de oídio, cujo efeito não é considerado no modelo. Nos anos safras de 1997/1998, 1998/1999 e 1999/2000 não foram identificadas diferenças (P > 0,05) entre as estimativas do modelo e da SEAB. Em 2000/2001 a produtividade foi subestimada pelo modelo em 10,5%, sendo que as causas desta diferença precisam ser melhor investigadas. O modelo integrado no SIG mostrou ser uma ferramenta viável para acompanhar a cultura da soja ao longo da estação de crescimento, e estimar a produtividade em municípios do Estado do Paraná.
Palavras-chave: sistema de informação geográfica, municípios, clima, safra
INTRODUCTION
Yield estimation of soybean [Glycine max (L.) Merr.] in Brazil is accomplished subjectively through in-quires to farmers, analysis of previous crop yield data and observation of meteorological conditions during the grow-ing season. Based on this information, key people the soy-bean sector try to achieve consensual estimates on both,
planted area and expected crop yield. The subjectivity of this procedure opens up opportunities to look for alter-natives on more objective methods which can provide re-liable information on crop yield.
, v.60, n.3, p.433-440, Jul./Sept. 2003
variation on soybean production is largely related to the observed climatic conditions during each year. The effect of weather on crop yield can be estimated using mathemati-cal models, as demonstrated by Baier (1973), Doorenbos & Kassam (1979), Pedro Jr. et al. (1984), Rudorff (1985), Berlato (1987), Rudorff & Batista (1990, 1991), Fontana & Berlato (1998), Moraes et al. (1999), Hoogenboom (2000), Fontana et al. (2001), among others.
For non-irrigated crops such as soybean, both amount and distribution of rainfall during the growing season are important yield determinants. Doorenbos & Kassam (1979) proposed a model to quantify water stress effect on the final yield of several agricultural crops based on the relationship between actual and maximum evapo-transpiration, i.e. whenever the amount of water on de-mand is larger than that which is available, potential yield will be penalized.
Recent advances in the development of Geo-graphical Information Systems (GIS) have facilitated spa-tial data analysis for large geographical areas. Crop yield models can also benefit from the GIS technology to ana-lyze and model agrometeorological data (Hartkamp et al., 1999; Dang et al., 2000; Sugawara, 2001).
The objective of this work was to integrate an agrometeorological model in a Geographical Information System to quantify the effect of agrometeorological vari-ables on soybean yield in municipalities of the State of Paraná.
MATERIAL AND METHODS
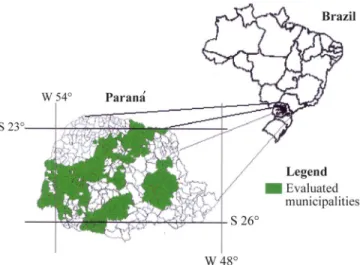
Crop monitoring and yield estimation were accom-plished by using an agrometeorological model integrated to a GIS (AGROMET; Sugawara, 2001) for 144 munici-palities in the State of Paraná, Brazil (Figure 1), which are responsible for about 90% of the soybean production in the State. The study was conducted over five growing sea-sons from 1996/1997 to 2000/2001. Yield outputs from the
AGROMET were compared to the reported yield estimates of the Paraná State Department of Agriculture (SEAB), which were used to adjust and validate the model outcome. The agrometeorological model integrated to the GIS is based on Doorenbos & Kassam (1979). Rudorff & Batista (1990) employed the method described by the former authors and developed a model in FORTRAN lan-guage to generate sugarcane yield estimates for a small re-gion with weather data coming from a single weather sta-tion. In the present study this model was adapted for soy-bean crop and integrated to a GIS with a database man-agement system interface using the SPRING (Georeferenced Information Processing System) software package version 3.6 (Câmara et al., 1996; SPRING, 2002). The LEGAL (Language for Algebraic Geoprocessing) pro-gramming module, within the SPRING software, was used to implement the several model procedures, which are re-ported in Sugawara (2001).
Weather data were obtained from 32 stations of the State of Paraná. The model used the following vari-ables: solar radiation, rainfall, air temperature, relative air humidity and wind speed. These data were then averaged on a biweekly basis, except for rainfall, which was summed up biweekly. A regular grid with 8000 m reso-lution in X and Y was generated using the quadrant weight average technique for interpolation (Felgueiras, 2001) to obtain the meteorological data for each munici-pality (Figure 2).
Figure 1 - Paraná State and the evaluated municipalities within the soybean production area (SEAB, 1987).
, v.60, n.3, p.433-440, Jul./Sept. 2003
Municipality boundaries for the State of Paraná are available in the SPRING software. Soil water hold-ing capacities were obtained from a digital soil map. A global remote sensing image of the state, acquired on April 09, 2000 by the WFI (Wide Field Imager) sensor on board of the CBERS (China-Brazil Earth Resources Satellite) satellite, was used to associate the spatial vari-ability of the meteorological data to the areas mainly des-ignated for soybean production within each municipal-ity. This image was acquired shortly after soybean har-vest and areas of intense agricultural activity appear well enhanced on the image. Yield estimates by the model (AGROMET) were based on the following equation (Doorenbos & Kassam, 1979):
−
−
=
m a y me
Y
1
k
1
Y
ET
ET
(1)
where Ye is the estimated yield (kg ha-1
), Ym the maximum yield (kg ha-1
), ky the yield response factor, ETa the ac-tual evapotranspiration (mm) and ETm the maximum evapotranspiration (mm).
Maximum yield (Ym) is established by the genetic characteristics of the crop and by the degree of crop ad-aptation to the environment (Doorenbos & Kassam, 1979). In this work, Ym was adjusted to the maximum yield average achieved for a healthy crop without water and nutrient deficiencies. Ym (kg ha-1) was estimated by the following restrictions and equations:
If ym > 20 kg ha-1
h-1
, then:
Ym = cL.cN.cH.G.(F(0.8 + 0.01ym)yo + (1-F)(0.5 + 0.025ym)yc), (2) If ym < 20 kg ha-1 h-1, then:
Ym = cL.cN.cH.G.(F(0.5 + 0.025ym)yo + (1-F)(0.5ym)yc), (3) where cL is the leaf area correction factor; cN is the net dry matter production factor; cH is the harvest factor; G
is the total growing period (days); F is the fraction of the day which is cloudy; ym is the production rate of dry mat-ter for the soybean crop (kg ha-1
h-1
); yo is the production rate of dry matter of a standard crop in completely cloudy days (kg ha-1
day-1
); yc is the production rate of a stan-dard crop in clear days (kg ha-1 day-1). The leaf area cor-rection factor (cL), which is related to the leaf area index (LAI), is determined by the following equation:
cL = 0.515 – e(-0.664-(0.515*LAI), (4) where LAI was obtained from Fontana et al. (1992), for non-irrigated conditions. The net dry matter production factor (cN) compensates the energy used in respiration, which is a function of temperature. When the mean tem-perature is below 20oC, the soybean plant uses 40% of the absorbed energy for maintenance and when the mean
temperature is above 20oC, it uses 50%. The harvest fac-tor (cH) indicates the relationship between dry matter pro-duction and grain propro-duction and was assumed to be 0.32. The maximum evapotranspiration (ETm) was cal-culated using potential evapotranspiration (ETo):
ETm = kc.ETo, (5) where kc is the crop coefficient and ETo is computed us-ing the Penman method (Frère & Popov, 1980).
The determination of the actual evapotranspiration (ETa) depends on three factors: the maximum evapotrans-piration (ETm), the remaining available soil water and the available soil water index (ASI; Doorenbos & Kassam, 1979). The water balance, which impacts the calculation of
ASI, was obtained using the method proposed by Thornthwaith & Mather following the description presented by Mota (1979) and adapted by Rudorff (1985). ETa was determined based on a look-up table given by Doorenbos & Kassam (1979) that considers the three factors just men-tioned. Finally all necessary variables to estimate crop yield (Ye) based on Equation 1 were obtained. The statistical com-parison between the soybean yield of the AGROMET and that reported by the SEAB, for each municipality, was per-formed using the “t” test (Steel & Torrie, 1980).
The soybean yield monitoring over the growing season, on a biweekly basis, was accomplished by using a penalizing index (kp) according to:
−
−
=
m a yp
1
k
1
k
ET
ET
(6)
Ym and kp were partially evaluated for nine biweekly pe-riods considering a growing season of 135 days begin-ning on November 1st and ending on March 15.
RESULTS AND DISCUSSION
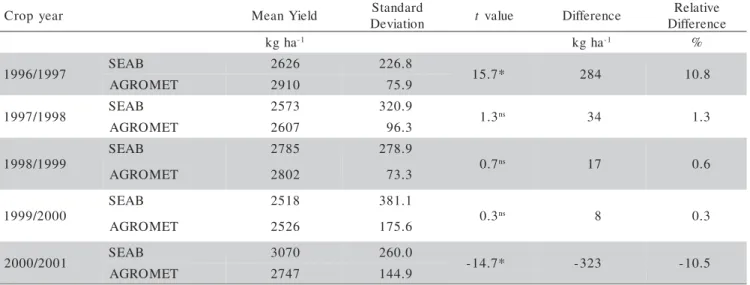
Only the mean yield estimate for the State for each growing season is presented. For the 1996/1997 growing season the model overestimated soybean yield by 10.8% in relation to SEAB (Table 1), which corre-sponds to a significant difference of 284 kg ha-1 (t=15.71;
α < 0.05). This difference can be attributed to the occur-rence of a fungal disease (SEAB, 1997) in susceptible soybean cultivars as weather conditions were favorable for its development (Yorinori, 2000). The disease effect on soybean yield was not considered in the model; how-ever, this effect can be modeled through other methods in order to correct the AGROMET estimation.
, v.60, n.3, p.433-440, Jul./Sept. 2003
2001 season the AGROMET underestimated soybean yield by 10.5%, as compared to the SEAB estimate, which cor-responds to a difference of 323 kg ha-1 (t=-14.71; α < 0.05). The reasons for this underestimation may be partly related to parameters that still need to be adjusted and refined in the model such as different sowing dates and soybean cul-tivars. Also, a greater number of weather stations through-out the State of Paraná will likely improve the spatial dis-tribution of the weather variables, especially rainfall, which is the most important and also the most variable. After the adjustment of the AGROMET parameters they were kept the same for the five growing seasons and, therefore, the variation in estimated soybean yield across years is only due to the variation of the weather data.
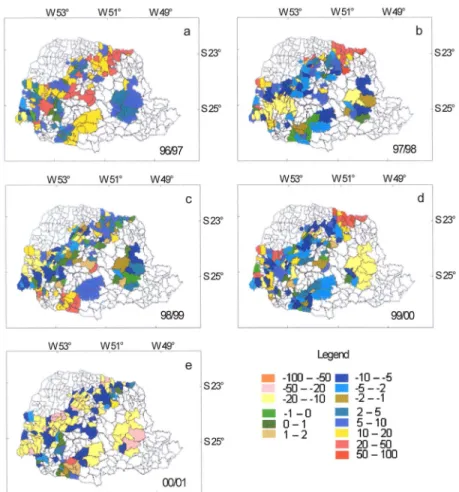
The relative difference between yield estimation of AGROMET and SEAB, for the five growing seasons was not consistent (Figure 3). Therefore, it was not pos-sible to account for pospos-sible technological differences among municipalities.
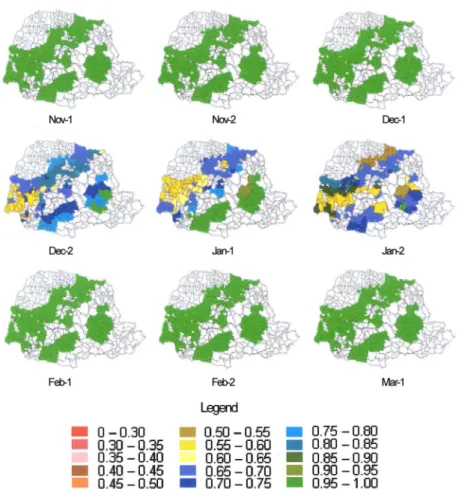
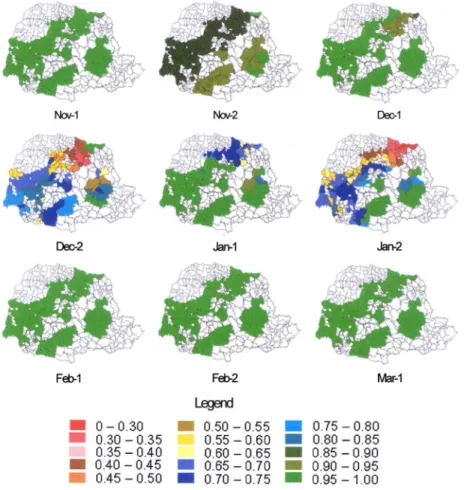
The penalizing index (kp) for biweekly periods throughout the growing season in each of the five analyzed cropping years (Figures 4 through 8), indicate the occur-rence of water deficit periods and their impact on yield. In 1996/1997 (Figure 4) the water deficit occurred only during the first half of January, when the value of kp, for the majority of the municipalities, varied between 0.65 and 0.80. This indicates that the dry matter accumulation for soybean was reduced by 20 to 35%. For 1997/1998 (Fig-ure 5) yield was impacted by “El Niño”, which usually fa-vors yield (SEAB, 1998). However, relative short dry pe-riods affected the availability of water for the crop during December and January, reducing yield in several regions of the State. In 1998/1999 (Figure 6) a mild water deficit was observed early in the growing season resulting in a heterogeneous development of several soybean fields
(SEAB, 1999). A more severe water deficit was recorded for the months of December and January when the poten-tial crop yield was heavily penalized. In 1999/2000, low rainfall in November, December and January caused a de-crease in soybean yield in almost all municipalities (Fig-ure 7). According to SEAB (2000) the loss was not greater due to the high technological level of the farmers.
Finally, in 2000/2001 (Figure 8) soybean potential yield was penalized in the second half of December and in January for most of the municipalities. The 2000/2001 season was similar in weather conditions to 1998/1999 and, consequently the AGROMET output was also very simi-lar for these two season. It is possible, however, that the water deficit observed in 2000/2001 was less critical than in 1998/1999 due to differences in planting dates.
The SPRING software, with its LEGAL program-ming module, was found to be adequate to integrate the agrometeorological model and the weather database in the GIS. The AGROMET is a powerful tool to monitor the weather impact on soybean yield on an operational ba-sis, at a relatively low cost and reduced time, for both local (municipalities) and regional (State) estimates.
CONCLUSION
The agrometeorological model integrated in a GIS (AGROMET) proved to be a powerful tool to ana-lyze the effect of both temporal and spatial variability of weather data on soybean yield. AGROMET generated objective soybean yield estimates comparable to the of-ficial reported estimates for three out of the five grow-ing seasons analyzed. AGROMET also demonstrated to be an important tool to monitor soybean crop through-out the growing season and generate objective yield es-timation at both municipality and state levels.
r a e y p o r
C MeanYield Standard n o i t a i v e
D t value Difference
e v i t a l e R e c n e r e f f i D a h g
k -1 kgha-1 %
7 9 9 1 / 6 9 9
1 SEAB 2626 226.8 15.7* 284 10.8 T E M O R G
A 2910 75.9
8 9 9 1 / 7 9 9
1 SEAB 2573 320.9 1.3ns 34 1.3
T E M O R G
A 2607 96.3
9 9 9 1 / 8 9 9 1 B A E
S 2785 278.9
7 .
0 ns 17 0.6
T E M O R G
A 2802 73.3
0 0 0 2 / 9 9 9 1 B A E
S 2518 381.1
3 .
0 ns 8 0.3
T E M O R G
A 2526 175.6
1 0 0 2 / 0 0 0
2 SEAB 3070 260.0 -14.7* -323 -10.5 T E M O R G
A 2747 144.9
Table 1 - Mean and standard deviation of soybean yield in municipalities of the State of Paraná based on estimates from SEAB and AGROMET model, t test values for paired observations, absolute difference and relative difference among estimates.
, v.60, n.3, p.433-440, Jul./Sept. 2003
Figure 3 - Relative difference (%) between yield estimation of AGROMET and SEAB.
, v.60, n.3, p.433-440, Jul./Sept. 2003
Figura 5 - Biweekly penalizing index of soybean in Paraná State – crop year 1997/1998.
, v.60, n.3, p.433-440, Jul./Sept. 2003
Figure 7 - Biweekly penalizing index of soybean in Paraná State – crop year 1999/2000.
, v.60, n.3, p.433-440, Jul./Sept. 2003
Received September 27, 2002 Accepted March 6, 2003
ACKNOWLEDGEMENTS
To the Agronomic Institute of Paraná (IAPAR) for providing the meteorological database and to the Paraná State Department of Agriculture (SEAB) for providing the official soybean yield estimations. Special thanks to Dr. João Argemiro for his valuable suggestions during the in-tegration of the agrometeorological model in the SPRING software and to João Pedro Cordeiro for his support pro-vided during the LEGAL programming.
REFERENCES
BAIER, W. Crop-weather analysis model: review and model development. Journal of Applied Meteorology, v.12, p.937-947, 1973.
BERLATO, M.A. Modelo de relação entre o rendimento de grãos de soja e o déficit hídrico para o Estado do Rio Grande do Sul. São José dos Campos: INPE, 1987. 94p. (Tese - Doutorado)
CÂMARA, G.; SOUZA, R.C.M.; FREITAS, U.M.; GARRIDO, J.C.P. SPRING: Integrating Remote Sensing and GIS with Object-Oriented Data Modelling. Computers and Graphics, v.15, p.13-22, 1996. DANG, A.; WANG, X.; WU, H. GIS based study on the potential grain
productivity of China. [CD-ROM]. In: INTERNATIONAL GEOSCIENCE AND REMOTE SENSING SYMPOSIUM, IGARSS 2000, Honolulu, 2000. Proceedings. Piscataway: IEEE Publications, 2000.
DOORENBOS, J.; KASSAM, A.H. Yield response to water. Rome: FAO, 1979. 193p. (Irrigation and Drainage Paper, 33).
FELGUEIRAS, C.A. Modelagem numérica de terreno. In: CÂMARA, G.; DAVIS, C.; MONTEIRO, A.M.V. Introdução à ciência da geoinformação. 2001. <http://www.dpi.inpe.br/gilberto/livro/introd/> (June, 2002)
FONTANA, D.C.; BERLATO, M.A. Modelo agrometeorológico–espectral para a estimativa do rendimento de soja no Rio Grande do Sul: um estudo preliminar. (CD ROM). In: SIMPÓSIO BRASILEIRO DE SENSORIAMENTO REMOTO, 9., Santos, 1998. Anais. São Paulo: Imagem Multimídia, 1998.
FONTANA, D.C.; BERLATO, M.A.; BERGAMASCHI, H. Alterações micrometeorológicas na cultura da soja submetido a diferentes regimes hídricos. Pesquisa Agropecuária Brasileira, v.27, p.661-669, 1992. FONTANA, D.C.; BERLATO, M.A.; LAUSCHNER, M.H.; MELLO, R.W.
Modelo de estimativa de rendimento de soja no Estado do Rio Grande do Sul. Pesquisa Agropecuária Brasileira, v.36, p.399-403, 2001. FRÈRE, M.; POPOV, G.F. Pronóstico de cosechas basado en datos
agrometeorológicos. Roma: FAO, 1980. 66 p. (Producción y Protección Vegetal Cuaderno Técnico, 17).
HARTKAMP, A.D.; WHITE, J.W.; HOOGENBOOM, G. Interfacing geographic information systems with agronomic modelings: A review. Agronomy Journal, v.91, p.761-772, 1999.
HOOGENBOOM, G. Contribution of agrometeorology to the simulation of crop production and its applications. Agricultural and Forest Meteorology, v.103, p.137-157, 2000.
MORAES, A.V.C.; CAMARGO, M.B.P.; PEREIRA, J.C.V.N.A.; MASCARENHAS, H.A.A. Teste de modelos agrometeorológicos de estimativa de produtividade para a cultura da soja na região de Ribeirão Preto-SP, baseados em balanços hídricos climatológicos e de cultura. (CD ROM). In: CONGRESSO BRASILEIRO DE AGROMETEOROLOGIA, 11., Florianópolis, 1999. Anais. Florianópolis.
MOTA, F.S. Meteorologia agrícola. São Paulo: Nobel, 1979. 376p. PEDRO JR., M.J.; CAMARGO, M.B.P.; MIRANDA, M.A.C.; BRUNINI,
O.; ORTOLANI, A.A.; ALFONSI, R.R. Teste de modelo agrometeorológico para estimativa da produtividade da cultura da soja de ciclo precoce. In: CONGRESSO BRASILEIRO DE AGROMETEOROLOGIA, 3., Campinas. Anais. Campinas: Sociedade Brasileira de Agrometeorologia, 1984. p.11-17.
RUDORFF, B.F.T. Dados Landsat na estimativa da produtividade agrícola da cana-de-açúcar. São José dos Campos: INPE, 1985. 114p. (Dissertação - Mestrado)
RUDORFF, B.F.T.; BATISTA, G.T. Yield estimation of sugarcane based on agrometeorological-spectral models. Remote Sensing of Environment, v.33, p.183-192, 1990.
RUDORFF, B.F.T.; BATISTA, G.T. Wheat yield estimation at the farm level using TM Landsat and agrometeorological data. International Journal of Remote Sensing, v.12, p.2477–2484, 1991.
SECRETARIA DE ESTADO DA AGRICULTURA E DO ABASTECIMENTO DO PARANÁ - SEAB. Instituto de Terras, Cartografia e Florestas (ITCF). Atlas do Estado do Paraná. Curitiba, 1987.
SECRETARIA DE ESTADO DA AGRICULTURA E DO ABASTECIMENTO DO PARANÁ – SEAB. Acompanhamento da situação agropecuária no Paraná, v.23, p.1-73, 1997.
SECRETARIA DE ESTADO DA AGRICULTURA E DO ABASTECIMENTO DO PARANÁ – SEAB. Acompanhamento da situação agropecuária no Paraná, v.24, p.1-73, 1998.
SECRETARIA DE ESTADO DA AGRICULTURA E DO ABASTECIMENTO DO PARANÁ – SEAB. Acompanhamento da situação agropecuária no Paraná, v.25, p.1-77, 1999.
SECRETARIA DE ESTADO DA AGRICULTURA E DO ABASTECIMENTO DO PARANÁ – SEAB. Soja - Desempenho da safra paranaense - 99/00 Avaliação preliminar. 2000 <http:// www.pr.gov.br/seab/>. (June, 2002).
SPRING - Sistema de Processamento de Informações Georeferenciadas. Instituto Nacional de Pesquisas Espaciais - INPE. 2002. <http:// www.dpi.inpe.br/spring/> (November, 2002).
STEEL, R.G.D.; TORRIE, J.H. Principles and procedures of statistics: a biometrical approach. New York: McGraw-Hill, 1980. 633p. SUGAWARA, L.M. Avaliação de Modelo Agrometeorológico e Imagens
NOAA/AVHRR no Acompanhamento e Estimativa de Produtividade da Soja no Estado do Paraná. São José dos Campos: INPE, 2001. 181p. (Dissertação - Mestrado)