NUTRITIONAL DIAGNOSIS FOR EUCALYPT
BY DRIS, M-DRIS, AND CND
Gualter Guenther Costa da Silva1*; Júlio César Lima Neves1; Víctor Hugo Alvarez V.1; Fernando Palha Leite2
1
UFV - Depto. de Solos - 36570-000 - Viçosa, MG - Brasil. 2
CENIBRA S.A - C.P. 100 - 35160-970 - Ipatinga, MG - Brasil. *Corresponding author <[email protected]>
ABSTRACT: The evaluation of the nutritional status in eucalypt (Eucalyptus grandis W. Hill ex Maid.) forests through vegetal tissue analyses what reflects water and nutrient flows in the system, and represents a complementary tool to soil analysis can be helpful to raise and maintain the forest productivity at high levels. This study compared the use of the Diagnosis and Recommendation Integrated System (DRIS), Modified-DRIS (M-Modified-DRIS), and Compositional Nutrient Diagnosis (CND) diagnose methods in eucalypt stands in Central-Eastern Minas Gerais State, Brazil. Data of productivity and of N, P, K, Ca, and Mg leaf contentsin 993 Eucalyptus grandis stands aging between 72 and 153 months, planted on six sites in 3 × 2 m spacing, were used. The nutritional status was diagnosed by the DRIS, M-DRIS, and CND methods, and validated by the chi-square (χ2) test applied to the nutrients diagnosed as primary limiting by deficiency. These three methods were compared to each other based on the diagnosis concordance frequency (DCF) derived from the fertilization response potential (FRP) by the criteria considering each nutrient separately; from all (5) to none (0); and only the primary limiting nutrients by eitherdeficiency or excess. The diagnosis concordance level among the methods was procedure-dependent, and varied according to the nutrient concentration in trees. Key words: Eucalyptus grandis, leaf analysis, leaf diagnosis, mineral nutrition
DIAGNOSE NUTRICIONAL DO EUCALIPTO PELO
DRIS, M-DRIS E CND
RESUMO: A avaliação do estado nutricional em florestas de eucalipto (Eucalyptus grandis W. Hill ex Maid.), mediante análises de tecido vegetal, pode ser importante para elevação e manutenção em níveis elevados da produtividade florestal, pois, reflete os fluxos de água e de nutrientes no sistema, sendo ferramenta complementar à análise de solo. O presente trabalho foi realizado aplicando-se o Sistema Integrado de Diagnose e Recomendação (DRIS), DRIS modificado (M-DRIS) e Diagnose da Composição Nutricional (CND), com o objetivo de comparar as diagnoses realizadas entre os métodos DRIS, M-DRIS e CND para o eucalipto, em localidades da região Centro-Leste de Minas Gerais. Foram utilizados dados de produtividade e dos teores de N, P, K, Ca e Mg nas folhas, referentes a 993 talhões de Eucalyptus grandis com idades variando de 72 a 153 meses, plantados no espaçamento 3 × 2 m em seis localidades dessa região. A diagnose do estado nutricional foi realizada utilizando-se o DRIS, M-DRIS e CND e validada pelo teste do qui-quadrado (χ2), aplicado àqueles nutrientes diagnosticados como limitantes primários por deficiência. Os métodos foram comparados, baseando-se na freqüência de diagnoses concordantes (DCF) do potencial de resposta à adubação (FRP), mediante os seguintes critérios: considerando-se os nutrientes separadamente; desde todos (5) nutrientes até nenhum (0); e apenas o limitante primário por deficiência e por excesso. O nível de concordância entre as diagnoses, fornecidas pelos métodos, variou de acordo com o procedimento adotado em sua avaliação e com o grau de concentração de nutrientes nas árvores.
Palavras-chave: Eucalyptus grandis, análise foliar, diagnose foliar, nutrição mineral
INTRODUCTION
The use of the critical level for the evaluation of crops or forests nutritional status is questionable, since it does not define whether the deficiency is acute or not, nor if the nutrient is the most limiting when more than one nutrient is classified as deficient (Baldock & Schulte, 1996). Furthermore, nutrient tissue contents are influ-enced by dilution or concentration effects caused by
variations in the dry matter yield quantity (Jarrel & Beverly, 1981).
stand out among the bivariate diagnosis methods; the Compositional Nutrient Diagnosis (CND) stand out as multivariate method.
The DRIS method, proposed by Beaufils (1973), is based on the comparison of dual relationships (N/P, P/ K, K/Ca, Ca/Mg, etc.) in samples with standard or norms values. The M-DRIS method (Hallmark et al., 1987) also considers nutrient contents, and not only their dual rela-tionships. On the other hand, the CND method (Parent & Dafir, 1992), relies on studies developed by Aitchison (1982), which involve statistical composition data analy-sis, based on the establishment of multinutrient variables (z), weighed by the geometric mean of the nutritional composition.
Consistency of interpretation of plant tissue analysis increases according to the extent by which the univariate approach (of the critical level) is amplified, so that two-by-two relationships (dual relations) between nutrients are observed, (bivariate approach). Progres-sively, ternary relations are included, until ideally, through multivariate focus, the entire variation structure of the nutritional composition is embraced (Holland, 1966).
The most outstanding studies among the many that use DRIS diagnosis methods are eucalypt Wadt (1996) and Wadt et al. (1998a), for eucalyptus; Hartz et al. (1998) for tomato, and Reis Jr. & Monnerat (1998) for sugarcane; for M-DRIS, Hallmark et al. (1989; 1990) for soybeans, (Creste et al., 2001) for maize; and for CND, Parent et al. (1994); and Khiari et al. (2001) and for po-tato, and (Raghupathi & Bhargava, 1999) for grape. A comparison of the nutritional diagnosis methods, with well-differentiated characteristics of index calculation and interpretations, is fundamental to identify differences be-tween results yielded by each method, allowing an en-hanced diagnosis of the nutritional state. The present study compares the use of the methods DRIS, M-DRIS, and CND in eucalypt forests, at sites in the Central-East-ern region of Minas Gerais State, Brazil.
MATERIAL AND METHODS
Data of productivity and N, P, K, Ca, and Mg con-tents in Eucalyptus grandis leaves were used. The trees,
aging 72 to 153 months, were planted in 3 × 2 m
spac-ing at six sites: Cocais, Piracicaba, Rio Doce, Sabinópolis, Santa Bárbara, and Virginópolis, in the Central-Eastern region of Minas Gerais State, in 993 stands. Sites’ geo-graphic location and altitude are represented in Table 1.
Data were stratified according to their sites: Cocais n = 191, Piracicaba n = 201, Rio Doce n = 54, Sabinópolis n = 198, Santa Bárbara n = 180, and Virginópolis n = 169 stands. The stand population was stratified according to age, in 12-month intervals, counted from the youngest age on. For each age class, mean and standard deviation of the mean annual stem volume
in-crease (IMA) were calculated, and the population classi-fied in stands of low and high productivity. The latter was defined as population of reference (> µ + 0.5 SD).
Diagnosis of the nutritional status were made by the methods DRIS (Beaufils, 1973) and M-DRIS (Hall-mark et al., 1987), where all relationships (direct and in-verse forms) were taken into consideration. The diagno-sis was also made by the Compositional Nutrient Diag-nosis (CND) method, according to Parent & Dafir (1992). The norms, site-specific and regarding the refer-ence population, consisted in: mean and standard devia-tion of all dual reladevia-tions between the studied nutrients for the DRIS; mean and standard deviation of the N, P, K, Ca, and Mg contents and of all dual relations for the M-DRIS; mean and standard deviation of the multinutrient variables zN, zP, zK, zCa, and zMg; and g(x) (Parent & Dafir, 1992) for the method CND, calculated as:
g(x) = (N x P x K x Ca x Mg x R) (1/D) e z
i = ln [(xi / g(x)]
where g(x) = geometric mean of the nutritional compo-sition; N, P, K, Ca, and Mg = respective nutrients con-tents (g kg-1); R = value of the complement to 100 g kg-1
of dry matter in relation to the sum of N, P, K, Ca, and Mg; D = number of diagnosed nutrients, including the complement (R); zi = multinutrient variable; and xi = nu-trient content for which the multinunu-trient variable is cal-culated.
For the calculation of the DRIS and M-DRIS functions, Jones’ equation (1981) was used as follows:
f(A/B) = 10 [(A/B) – (a/b)] / s
where 10 = sensitivity coefficient (Black, 1993); A/B = dual relation between the “A” and “B” nutrient concen-trations (g kg-1) of the diagnosed subpopulation; a/b =
dual relation between the “a” and “b” nutrient concen-trations (g kg-1) of the reference subpopulation; and s =
standard deviation of the dual relation of the reference subpopulation. Founded on the values of all DRIS func-tions, the DRIS index for each nutrient was calculated as follows:
IA = f= [ f(A/B) - f(B/A) + f(A/C) - f(C/A) + ... - f(N/ A)] / n
where IA = DRIS index of the nutrient; = mean of the
e t i
S Latitude Longitude Altitude(m)
s i a c o
C 19o23' 40.99'' 42o47' 11.13'' 950
a b a c i c a r i
P 19o39' 01.94'' 43o01' 07.23'' 880
e c o D o i
R 19o09' 33.54'' 42o25' 06.86'' 480
s i l o p ó n i b a
S 18o41' 09.19'' 42o56' 56.09'' 880
a r a b r á B a t n a
S 20o00'28.72'' 43o21' 50.12'' 820
s i l o p ó n i g r i
V 18o40' 03.23'' 42o30' 07.92'' 860
DRIS functions; f(A/B) and f(B/A) = DRIS functions in the direct and inverse forms, respectively; and n = num-ber of DRIS functions (f). Subsequently, the mean nutri-tional balance index (IENm) (Wadt et al., 1998b) for the different sites was obtained by summing up the nutrient indices in a module and by dividing this value by the number of analyzed nutrients.
To calculate the M-DRIS functions and indices, and the dual relations, the nutrient contents were taken into account. In analogy to the establishment of the DRIS indices by means of the nutrient content functions in-volved in the diagnosis, the M-DRIS dry matter index was obtained too. The following equation allowed the calcu-lation of the Izi indices for the CND method:
Izi = (Zi – zi) / szi,
where Izi = index of the multinutrient variables; Zi = multinutrient variable of the diagnosed sample; zi = mean of the multinutrient variable in the reference subpopula-tion; and szi =standard deviation of the multinutrient vari-able in the reference subpopulation. As for the IENm (Wadt et al., 1998b) calculated for the DRIS, this index was computed for the CND at the different sites. For the DRIS and M-DRIS methods, the function and index cal-culations were performed with routines developed in Ex-cel 5.0; zN through zMg as well as the CND nutrient in-dices were also established with Excel 5.0.
The nutritional status diagnosis made by the three methods was statistically validated by the chi-square test (α = 0.10) based on the counted frequency of the
num-ber of times each nutrient appeared as primary limiting by deficiency. As zero hypothesis (H0) was considered the one where this frequency was random-attributed, suggest-ing that the observed and expected frequencies did not differ from each other; the alternative hypothesis (H1) in-dicates that there are differences between the observed and the expected nutrient frequencies. For each method, the expected frequency was equal to the total number of observations at each site divided by the total number of
analyzed nutrients.
The concept of the fertilization response poten-tial (FRP) (Wadt et al., 1998b) was adopted to interpret the DRIS and CND indices (Table 2), and the M-DRIS index (Table 3). The nutrients of the low-productivity stands at each site were therefore classified according to the fertilization response potential: positive (p), positive or zero (pz), zero (z), negative or zero (nz), and negative (n). For easier interpretation of the M-DRIS indices, the adjusted M-DRIS index - the difference between the in-dex of a certain nutrient and of the dry matter - was cal-culated.
The DRIS, M-DRIS, and CND methods were compared, based on the diagnosis concordance frequency (DCF) derived from the fertilization response potential (FRP), focusing on the following situations: separate nu-trients; from all (5) down to none (0); and only for the primary limiting deficient nutrient (p) and excessive nu-trient (n). Moreover, low-productivity subpopulation stands were selected at Virginópolis with different nutri-ent concnutri-entration degrees in the trees, considering the IMS (M-DRIS) and G(X) (CND) values, in order to verify the behavior of these methods regarding the diagnose in-terpretation.
RESULTS AND DISCUSSION
High productivity stands presented a mean fre-quency of 30.61% and low variation among the sites (from 27.8% in Virginópolis to 33.3% in Rio Doce) (Table 4), reflecting the statistical criterion used to separate high and low-productivity subpopulations. The percentage in-creases of stem productivity in the high-productivity stands in relation to the low-productivity ones were the following: Cocais 79.7, Piracicaba 81.9, Rio Doce 51.3, Sabinópolis 73.6, Santa Bárbara 78.2, Virginópolis 52.3, and 70.9 for the all sites. Except for Rio Doce, productivities of the reference population, although not
Table 2 - Interpretation of the DRIS and CND indices of the nutritional diagnosis in eucalypt plantations in function of the fertilization response potential (FRP).
IENm = mean nutritional balance index; + LF = most limiting deficient nutrient; + LE = most limiting nutrient in excess; positive (p); positive or zero (pz); negative (n); negative or zero (nz) and zero (z).
e c i d n
I Moduleofindice +LFor +LE FRP
0
< >IENm yes p
0
< >IENm no pz
0
> >IENm yes n
0
> >IENm no nz
≤0 ≤ IENm independent z ≥0 ≤ IENm independent z
Table 3 - Interpretation of the M-DRIS indices of the nutritional diagnosis in eucalypt plantations in function of the fertilization response potential (FRP).
Adjusted M-DRIS index = nutrient index – dry matter index; IENm = mean nutritional balance index; + LF = most limiting deficient nutrient; + LE = most limiting nutrient in excess; positive (p); positive or zero (pz); negative (n); negative or zero (nz), and zero (z).
S I R D -M e c i d n I
d e t s u j d A
e c i d n i f o e l u d o M
S I R D
-M +LFor +LE FRP
0
< >IENm yes p
0
< >IENm no pz
0
> >IENm yes n
0
> >IENm no nz
0
≤ ≤ΙΕΝm independent z 0
clonal, presented quite satisfactory values (Table 4). Al-though the studied eucalypt populations aged between 72 and 153 months, stratification according to age class cer-tainly contributed to equalize possible age effect, even though small, in the referred age group.
The norms determined for the DRIS, M-DRIS, and CND methods at the different sites are displayed in Table 5. Note the values of the dual relations and the multinutrient variables differed, in most situations, be-tween high and low-productivity subpopulations, based on the variance ratio or, much more frequently, in rela-tion to the means.
The validation of the diagnosis (norms) is tradi-tionally carried out by factorial schemes, based on fer-tilization experiments (Caldwell et al., 1994; Payne et al., 1990; Elwali & Gascho, 1984; Bailey et al., 1997). Be-cause of the lengthy time required to determine results, this kind of validation is more complicated for a crop like eucalypt. In this case, an alternative to validate results is to determine whether the frequencies of the most limit-ing nutrients (response p) are randomized or not.
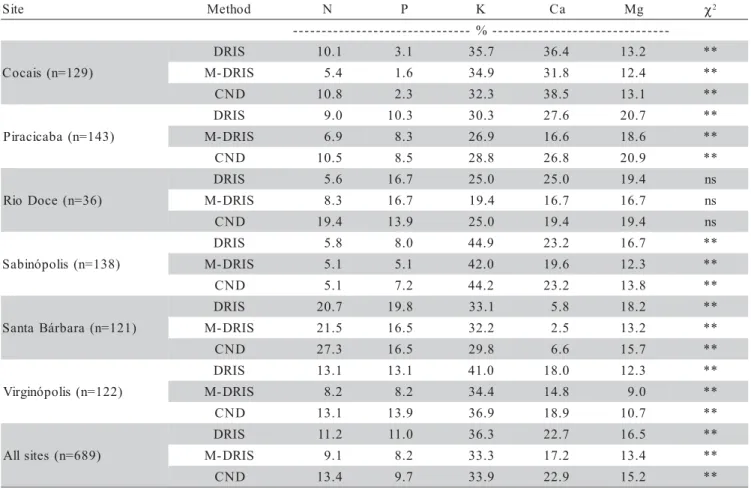
In this study, corresponding to the one used by Wadt et al. (1998a), the test of hypothesis was carried out by the chi-square test applied to the counted frequency in which each nutrient appeared as primary limiting by deficiency (response p) at the different sites by the DRIS, M-DRIS, and CND methods. With exception of the Rio Doce site, the referred frequency cannot be attributed to coincidence, in other words, the indices obtained by these methods are viable to evaluate the nutritional status of eucalypt trees (Table 6).
A comparison among the DRIS, M-DRIS, and CND methods was performed by means of specific norms, based on the frequency of concordant diagnoses (DCF) derived from the fertilization response potential (FRP), where three different criteria were taken into con-sideration. The first criterion considered the nutrients N, P, K, Ca, and Mg separately in the DCF evaluation of the FRP, and mean values of 65.0% (DRIS vs M-DRIS),
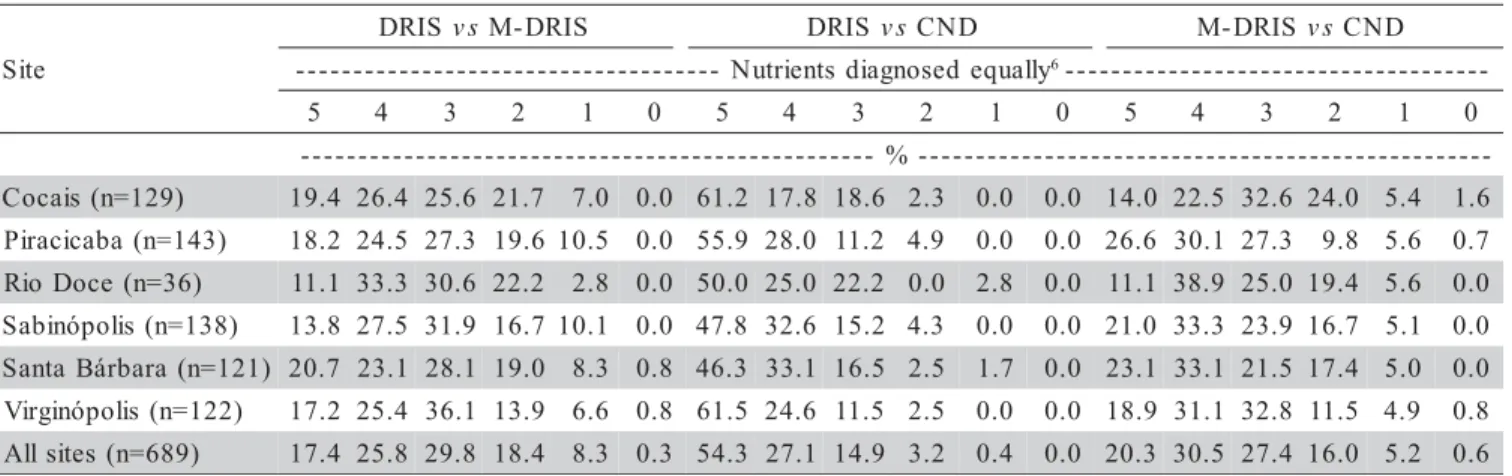
86.3% (DRIS vs CND), and 68.6% (M-DRIS vs CND) were established for all sites (Table 7). However, for the second criterion, the DCF of the FRP for all sites, consid-ering all (5) nutrients, had means of 17.4% (DRIS vs M-DRIS), 54.3% (DRIS vs CND), and 20.3% (M-DRIS vs CND) (Table 8), meaning that, 82.6%, 45.7%, and 79.7% of the stands were diagnosed differently in at least one nu-trient, respectively. This kind of comparison expresses the highest level of similarity among the methods.
A third criterion of evaluation was introduced, in a less rigorous but more adequate comparison from a practical point of view. The DCF of the FRP for the pri-mary limiting by deficiency (p), considering all sites, was 77.8% (DRIS vs M-DRIS), 90.4% (DRIS vs CND), and
79.0% (M-DRIS vs CND) (Table 9), whereas the primary
limiting by excess (n) was 42.7%, 85.6%, and 43.9%, re-spectively.
As observed for the response “n”, the concordance is smaller when M-DRIS takes part in the comparisons. This results from the fact that, in average, the stands present nutrient dilution, evidenced by the positive dry matter in-dex values (IMS), relative to the DRIS, M-DRIS, and CND index analysis (Silva, 2001). Therefore, the concordance among the methods may vary according to the nutrient di-lution (or concentration) degree in the tree according to the diagnosis method. Finally, the M-DRIS (by the IMS) and the CND (by the G(X)) provide information on the referred degree. These methods differ, however, in the aspect that M-DRIS uses the IMS as primary reference, while the G(X), in the CND, does not establish any reference for the diagnosis, at least in the way it has been used in the present study. It is therefore fair to suggest that M-DRIS is sensi-tive to the effects of dilution or concentration, a fact that calls for further comment.
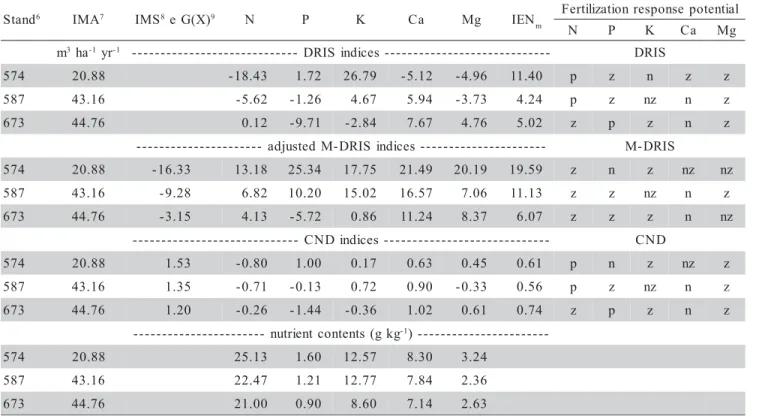
Selected stands of the low-productivity subpopu-lation of the Virginópolis site with, different nutrient con-centration degrees in the trees (Table 10) where thus in-vestigated, as indicated by the values of IMS (M-DRIS) and of G(X) (CND). The M-DRIS did not detect any
limi-Table 4 - Productivity, number, and mean age of Eucalyptus grandis stands in the Central-Eastern region of Minas Gerais.
sd = standard deviation; n = number of stands per area.
e t i S
n o i t a l u p o p b u S
y t i v i t c u d o r p -w o
L High-productivity
n a e
M sd n Age Mean sd n Age
m3ha-1yr-1 month m3ha-1yr-1 month
s i a c o
C 23.2 8.4 129 111 41.7 5.1 62 112
a b a c i c a r i
P 23.8 7.3 143 99 43.3 10.4 58 93
e c o D o i
R 19.1 4.6 36 101 28.9 2.7 18 102
s i l o p ó n i b a
S 26.9 10.4 138 127 46.7 8.1 60 131
a r a b r á B a t n a
S 24.8 8.6 121 99 44.2 7.1 59 98
s i l o p ó n i g r i
V 32.9 10.5 122 117 50.1 10.2 47 117
s e t i s l l
tation by deficiency, represented by the positive response (p) or positive or zero (pz) of the fertilization response potential. The DRIS and the CND, on the other hand, pre-sented similar performance at detecting these responses. The observation of stands where expressive nutrient con-centrations (for example, IMS < -15 or G(X) > 1.5) are found, despite the low productivity, indicates that the
cause of the low productivity probably lies in problems other than nutritional. On the other hand, in less concen-trated stands (for example, IMS = -3.15 or G(X) = 1.196) where not all nutrient contents are greater than the mean values of the respective nutrients of the Virginópolis site (Table 5), M-DRIS did not detect any response, neither “p” nor “pz”, either, whereas the DRIS and the CND gen-Table 5 - Mean (Y
_
) and standard deviation (s) (norms) of the N, P, K, Ca, and Mg leaf contents, of their dual relations, and the CND1 variables in Eucalyptus grandis, subpopulation of high productivity2, at sites in the Central-Eastern region of
Minas Gerais.
e l b a i r a
V Cocais(n
4=62) Piracicaba(n=58) Rio Doce(n=18) Sabinópolis(n=60) SantaBárbara(n=59) Virginópolis(n=47)
s s s s s s
g k g
-- -1--------------------------------------------------------------
-S M /
N 3 18.370 0.191 19.990 0.222 18.560 0.189 20.320 0.242 20.410 0.190 20.080 0.246
S M /
P 0.930 0.018 1.070 0.019 1.130 0.019 1.110 0.019 1.090 0.022 1.020 0.021 S
M /
K 9.540 0.313 9.260 0.168 9.760 0.213 9.710 0.251 9.670 0.245 9.210 0.421 S
M / a
C 4.360 0.150 5.000 0.170 4.980 0.166 5.010 0.149 4.850 0.181 5.360 0.169 S
M / g
M 2.110 0.049 2.110 0.058 2.070 0.055 1.940 0.068 1.950 0.058 2.180 0.071
N / S
M 0.550 0.058 0.506 0.056 0.544 0.053 0.499 0.060 0.494 0.044 0.505 0.056 P
/ S
M 11.080 2.010 9.650 1.630 9.070 1.510 9.260 1.490 9.500 1.630 10.140 1.850 K
/ S
M 1.161 0.384 1.118 0.223 1.075 0.250 1.110 0.341 1.094 0.257 1.214 0.372 a
C / S
M 2.566 0.934 2.245 0.799 2.213 0.679 2.194 0.712 2.369 0.972 2.068 0.737
g M / S
M 5.008 1.254 5.110 1.493 5.126 1.229 5.689 1.725 5.680 1.964 5.049 1.608 P
/
N 20.080 2.620 19.060 2.480 16.690 2.250 18.600 2.320 19.180 2.540 20.030 2.620 K
/
N 2.116 0.662 2.223 0.440 1.974 0.392 2.229 0.642 2.211 0.466 2.406 0.713
a C /
N 4.722 1.832 4.524 1.809 4.061 1.198 4.526 1.765 4.873 2.200 4.138 1.527 g
M /
N 9.149 2.292 10.232 3.333 9.358 1.777 11.466 3.440 11.618 4.274 10.112 3.447 N
/
P 0.051 0.007 0.053 0.008 0.061 0.009 0.055 0.007 0.053 0.007 0.051 0.007 K
/
P 0.106 0.033 0.117 0.022 0.119 0.021 0.121 0.036 0.116 0.025 0.121 0.036
a C /
P 0.241 0.106 0.240 0.100 0.248 0.083 0.248 0.108 0.261 0.129 0.210 0.083 g
M /
P 0.462 0.120 0.542 0.182 0.568 0.126 0.628 0.223 0.618 0.244 0.506 0.167 N
/
K 0.523 0.185 0.467 0.089 0.526 0.106 0.479 0.119 0.473 0.102 0.455 0.156 P
/
K 10.430 3.730 8.810 1.600 8.660 1.530 8.870 2.300 8.970 1.750 8.970 2.700
a C /
K 2.331 0.839 2.082 0.900 2.094 0.618 2.140 0.987 2.341 1.342 1.833 0.880 g
M /
K 4.837 2.344 4.680 1.537 4.841 1.060 5.444 1.968 5.521 2.602 4.607 2.406 N
/ a
C 0.241 0.092 0.255 0.100 0.267 0.078 0.253 0.091 0.241 0.097 0.269 0.087 P
/ a
C 4.841 1.936 4.830 1.855 4.460 1.464 4.717 1.791 4.647 2.001 5.394 1.899
K / a
C 0.482 0.164 0.556 0.204 0.516 0.141 0.552 0.209 0.532 0.221 0.626 0.210 g
M / a
C 2.165 0.983 2.417 0.720 2.406 0.512 2.796 1.137 2.603 1.010 2.604 0.875 N
/ g
M 0.116 0.027 0.107 0.031 0.111 0.022 0.096 0.032 0.096 0.031 0.109 0.034
P / g
M 2.313 0.591 2.018 0.566 1.834 0.362 1.781 0.612 1.858 0.677 2.153 0.576 K
/ g
M 0.245 0.091 0.232 0.064 0.214 0.039 0.212 0.087 0.213 0.082 0.263 0.118 a
C / g
M 0.535 0.216 0.448 0.123 0.432 0.083 0.413 0.151 0.435 0.152 0.435 0.172 )
N (
z 0.564 0.119 0.600 0.143 0.516 0.101 0.609 0.125 0.625 0.120 0.596 0.125
) P (
z -2.430 0.153 -2.339 0.156 -2.290 0.129 -2.307 0.159 -2.320 0.167 -2.393 0.135 )
K (
z -0.135 0.252 -0.198 0.166 -0.146 0.137 -0.159 0.221 -0.146 0.213 -0.240 0.250 )
a C (
z -0.916 0.266 -0.853 0.277 -0.845 0.221 -0.831 0.281 -0.875 0.312 -0.768 0.248 )
g M (
z -1.619 0.212 -1.690 0.198 -1.704 0.126 -1.785 0.247 -1.768 0.255 -1.666 0.248
) x (
g 5 1.041 0.120 1.120 0.127 1.115 0.164 1.105 0.121 1.094 0.126 1.111 0.167
Y
_
Y _
Y
_
Y
_
Y
_
Y _
erally identified some nutritional limitation by deficiency. Thus, the DRIS and the CND, in the suggested situation, would recommend fertilization, but that would not hap-pen if the diagnosis were made by the M-DRIS. There-fore, if the limitations of these stands were really of non-nutritional nature, the use of the M-DRIS non-nutritional
di-e t i
S Method N P K Ca Mg χ2
-% -) 9 2 1 = n ( s i a c o C S I R
D 10.1 3.1 35.7 36.4 13.2 **
S I R D
-M 5.4 1.6 34.9 31.8 12.4 **
D N
C 10.8 2.3 32.3 38.5 13.1 **
) 3 4 1 = n ( a b a c i c a r i P S I R
D 9.0 10.3 30.3 27.6 20.7 **
S I R D
-M 6.9 8.3 26.9 16.6 18.6 **
D N
C 10.5 8.5 28.8 26.8 20.9 **
) 6 3 = n ( e c o D o i R S I R
D 5.6 16.7 25.0 25.0 19.4 ns
S I R D
-M 8.3 16.7 19.4 16.7 16.7 ns
D N
C 19.4 13.9 25.0 19.4 19.4 ns
) 8 3 1 = n ( s i l o p ó n i b a S S I R
D 5.8 8.0 44.9 23.2 16.7 **
S I R D
-M 5.1 5.1 42.0 19.6 12.3 **
D N
C 5.1 7.2 44.2 23.2 13.8 **
) 1 2 1 = n ( a r a b r á B a t n a S S I R
D 20.7 19.8 33.1 5.8 18.2 **
S I R D
-M 21.5 16.5 32.2 2.5 13.2 **
D N
C 27.3 16.5 29.8 6.6 15.7 **
) 2 2 1 = n ( s i l o p ó n i g r i V S I R
D 13.1 13.1 41.0 18.0 12.3 **
S I R D
-M 8.2 8.2 34.4 14.8 9.0 **
D N
C 13.1 13.9 36.9 18.9 10.7 **
) 9 8 6 = n ( s e t i s l l A S I R
D 11.2 11.0 36.3 22.7 16.5 **
S I R D
-M 9.1 8.2 33.3 17.2 13.4 **
D N
C 13.4 9.7 33.9 22.9 15.2 **
Table 6 - Chi-square test (χ2) of the frequency of stands considered primary limiting by N, P, K, Ca, and Mg deficiency, in
leaves of the aerial part of Eucalyptus grandis, subpopulation of low productivity1, using DRIS2, M-DRIS3, and
CND4, by means of specific norms for each site, in the Central-Eastern region of the State of Minas Gerais.
1/ ≤ than mean + 0.5 standard deviation; 2/ Beaufils (1973), using the IEN
m proposed by Wadt et al. (1998b); 3/ Hallmark et al. (1987); 4/ Parent & Dafir (1992); ns e **: not significant and (P < 0.01) by the chi-square test (zero hypothesis: frequency due to coincidence).
agnosis would appear more appropriate. However, if the low productivity were a consequence of nutritional prob-lems as well, the application of the nutritional diagnosis through the DRIS or CND could help boost the produc-tivity, if the non-nutritional problems were also solved. The productivity can be limited by macronutrients (S) and
e t i
S DRIS
s
v M-DRIS DRIS vs CND M-DRIS vs CND
N P K Ca Mg 6 N P K Ca Mg N P K Ca Mg
-% -) 9 2 1 = n ( s i a c o
C 51.2 58.1 73.6 78.3 68.2 65.9 79.8 81.4 91.5 95.3 89.9 87.6 41.9 55.8 66.7 75.2 71.3 62.2
) 3 4 1 = n ( a b a c i c a r i
P 51.7 65.7 69.2 63.6 69.9 64.1 81.8 83.2 88.1 90.2 91.6 87.0 65.7 74.1 72.7 72.0 75.5 72.0
) 6 3 = n ( e c o D o i
R 63.9 63.9 75.0 61.1 63.9 65.6 72.2 83.3 91.7 86.1 86.1 83.9 69.4 55.6 75.0 63.9 66.7 66.1
) 8 3 1 = n ( s i l o p ó n i b a
S 53.6 61.6 73.2 61.6 68.1 63.6 72.5 84.1 90.6 84.1 92.8 84.8 59.4 71.0 79.0 67.4 71.7 69.7
) 1 2 1 = n ( a r a b r á B a t n a
S 55.4 65.3 70.2 69.4 66.1 65.3 68.6 83.5 89.3 89.3 89.3 84.0 62.8 72.7 71.1 72.7 72.7 70.4
) 2 2 1 = n ( s i l o p ó n i g r i
V 63.1 60.7 73.8 69.7 63.1 66.1 86.1 89.3 89.3 89.3 91.0 89.0 63.1 63.9 77.0 73.8 67.2 69.0
) 9 8 6 = n ( s e t i s l l
A 55.3 62.4 72.1 67.9 67.1 65.0 77.5 84.2 89.8 89.4 90.7 86.3 59.2 67.1 73.4 71.7 71.6 68.6
Table 7 - Frequency of stands with concordant diagnoses of the fertilization response potential1 for N, P, K, Ca, and Mg in
Eucalyptus grandis, subpopulation of low productivity2, in the Central-Eastern region of Minas Gerais, among the
methods DRIS3, M-DRIS4, and CND5 by means of specific norms for each site, applied to the leaves.
1/ Wadt et al. (1998b); 2/ ≤ than mean plus 0.5 standard deviation; 3/ Beaufils (1973), using the IEN
m proposed by Wadt et al. (1998b); 4/ Hallmark et al. (1987), using the equation functions of Jones (1981) for the calculation; 5/ Parent & Dafir (1992); 6/ nutrient mean.
e t i S S I R
D vsM-DRIS DRISvsCND M-DRISvsCND
y l l a u q e d e s o n g a i d s t n e i r t u N
-- 6------------------------------------
-5 4 3 2 1 0 5 4 3 2 1 0 5 4 3 2 1 0
-% -) 9 2 1 = n ( s i a c o
C 19.4 26.4 25.6 21.7 7.0 0.0 61.2 17.8 18.6 2.3 0.0 0.0 14.0 22.5 32.6 24.0 5.4 1.6
) 3 4 1 = n ( a b a c i c a r i
P 18.2 24.5 27.3 19.6 10.5 0.0 55.9 28.0 11.2 4.9 0.0 0.0 26.6 30.1 27.3 9.8 5.6 0.7
) 6 3 = n ( e c o D o i
R 11.1 33.3 30.6 22.2 2.8 0.0 50.0 25.0 22.2 0.0 2.8 0.0 11.1 38.9 25.0 19.4 5.6 0.0
) 8 3 1 = n ( s i l o p ó n i b a
S 13.8 27.5 31.9 16.7 10.1 0.0 47.8 32.6 15.2 4.3 0.0 0.0 21.0 33.3 23.9 16.7 5.1 0.0
) 1 2 1 = n ( a r a b r á B a t n a
S 20.7 23.1 28.1 19.0 8.3 0.8 46.3 33.1 16.5 2.5 1.7 0.0 23.1 33.1 21.5 17.4 5.0 0.0
) 2 2 1 = n ( s i l o p ó n i g r i
V 17.2 25.4 36.1 13.9 6.6 0.8 61.5 24.6 11.5 2.5 0.0 0.0 18.9 31.1 32.8 11.5 4.9 0.8
) 9 8 6 = n ( s e t i s l l
A 17.4 25.8 29.8 18.4 8.3 0.3 54.3 27.1 14.9 3.2 0.4 0.0 20.3 30.5 27.4 16.0 5.2 0.6
Table 8 - Frequency of stands with concordant diagnoses of the fertilization response potential1 for the nutrients considered
together according to the situations (5, 4, 3, 2, 1, and 0), in Eucalyptus grandis, subpopulation of low productivity2,
in the Central-Eastern region of Minas Gerais, among the methods DRIS3, M-DRIS4, and CND5 by means of
specific norms for each site, applied to the leaves.
1/ Wadt et al. (1998b); 2/≤ than mean + 0.5 standard deviation; 3/ Beaufils (1973), using the IEN
m proposed by Wadt et al. (1998b); 4/ Hallmark et al. (1987), using the equation functions of Jones (1981) for the calculation; 5/ Parent & Dafir (1992); 6/ nutrients diagnosed equally, considering either all (5), or only 4, 3, 2, 1, or none (0).
by micronutrients, for which the respective norms have not been calculated.
Depending on the chosen form of comparison and the nutrient concentration degree in the trees, very dif-ferent results can be obtained in relation to the concor-dance of the methods. The M-DRIS was more sensitive to identify stands with non-nutritional problems,
com-pared to the other methods. In stands with lower nutrient contents and some nutrient concentrations below those of the reference population, the M-DRIS does not detect this limitation, in spite of its nutritional character. In such cases, using diagnosis methods might be more adequate, even though they have lower sensitivity to identify non-nutritional problems.
e t i
S Method p n
-% -) 9 2 1 = n ( s i a c o C S I R
D vsM-DRIS 83.7 38.3
S I R
D vs CND 96.1 83.2
S I R D
-M vsCND 80.6 36.3
) 3 4 1 = n ( a b a c i c a r i P S I R
D vsM-DRIS 75.4 48.9
S I R
D vs CND 91.6 86.4
S I R D
-M vsCND 78.1 51.2
) 6 3 = n ( e c o D o i R S I R
D vsM-DRIS 74.3 60.0
S I R
D vs CND 77.1 82.9
S I R D
-M vsCND 63.9 57.6
) 8 3 1 = n ( s i l o p ó n i b a S S I R
D vsM-DRIS 78.3 35.6
S I R
D vs CND 89.1 85.2
S I R D
-M vsCND 85.6 38.4
) 1 2 1 = n ( a r a b r á B a t n a S S I R
D vsM-DRIS 79.0 40.2
S I R
D vs CND 85.7 82.5
S I R D
-M vsCND 81.9 41.9
) 2 2 1 = n ( s i l o p ó n i g r i V S I R
D vsM-DRIS 73.6 45.7
S I R
D vs CND 93.3 91.5
S I R D
-M vsCND 72.6 47.4
) 9 8 6 = n ( s e t i s l l A S I R
D vsM-DRIS 77.8 42.7
S I R
D vs CND 90.4 85.6
S I R D
-M vsCND 79.0 43.9
Table 9 - Frequency of stands with concordant diagnoses of the fertilization response potential1 (p and n) in Eucalyptus
grandis, subpopulation of low productivity2 in the Central-Eastern region of Minas Gerais, among the methods
DRIS3, M-DRIS4, and CND5, by means of specific norms for each site, applied to the leaves.
1/ Wadt et al. (1998b); 2/≤ than mean + 0.5 standard deviation; 3/ Beaufils (1973), considering the IEN
REFERENCES
AITCHISON, J. The statistical analysis of compositional data. Journal of the Royal Statistical Society. Series B, v.44, p.139-177, 1982. BAILEY, J.S.; BEATTIE, J.A.M.; KILPATRICK D.J. The diagnosis and
recommendation integrated system (DRIS) for diagnosing the nutrient status of grassland swards: I. Model establishment.Plant and Soil, v.197, p.127-135, 1997.
BALDOCK, J.O.; SCHULTE, E.E. Plant analysis with standardized scores combines DRIS and sufficiency range approaches for corn. Agronomy Journal, v.88, p.448-456, 1996.
BEAUFILS, E.R. Diagnosis and recommendation integrated system (DRIS). Pietermaritizburg: University of Natal, 1973. 132p. (Soil Science Bulletin, 1).
BLACK, C.A. Soil fertility evaluation and control. Londow. Lewis Publisher, 1993. 746p.
CALDWELL, J.O.N.; SUMNER, M.E.; VAVRINA, C.S. Development and testing of preliminary foliar DRIS norms for onions. Hortscience, v.29, p.1501-1504, 1994.
CRESTE, E.J.; TIRITAN, C.S.; LEBEDENCO, A. Avaliação nutricional de diferentes genótipos de milho através do DRIS. In: CONGRESSO BRASILEIRO DE CIÊNCIA DO SOLO, 28., Londrina, 2001. Resumo. Londrina: SBCS, 2001. p.159.
ELWALI, A.M.O.; GASCHO, G.J. Soil testing, foliar analysis, and DRIS as guide for sugarcane fertilization. Agronomy Journal, v.76, p.466-470, 1984.
HALLMARK, W.B.; WALWORTH, J.L.; SUMNER, M.E.; de MOOY, C.J.; PESEK, J.; SHAO, K.P. Separating limiting and non-limiting nutrients. Journal of Plant Nutrition, v.10, p.1381-1390, 1987.
HALLMARK, W.B.; BEVERLY, R.B.; PARKER, M.B.; ADAMS, J.F.; BOSWELL, F.C.; OHKI, K.; SHUMAM, L.M.; WILSON, D.O. Evaluation of soybean zinc and manganese requirements by the M-DRIS and sufficiency range methods. Agronomy Journal, v.81, p.770-776, 1989.
HALLMARK, W.B.; BEVERLY, R.B.; SUMNER, M.E.; de MOOY, C.J.; MORRIS, H.F.; PESEK, J.; FONTENOT, J.D. Soybean phosphorus and potassium requirement evaluation by three M-DRIS data bases. Agronomy Journal, v.82, p.323-328, 1990.
HARTZ, T.K.; MIYAO, E.M.; VALENCIA, J.G. DRIS evaluation of the nutritional status of processing tomato. Hortscience, v.33, p.830-832, 1998.
HOLLAND, D.A. The interpretation of leaf analysis. Journal of the Horticultural Science & Biotecnology, v.41, p.311-329, 1966. JARREL, W.M.; BEVERLY, R.B. The dilution effect in plant nutrition
studies. Advances in Agronomy, v.34, p.197-224, 1981.
JONES, C.A. Proposed modifications of the Diagnosis and Recommendation Integrated System (DRIS) for interpreting plant analysis. Communications in Soil Science and Plant Analysis, v.22, p.785-794, 1981.
KHIARI, L.; PARENT, L.E.; TREMBLAY, N. The phosphorus compositional nutrient diagnosis range for potato. Agronomy Journal, v.93, p.815-819, 2001.
PARENT, L.E.; CAMBORIUS, A.N.; MUHAWENIMANA, A. Multivariate diagnosis of nutrient imbalance in potato crops. Soil Science Society of America Journal, v.58, p.1432-1438, 1994.
PARENT, L.E.; DAFIR, M. A theoretical concept of compositional nutrient diagnosis. Journal of the American Society for Horticultural Science, v.117, p.239-242, 1992.
Table 10 - Productivity (IMA), indices of primary and mean nutritional balance (IENm), nutrient contents, fertilization response potential1 of N, P, K, Ca, and Mg using the methods DRIS2, M-DRIS3, and CND4, applied to the leaves, in Eucalyptus grandis stands, selected from the low-productivity5 subpopulation from the Virginópolis site, in the Central-Eastern
region of Minas Gerais.
1/ Wadt et al. (1998b); 2/ Beaufils (1973), considering the IEN
m proposed by por Wadt et al. (1998b); 3/ Hallmark et al. (1987), using the equation of Jones (1981) to calculate the functions; 4/ Parent & Dafir (1992); 5/≤ than mean + 0.5 standard deviation; 6/ Silva (2001); 7/ mean annual increase of the stem volume; 8/ dry matter index, regarding the M-DRIS; 9/ geometric mean of the nutritional composition, regarding the CND.
d n a t
S 6 IMA7 IMS8e G(X)9 N P K Ca Mg IEN
m
l a i t n e t o p e s n o p s e r n o i t a z i l i t r e F
N P K Ca Mg
m3ha-1yr-1 ----------------------------- DRISindices----------------------------- DRIS
4 7
5 20.88 -18.43 1.72 26.79 -5.12 -4.96 11.40 p z n z z
7 8
5 43.16 -5.62 -1.26 4.67 5.94 -3.73 4.24 p z nz n z
3 7
6 44.76 0.12 -9.71 -2.84 7.67 4.76 5.02 z p z n z
-s e c i d n i S I R D -M d e t s u j d a
-- M-DRIS
4 7
5 20.88 -16.33 13.18 25.34 17.75 21.49 20.19 19.59 z n z nz nz
7 8
5 43.16 -9.28 6.82 10.20 15.02 16.57 7.06 11.13 z z nz n z
3 7
6 44.76 -3.15 4.13 -5.72 0.86 11.24 8.37 6.07 z z z n nz
-s e c i d n i D N C
-- CND
4 7
5 20.88 1.53 -0.80 1.00 0.17 0.63 0.45 0.61 p n z nz z
7 8
5 43.16 1.35 -0.71 -0.13 0.72 0.90 -0.33 0.56 p z nz n z
3 7
6 44.76 1.20 -0.26 -1.44 -0.36 1.02 0.61 0.74 z p z n z
g k g ( s t n e t n o c t n e i r t u n
-- -1)----------------------
-4 7
5 20.88 25.13 1.60 12.57 8.30 3.24
7 8
5 43.16 22.47 1.21 12.77 7.84 2.36
3 7
PAYNE, G.G.; RECHCIGL, J.E.; STEPHENSON, R.L. Development of Diagnosis and Recommendation Integrated System norms for Bahiagrass. Agronomy Journal, v.82, p.930-934, 1990.
RAGHUPATHI, H.B.; BHARGAVA, B.S. Diagnosis of nutrient element norms for grape. Journal of Plant Nutrition, v.22, p.219-227, 1999. REIS JR., R.A.; MONNERAT, P.H. Diagnose nutricional da cana-de-açúcar
através do sistema integrado de diagnose e recomendação (DRIS). In: REUNIÃO BRASILEIRA DE FERTILIDADE DO SOLO E NUTRIÇÃO DE PLANTAS, 23., Caxambú, 1998. Resumos. Caxambú, 1998. p.751.
SILVA, G.G.C. Diagnose nutricional do eucalipto pelo DRIS, M-DRIS e CND. Viçosa: UFV, 2001. 132p. (Dissertação - M.S.).
WADT, P.G.S. Os métodos da chance matemática e do Sistema Integrado de Diagnose e Recomendação (DRIS) na avaliação nutricional de plantios de eucalipto. Viçosa: UFV, 1996. 123p. (Tese - Doutorado).
WADT, P.G.S.; NOVAIS, R.F.; ALVAREZ V., V.H.; FONSECA, S.; BARROS, N.F. Valores de referência para macronutrientes em eucalipto obtidos pelos métodos DRIS e chance matemática. Revista Brasileira de Ciência do Solo, v.22, p.685-692, 1998a.
WADT, P.G.S.; NOVAIS, R.F.; ALVAREZ V., V.H.; FONSECA, S.; BARROS, N.F.; DIAS, L.E. Três métodos de cálculo do DRIS para avaliar o potencial de resposta à adubação de árvores de eucalipto. Revista Brasileira de Ciência do Solo, v.22, p.661-666, 1998b.