TESTING AND VALIDATION OF METHODS FOR THE
DIAGNOSIS AND RECOMMENDATION INTEGRATED
SYSTEM FOR SIGNAL GRASS
Cristiane Prezotto Silveira1; Gilmar Ribeiro Nachtigall1,2; Francisco Antonio Monteiro3*
1
USP/ESALQ - Programa de Pós-Graduação em Solos e Nutrição de Plantas. 2
Embrapa Uva e Vinho, C.P. 130 - 95700-000 - Bento Gonçalves, RS - Brasil. 3
USP/ESALQ - Depto. de Solos e Nutrição de Plantas, C.P. 9 - 13418-900 - Piracicaba, SP - Brasil. *Corresponding author <[email protected]>
ABSTRACT: The Diagnosis and Recommendation Integrated System (DRIS) allows the interpretation of results of leaf analysis through relationships among nutrients, instead of the absolute and isolated concentration of each one, as it is used by the criterion of sufficiency range. The objective was to evaluate three procedures of calculation of DRIS indices, and to verify the efficiency of DRIS as interpretation method for the results of
Brachiaria decumbens (Signal grass). The study was developed with the results of six experiments carried out in a greenhouse at Piracicaba, SP, with nutrient solution. Concentrations of N, P, K, Ca, Mg, S, Cu, Fe, Mn, and Zn were used in the samples of recently expanded leaf laminae of the grass. The validation of the DRIS method used results from an experiment with nitrogen and sulfur rates applied to the same grass from the Mundo Novo farm, Brotas, SP. DRIS indices were calculated according to two criteria to choose the ratio order of nutrients (F value and R value) and three ways to calculate the nutrient functions (methods of Beaufils, Jones, and Elwali & Gascho). Nutritional Balance Index (NBI), calculated according to the generated norms, presented negative and significant correlation coefficients with the productivity in the combinations of methods tested and DRIS methods proposed by Beaufils, Jones and Elwali & Gascho were efficient in detecting concentrations that show nutrients deficiency or excess.
Key words: Brachiaria decumbens, DRIS, foliar diagnosis, nutritional balance
CALIBRAÇÃO DO MODELO E VALIDAÇÃO DO SISTEMA
INTEGRADO DE DIAGNOSE E RECOMENDAÇÃO PARA O
CAPIM-BRAQUIÁRIA
RESUMO: O Sistema Integrado de Diagnose e Recomendação (DRIS) permite a interpretação dos resultados de análise foliar, utilizando relações entre nutrientes, ao invés da concentração absoluta e isolada de cada um deles, utilizada pelo critério de faixa de suficiência. Objetivou-se avaliar três procedimentos de cálculo dos índices DRIS, bem como verificar a eficiência do DRIS como método de interpretação de resultados de
análises de folhas da Brachiaria decumbens (capim-Braquiária). O estudo foi desenvolvido com os resultados
de seis experimentos realizados em casa-de-vegetação em Piracicaba, SP, com solução nutritiva. Foram empregadas as concentrações de N, P, K, Ca, Mg, S, Cu, Fe, Mn e Zn nas amostras de lâminas foliares recém-expandidas do capim. Para a validação do método DRIS foram utilizados resultados de um experimento com aplicação de doses de nitrogênio e enxofre realizado com o mesmo capim proveniente da Fazenda Mundo Novo, em Brotas, SP. Os índices DRIS foram calculados por dois critérios para escolha da ordem da razão dos nutrientes (valor F e valor R) e três formas de cálculo das funções dos nutrientes (métodos de Beaufils, Jones e Elwali & Gascho). O Índice de Balanço Nutricional (IBN), calculado a partir das normas geradas, apresentou coeficientes de correlação negativos e significativos com a produtividade nas combinações de métodos testados e os métodos DRIS propostos por Beaufils, Jones e Elwali & Gascho foram eficientes em detectar concentrações que revelam a deficiência ou o excesso dos nutrientes.
Palavras-chave: Brachiaria decumbens, DRIS, diagnose foliar, equilíbrio nutricional
INTRODUCTION
The Diagnosis and Recommendation Integrated System (DRIS) is a method of nutritional diagnosis for crops based on the calculation of an index for each nu-trient. These indices are expressed by positive or nega-tive values, indicating that the nutrient is in excess or in
deficiency in relation to the others, respectively. The closer to zero the indices of all the nutrients, the closer the crop will be to its nutritional balance (Jones, 1981; Beverly, 1991).
of data also strictly selected. The databases to obtain the norms may vary in size according to premises to be adopted in the method, and they have to be uniform with the characteristics of the crop (Letzsch & Sumner, 1984). The population or database chosen for the definition of norms have to be subdivided into two sub-populations or categories: one constituted of normal plants, or reference population, with high productivity; and another, with ab-normal plants, or non-reference population, with smaller productivity than the established one (Beaufils, 1973; Beverly, 1991).
In the calculation of functions of nutrient ratios, three methods have been used: a) the original method of Beaufils (1973); b) the method of Jones (1981); c) the method of Beaufils (1973) modified by Elwali & Gascho (1984). DRIS even provides an addi-tional index, the Nutriaddi-tional Balance Index (NBI), that corresponds to the calculation of the sum of all the DRIS indices irrespective of sign. The larger the value of the sum, the greater will be the indication that the crop is in nutritional imbalance, therefore presenting lower pro-ductivity.
The objective in this paper was to evaluate three procedures for calculating DRIS indices, as well as to verify the efficiency of DRIS as a method for improving the interpretation of analysis results of recently expanded leaf laminae of Signal grass in relation to the method of nutritional diagnosis based on the criterion of sufficiency range.
MATERIAL AND METHODS
This work was accomplished with results of six experiments with the forage grass Brachiaria decumbens, grown in silica with nutrient solution, car-ried out in greenhouse at Piracicaba, SP. The plants of these experiments underwent two growth periods, and the concentrations of nitrogen, phosphorus, potassium, calcium, magnesium, sulfur, iron, manganese, copper, and zinc were determined in the sampled tissue accord-ing to the methodology presented by Sarruge & Haag (1974). For the establishment of DRIS norms for Sig-nal grass, the methodology described by Silveira et al. (2005) was used. Specific norms for the results related to the first and the second growth periods of the plants were also obtained.
Two approaches were assessed to choose the ra-tio order of the nutrients: the one proposed by Nick (1998) - R value - and the other described by Letzsch (1985) and Walworth & Sumner (1987) - F value. DRIS indices for nutrients were calculated using the procedures proposed by Beaufils (1973), Jones (1981) and Elwali & Gascho (1984). The DRIS index IA for the nutrient A was obtained as follows:
n S f (A/Bi) - f (Bj/A) IA = i = 1 j = 1 .
m + n
S
m
Beaufils (1973):
1 - A/B(r) . 100 . k , for A/B(a)< A/B(r) A/B(a) CV%
f (A/B) = 0, for A/B(a)= A/B(r)
A/B(a) - 1 . 100 . k , for A/B(a)> A/B(r) A/B(r) CV%
Jones (1981):
f (A/B) = (A/B(a) - A/B(r)) k / s
Elwali & Gascho (1984):
1 - A/B(r) . 100 . k , A/B(a) CV%
f (A/B) = 0,
A/B(a) - 1 . 100 . k , A/B(r) CV%
for A/B(a)< A/B(r)-s
for A/B > A/B(a) (r)+s
for A/B -(r) s£ A/B(a)£ A/B(r)+s
where: A/B(a) = relation between the concentration of nutrient A and B in the sample; A/B(r) = relation between the concentration of nutrient A and B in the reference population; CV% = variation coefficient for the relation, %; s = standard deviation in the relation; k = constant of sensitivity.
The Nutritional Balance Index (NBI) was cal-culated through the sum of the absolute values of the indices generated for the sample. This index can be use-ful to the indication of the plant nutritional status, with-out hinting their causes. The higher the sum value, the larger the indication of plant nutritional unbalance (Mourão Filho, 2004). The Nutritional Balance Index was obtained for each nutrient of each sample accord-ing to the equation:
NBI = | Index A | + | Index B | + .... + | Index N |
The Average Nutritional Balance Index (NBIa) was calculated through the sum of the absolute values of the indices generated for each nutrient, for each sample, divided by the number of nutrients participating in the calculation, according to the equation:
To evaluate the efficiency of the DRIS method in the nutritional diagnosis of Signal grass, the median concentrations of the nutrients in the laminae of recently expanded leaves obtained in another experiment carried out by Mattos (2001) were used. Such Signal grass pas-ture was established at the Mundo Novo farm, in Brotas-SP, and that study had the combinations of four nitrogen rates (0; 50; 100; and 200 mg dm-3
) with three sulfur rates (0; 30; and 60 mg dm-3), in a complete randomized block design (n = 4).
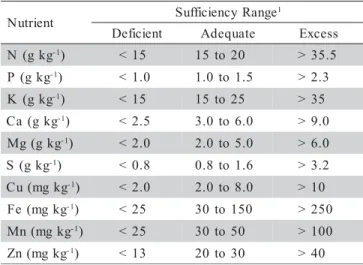
The diagnosis or evaluation of leaf concentra-tion of nutrients for Signal grass was accomplished through the range of nutrients concentration criterion by using arbitrary patterns for the classification of the nu-trients (Table 1), and through DRIS, using the three methods of functions calculations. The consistency of the diagnosis was tested through the comparison among these three diagnosis approaches. For the Range of Nu-trients Concentration Criterion, three classes were used: deficiency, adequate, and excess. For the nutritional di-agnosis using the DRIS method, the methodology pro-posed by Wadt (1996) was used, as well as three classes established from the DRIS Indices of the nutrient (INut.) and the Average Nutritional Balance Index (NBIa), as-suming:
Defficient = INut. < 0 and |INut.| > NBIa
Adequate = |INut.| ≤ NBIa
Excess = INut. > 0 and |INut.| > NBIa
The DRIS indices for the nutrients were calcu-lated using the software Microsoft ExcelTM spreadsheet. To evaluate the efficiency of the three methods used, con-sidering the two approaches to choose the ratio order of the nutrients, NBI was related to the relative dry mass production and verified the significance of the correla-tion coefficient, using the procedure "General Linear Models" (GLM) of the SAS statistical package (SAS In-stitute, 2000).
RESULTS AND DISCUSSION
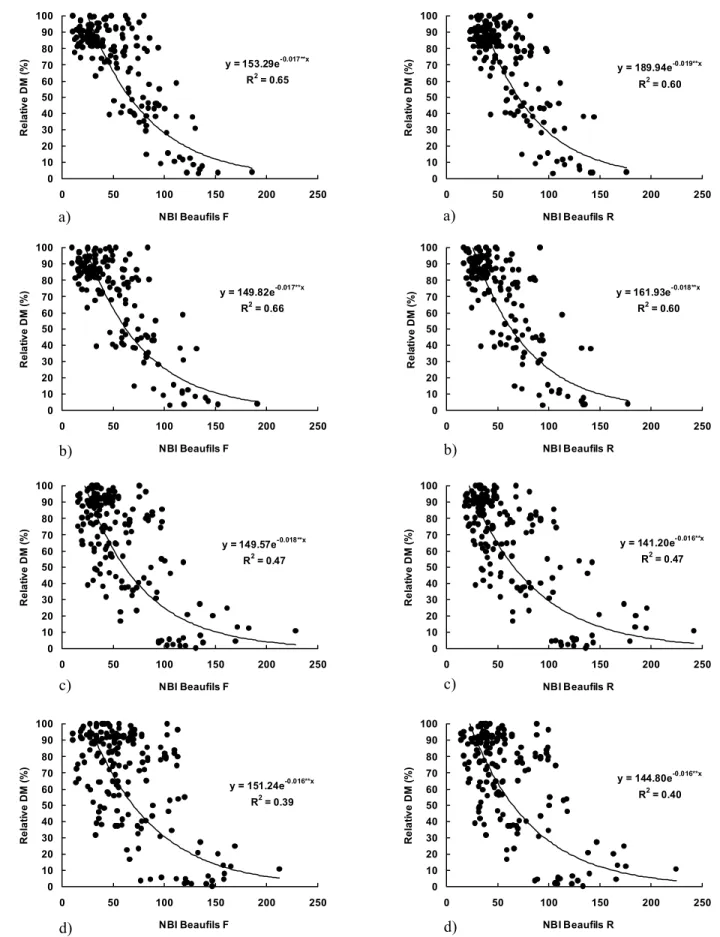
Several authors used the determination coefficient in the relationship between the Nutritional Balance In-dex (NBI) and the productivity to obtain the best method to calculate the DRIS indices (Santos, W., 1997; Mourão Filho & Azevedo, 2003). It is expected that the lower the NBI, the better the nutritional balance and the greater the crop productivity. The relationships between the NBI val-ues and the relative dry mass production of Signal grass and the values obtained from the combinations of choice criteria and ratio order between nutrients and DRIS meth-ods are presented in Figures 1 to 3. This study evaluated the relationships for each grass growth by using either the norm obtained for the growth itself or the general norm with the results of both growths.
Even though the correlation coefficients were sig-nificant in all combinations of methods, the relationships between NBI and the relative dry mass production obtained in the second growth presented lower correlation coeffi-cients than the ones in the first growth, regardless the DRIS norm used. The relationships were coherent with low val-ues of NBI occurring when the productivity varied from low to high, while high NBI values were only associated to low productivity, as stated by Sumner (1977).
The correlation coefficients between the NBI val-ues and productivity of Signal grass, although statistically significant, were low and varied from 0.39 to 0.74. This is probably related to the fact that for the relationship NBI
× productivity, the productivity variation was also depen-dent on other non nutritional factors. Relationships be-tween NBI and productivity with high dispersion of points in studies to generate DRIS norms, originating relatively low R2 values, were also obtained by Wadt et al. (1998) for eucalyptus and Wadt et al. (1999) for coffee. In both cases, it was possible to observe that high values of NBI only occurred in low productivity, as it was also found for Signal grass.
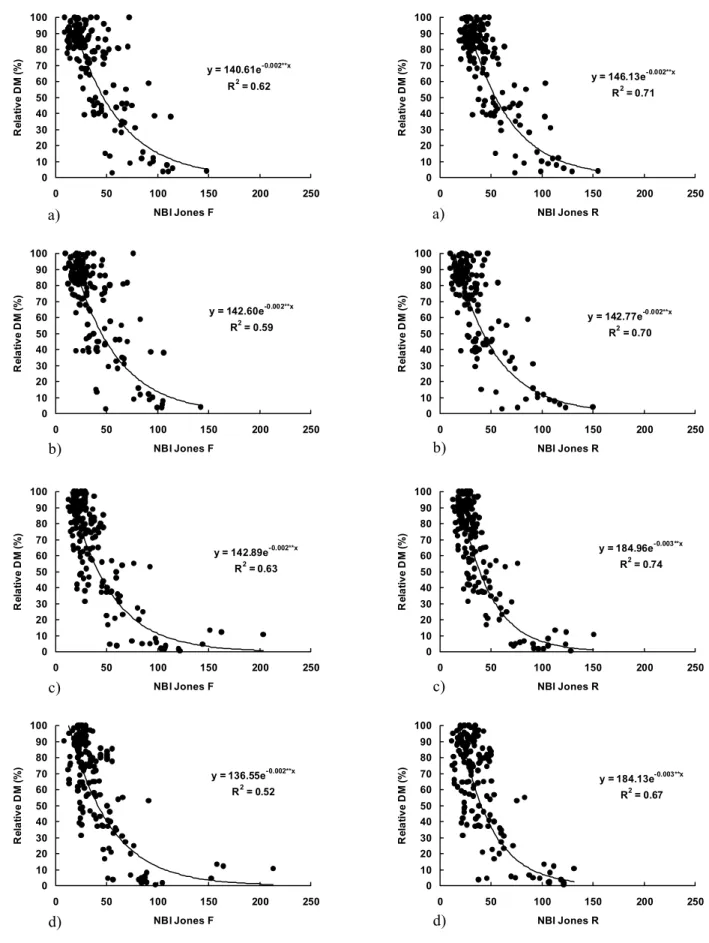
Comparing the combinations of criteria of choice of ratios among nutrients (R and F values) and methods to calculate DRIS indices, it was observed that the fittings between the NBI values and productivity were similar in all the cases. In studies comparing DRIS methods for cit-rus in the State of São Paulo, Santos, W. (1997) verified that the Jones method was better than the others.
Table 1 - Critical level of nutrients in laminae of recently expanded leaves of Brachiaria decumbens, arbitrarily defined by the Sufficiency Range Criterion.1
1Values obtained from Monteiro et al. (1995); Santos, A. (1997);
Mattos (1997) and Monteiro (2004) for the laminae of recently expanded leaves, and from Gallo et al. (1974) and Werner et al. (1996) for the new leaves of Signal grass.
t n e i r t u
N SufficiencyRange
1
t n e i c i f e
D Adequate Excess
g k g (
N -1) <15 15to20 >35.5
g k g (
P -1) <1.0 1.0to 1.5 >2.3
g k g (
K -1) <15 15to25 >35
g k g ( a
C -1) <2.5 3.0to 6.0 >9.0
g k g ( g
M -1) <2.0 2.0to 5.0 >6.0
g k g (
S -1) <0.8 0.8to 1.6 >3.2
g k g m ( u
C -1) <2.0 2.0to 8.0 >10
g k g m ( e
F -1) <25 30to150 >250
g k g m ( n
M -1) <25 30to50 >100
g k g m ( n
y = 153.29e-0.017**x
R2 = 0.65
0 10 20 30 40 50 60 70 80 90 100
0 50 100 150 200 250
NBI Beaufils F
Re
la
ti
v
e
DM
(
%
)
y = 189.94e-0.019**x
R2 = 0.60
0 10 20 30 40 50 60 70 80 90 100
0 50 100 150 200 250
NBI Beaufils R
Re
la
ti
v
e
DM
(
%
)
y = 149.82e-0.017**x
R2 = 0.66
0 10 20 30 40 50 60 70 80 90 100
0 50 100 150 200 250
NBI Beaufils F
Re
la
ti
v
e
DM
(
%
) y = 161.93e-0.018**x
R2 = 0.60
0 10 20 30 40 50 60 70 80 90 100
0 50 100 150 200 250
NBI Beaufils R
Re
la
ti
v
e
DM
(
%
)
y = 149.57e-0.018**x
R2 = 0.47
0 10 20 30 40 50 60 70 80 90 100
0 50 100 150 200 250
NBI Beaufils F
Re
la
ti
v
e
DM
(
%
)
y = 141.20e-0.016**x
R2 = 0.47
0 10 20 30 40 50 60 70 80 90 100
0 50 100 150 200 250
NBI Beaufils R
Re
la
ti
v
e
DM
(
%
)
y = 151.24e-0.016**x
R2 = 0.39
0 10 20 30 40 50 60 70 80 90 100
0 50 100 150 200 250
NBI Beaufils F
Re
la
ti
v
e
DM
(
%
)
y = 144.80e-0.016**x
R2 = 0.40
0 10 20 30 40 50 60 70 80 90 100
0 50 100 150 200 250
NBI Beaufils R
Re
la
ti
v
e
DM
(
%
)
Figure 1 - Relationship between the relative dry mass (DM) production of Signal grass and Nutritional Balance Index (NBI) obtained by the method of Beaufils for combinations of methods choice of ratio order among nutrients (F and R values) in the first growth using the norm of the first growth (a), in the first growth using the general norm (b), in the second growth using the norm of the second growth (c) and in the second growth using the general norm (d).
a) a)
b) b)
c) c)
y = 140.61e-0.002**x
R2 = 0.62
0 10 20 30 40 50 60 70 80 90 100
0 50 100 150 200 250
NBI Jones F
Re
la
ti
v
e
DM
(
%
)
y = 146.13e-0.002**x
R2 = 0.71
0 10 20 30 40 50 60 70 80 90 100
0 50 100 150 200 250
NBI Jones R
Re
la
ti
v
e
DM
(
%
)
y = 142.60e-0.002**x
R2 = 0.59
0 10 20 30 40 50 60 70 80 90 100
0 50 100 150 200 250
NBI Jones F
Re
la
ti
v
e
DM
(
%
)
y = 142.77e-0.002**x
R2 = 0.70
0 10 20 30 40 50 60 70 80 90 100
0 50 100 150 200 250
NBI Jones R
Re
la
ti
v
e
DM
(
%
)
y = 142.89e-0.002**x
R2 = 0.63
0 10 20 30 40 50 60 70 80 90 100
0 50 100 150 200 250
NBI Jones F
Re
la
ti
v
e
DM
(
%
)
y = 184.96e-0.003**x
R2 = 0.74
0 10 20 30 40 50 60 70 80 90 100
0 50 100 150 200 250
NBI Jones R
Re
la
ti
v
e
DM
(
%
)
y = 136.55e-0.002**x
R2 = 0.52
0 10 20 30 40 50 60 70 80 90 100
0 50 100 150 200 250
NBI Jones F
Re
la
ti
v
e
DM
(
%
)
y = 184.13e-0.003**x
R2 = 0.67
0 10 20 30 40 50 60 70 80 90 100
0 50 100 150 200 250
NBI Jones R
Re
la
ti
v
e
DM
(
%
)
Figure 2 - Relationship between the relative dry mass (DM) production of Signal grass and Nutritional Balance Index (NBI) obtained by the method of Jones for combinations of methods choice of ratio order among nutrients (F and R values) in the first growth using the norm of the first growth (a), in the first growth using the general norm (b), in the second growth using the norm of the second growth (c) and in the second growth using the general norm (d).
a) a)
b) b)
c) c)
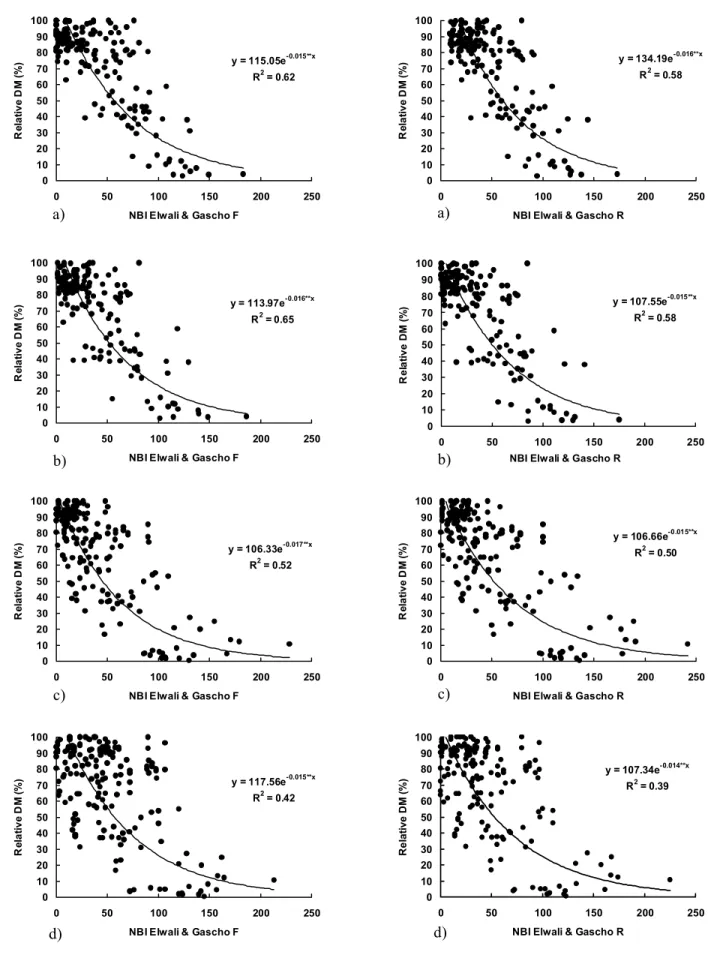
Figure 3 - Relationship between the relative dry mass (DM) production of Signal grass and Nutritional Balance Index (NBI) obtained by the method of Elwali & Gascho for combinations of methods choice of ratio order among nutrients (F and R values) in the first growth using the norm of the first growth (a), in the first growth using the general norm (b), in the second growth using the norm of the second growth (c) and in the second growth using the general norm (d).
y = 115.05e-0.015**x
R2 = 0.62
0 10 20 30 40 50 60 70 80 90 100
0 50 100 150 200 250
NBI Elwali & Gascho F
Re
la
ti
v
e
DM
(
%
) y = 134.19e-0.016**x
R2 = 0.58
0 10 20 30 40 50 60 70 80 90 100
0 50 100 150 200 250
NBI Elwali & Gascho R
Re
la
ti
v
e
DM
(
%
)
y = 113.97e-0.016**x
R2 = 0.65
0 10 20 30 40 50 60 70 80 90 100
0 50 100 150 200 250
NBI Elwali & Gascho F
Re
la
ti
v
e
DM
(
%
) y = 107.55e-0.015**x
R2 = 0.58
0 10 20 30 40 50 60 70 80 90 100
0 50 100 150 200 250
NBI Elwali & Gascho R
R
e
la
tiv
e
D
M
(%
)
y = 106.33e-0.017**x
R2 = 0.52
0 10 20 30 40 50 60 70 80 90 100
0 50 100 150 200 250
NBI Elwali & Gascho F
Re
la
ti
v
e
DM
(
%
) y = 106.66e
-0.015**x
R2 = 0.50
0 10 20 30 40 50 60 70 80 90 100
0 50 100 150 200 250
NBI Elwali & Gascho R
Re
la
ti
v
e
DM
(
%
)
y = 117.56e-0.015**x
R2 = 0.42
0 10 20 30 40 50 60 70 80 90 100
0 50 100 150 200 250
NBI Elwali & Gascho F
Re
la
ti
v
e
DM
(
%
) y = 107.34e
-0.014**x
R2 = 0.39
0 10 20 30 40 50 60 70 80 90 100
0 50 100 150 200 250
NBI Elwali & Gascho R
Re
la
ti
v
e
DM
(
%
)
a) a)
b) b)
c) c)
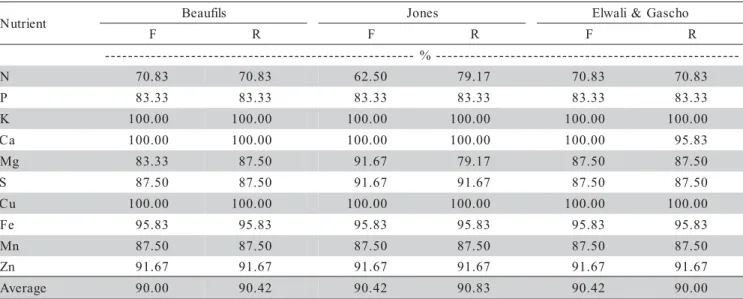
The percentage of agreement between DRIS meth-ods and the criterion of sufficiency range was used to de-fine the best diagnosis method for Signal grass, consider-ing all the nutrients evaluated in the experiment carried out with this grass collected at the Mundo Novo farm and grown with combinations of nitrogen and sulfur rates. For this, it was verified the number of samples with concen-trations classified as deficient (below the appropriate), as appropriate and as in excess (above the appropriate) for the criterion of sufficiency range and the number of samples with indicative DRIS indices of deficiency (DRIS indices of the nutrient lower than zero and DRIS indices, in module, higher than the NBIa), of appropriate nutrition (DRIS indices lower than or equal to NBIa) and of excess (DRIS indices of nutrient above zero and DRIS indices, in module, higher than to NBIa) for the DRIS methods.
The variation in the percentage of agreement in the nutritional diagnosis varied between 62.5% and 100%, among the evaluated models (Table 2). The number of agreements among the evaluated DRIS methods either by using the F value or the R value and the criterion of suffi-ciency range were similar. The lowest percentage of agree-ments for the diagnosis using DRIS and the sufficiency range criterion was obtained for the nitrogen. The results showed that for nitrogen the sufficiency range criterion identified greater number of deficient plants than the DRIS method.
Comparing the average of results obtained using both criteria of choice for the ratio order of nutrients (F value and R value), it was found similar results for the types of criteria, indicating that both can be used for Sig-nal grass. On the other hand, Nick (1998) for coffee plants and Mourão Filho et al. (2002) for “Valencia” orange
trees observed that the criterion of R value was better than the F value.
ACKNOWLEDGEMENTS
The authors gratefully acknowledge Waldssimiler Teixeira de Mattos for supplying part of the necessary data for this work, and Anacleto Ranulfo dos Santos, Plínio Marcos Frare and Renata Aparecida Martim for their help in conducting some of the experiments cited in this paper.
REFERENCES
BEAUFILS, E.R. Diagnosis and recommendation integrated system (DRIS). A general scheme for experimentation and calibration based on principles developed from research in plant nutrition. Pietermararitzburg, South Africa: University of Natal, 1973. 132p. (Soil Science Bulletin, 1).
BEVERLY, R.B.; A practical guide to the Diagnosis and Recommendation Integrated System (DRIS). Athens: Micro-Macro, 1991. 87p. ELWALI, A.M.O.; GASCHO, G.J. Soil testing, foliar analysis, and DRIS as
guide for sugarcane fertilization. Agronomy Journal, v.76, p.466-470, 1984.
GALLO, J.R.; HIROCE, R.; BATAGLIA, O.C.; FURLANI, P.R.; FURLANI, A.M.C.; MATTOS, H.B.; SARTINI, H.J.; FONSECA, M.P. Composição inorgânica de forrageiras do Estado de São Paulo. Boletim de Indústria Animal, v.31, p.115-137, 1974.
JONES, C.A. Proposed modifications of the diagnosis and recommendation integrated system (DRIS) for interpreting plant analysis.
Communications in Soil Science and Plant Analysis, v.12, p.785-794, 1981.
LETZSCH, W.S. Computer program for selection of norms for use in the diagnosis and recommendation integrated system (DRIS).
Communications in Soil Science and Plant Analysis, v.16, p.339-347, 1985.
LETZSCH, W.S.; SUMNER, M.E. Effect of population size and yield level in selection of diagnosis and recommendation integrated system (DRIS) norms. Communications in Soil Science and Plant Analysis, v.15, p.997-1006, 1984.
t n e i r t u
N Beaufils Jones Elwali& Gascho
F R F R F R
-%
-N 70.83 70.83 62.50 79.17 70.83 70.83
P 83.33 83.33 83.33 83.33 83.33 83.33
K 100.00 100.00 100.00 100.00 100.00 100.00
a
C 100.00 100.00 100.00 100.00 100.00 95.83
g
M 83.33 87.50 91.67 79.17 87.50 87.50
S 87.50 87.50 91.67 91.67 87.50 87.50
u
C 100.00 100.00 100.00 100.00 100.00 100.00
e
F 95.83 95.83 95.83 95.83 95.83 95.83
n
M 87.50 87.50 87.50 87.50 87.50 87.50
n
Z 91.67 91.67 91.67 91.67 91.67 91.67
e g a r e v
A 90.00 90.42 90.42 90.83 90.42 90.00
MATTOS, W.T. Diagnose nutricional de potássio em duas espécies de Braquiária. Piracicaba: USP/ESALQ, 1997. 74p. (Dissertação -Mestrado).
MATTOS, W.T. Avaliação de pastagem de capim-Braquiária em degradação e sua recuperação com suprimento de nitrogênio e enxofre. Piracicaba: USP/ESALQ, 2001. 97p. (Tese - Doutorado).
MONTEIRO, F.A. Concentração e distribuição de nutrientes em gramíneas e leguminosas forrageiras. In: SIMPÓSIO SOBRE MANEJO ESTRATÉGICO DA PASTAGEM, 2., Viçosa , 2004. Anais. Viçosa: UFV/DZO, 2004. p.71-107.
MONTEIRO, F.A.; MATTOS, W.T.; MARTIM, R.A. Partes da planta e diagnose nutricional de fósforo em Brachiaria decumbens. In: CONGRESSO BRASILEIRO DE CIÊNCIA DO SOLO, 25., Viçosa, 1995. Anais. Viçosa: SBCS, 1995. v.2, p.556-557.
MOURÃO FILHO, F.A.A. DRIS: Concepts and applications on nutritional diagnosis in fruit crops. Scientia Agricola, v.61, p.550-560, 2004. MOURÃO FILHO, F.A.A.; AZEVEDO, J.C. DRIS norms for ‘Valencia’
sweet orange on three rootstocks. Pesquisa Agropecuária Brasileira,
v.38, p.85-93, 2003.
MOURÃO FILHO, F.A.A.; AZEVEDO, J.C.; NICK, J.A. Funções e ordem da razão dos nutrientes no estabelecimento de normas DRIS em laranjeiras ‘Valência’. Pesquisa Agropecuária Brasileira, v.37, p.185-192, 2002.
NICK, J.A. DRIS para cafeeiros podados. Piracicaba: USP/ESALQ, 1998. 86p. (Dissertação - Mestrado).
SANTOS, A.R. Diagnose nutricional e resposta do capim-Braquiária submetido a doses de nitrogênio e enxofre. Piracicaba: USP/ESALQ, 1997. 115p. (Tese - Doutorado).
SANTOS, W.R. Métodos diagnósticos do equilíbrio nutricional dos macronutrientes em citros. Piracicaba: USP/ESALQ, 1997. 113p. (Dissertação - Mestrado).
Received April 08, 2005 Accepted October 05, 2005
SARRUGE, J.R.; HAAG, H.P. Análises químicas em plantas. Piracicaba: ESALQ, 1974. 54p.
SAS Institute Inc. SAS/STAT.User’s guide, version 8.0. Cary, 2000. SILVEIRA, C.P.; NACHTIGALL, G.R.; MONTEIRO, F.A. Norms for the
diagnosis and recommendation integrated system for Signal grass.
Scientia Agricola, v.62, 513-519, 2005.
SUMNER, M.E. Use of the DRIS system in foliar diagnosis of crops at high yield levels. Communications in Soil Science and Plant Analysis,
v.8, p.251-268, 1977.
WADT, P.G.S. Os métodos da chance matemática e do sistema integrado de diagnose e recomendação (DRIS) na avaliação nutricional de plantios de eucalipto. Viçosa: UFV, 1996. 123p. (Tese - Doutorado).
WADT, P.G.S.; NOVAIS, R.F.; ALVAREZ VENEGAS, V.H.; FONSECA, S.; BARROS, N.F. Valores de referência para macronutrientes em eucalipto obtidos pelos métodos DRIS e chance matemática. Revista Brasileira de Ciência do Solo, v.22, p.685-692, 1998.
WADT, P.G.S.; NOVAIS, R.F.; ALVAREZ VENEGAS, V.H.; BRAGANÇA, S.M. Alternativas de aplicação do “DRIS” à cultura de café conilon (Coffea canephora Pierre). Scientia Agricola, v.56, p.83-92, 1999. WALWORTH, J.L.; SUMNER, M.E. The diagnosis and recommendation
integrated system (DRIS). Advances in Soil Science, v.6, p.149-188, 1987.