Review
DRIS: CONCEPTS AND APPLICATIONS ON NUTRITIONAL
DIAGNOSIS IN FRUIT CROPS
Francisco de Assis Alves Mourão Filho*
USP/ESALQ - Depto. de Produção Vegetal, C.P. 9 - 13418-900 - Piracicaba, SP - Brasil. *Corresponding author <[email protected]>
ABSTRACT: Nutrition and fertilization are important factors in determining fruit yield and fruit quality. There are several methods for plant nutritional status diagnosis, among them, two are relevant and named as Sufficiency Range Approach (SRA) and Diagnosis and Recommendation Integrated System (DRIS). This research reports the main concepts and applications of DRIS in nutritional diagnosis of fruit crops, comparing it with current nutritional diagnosis methods, indicating advantages and disadvantages, and possible limitations to be investigated.
Key words: foliar analysis, fruit crops, mineral nutrition
DRIS: CONCEITOS E APLICAÇÕES NA DIAGNOSE NUTRICIONAL
EM PLANTAS FRUTÍFERAS
RESUMO: A nutrição e a adubação são fatores determinantes na produtividade dos pomares e na qualidade de frutos. Dentre os diversos métodos de diagnose nutricional das plantas, destacam-se o critério de faixas de suficiência (CFS) e o sistema integrado de diagnose e recomendação (DRIS – “Diagnosis and Recommendation Integrated System”). São relatados neste trabalho os principais conceitos e aplicações do método DRIS na diagnose nutricional em fruteiras, comparando-o com os sistemas atuais de diagnose nutricional, apontando vantagens e desvantagens, e possíveis limitações a serem investigadas.
Palavras-chave: análise foliar, fruticultura, nutrição mineral
INTRODUCTION
One of the main plant mineral nutrition objectives is increasing net incomes through efficient fertilization management. To attain this goal, it is initially necessary to correctly determine the yield-limiting impact of a given nutrient.
The search for an effective method to determine plant nutritional status has been the target of many re-searches in plant nutrition. Current methods include both soil and tissues analysis. The advantage of this latter was already observed in early studies of Chapman & Brown (1950). The soil analysis method is based on the assump-tion that the chemical extractants simulate the root sys-tem acquisition of soil nutrients in a comparable manner. However, it does not take into account factors such as soil temperature and aeration, and even the higher or lower absorption due to the own plant nutritional needs. Another soil analysis limitation is soil sampling, which is supposed to actually represent the soil portion explored by the roots (Reuther & Smith, 1954).
Tissue analysis is considered a more direct method of plant nutritional status evaluation than soil analysis, but that method must necessarily involve a well-defined plant part analysis (Hallmark & Beverly, 1991).
Among the several tissues to be considered for nutritional diagnosis purposes, leaves constitute the main plant sam-pling material (Chapman & Brown, 1950). The improve-ment in tissue analysis techniques enabled the compari-son of results from different soil type fertilization experi-ments. In the same way, it allowed the evaluation of fruit crop plants response to treatments in nutrient solution ex-periments (Reuther et al., 1958).
2- The DRIS method
The usual methods for leaf chemical analyses in-terpretation presuppose the nutrient concentration com-parison with reference values (critical concentrations or sufficiency ranges). Nutrient concentrations far below or above reference values are associated with decreasing vegetative growth, yield and quality. These methods in-tend to evaluate isolated deficiency or excess values, without measuring the overall nutritional balance. More-over, researches related to this subject indicate a great dif-ficulty in establishing consistent critical values and re-late them with high yields, mainly because the nutritional status varies with leaf tissue maturation. Thus, sampling definition is a fundamental step for better accuracy of these methods.
A new interpretation for leaf analysis was firstly developed and proposed by Beaufils (1957; 1971; 1973) for rubber trees (Hevea brasiliensis), named as
diagno-sis and recommendation integrated system (DRIS). The DRIS method uses nutrient ratios instead of absolute and/ or individual nutrient concentrations for interpretation of tissue analysis. Soon after the initial proposed DRIS norms for leaf analysis interpretation were released, fur-ther ones were developed for ofur-ther agricultural, forest and horticultural crops. In countries such as United States, Canada, and China, DRIS is being adopted as part of a representative diagnosis in selected areas (Lopes, 1998; Hallmark & Beverly, 1991; Walworth & Sumner, 1987).
2.1- DRIS method theoretical basis
The DRIS method expresses results of plant nu-tritional diagnosis through indices, which represent, in a continuous numeric scale, the effect of each nutrient in the nutritional balance of the plant. These indices are ex-pressed by positive or negative values, which indicate that the referred nutrient is in an excess or deficiency, respec-tively. The closer to zero are the indices for all the ents, the closer will be the plant to the adequate nutri-tional balance (Beverly, 1991; Walworth & Sumner, 1987).
The working premises for DRIS are based on: (a) the ratios among nutrients are frequently better indica-tors of nutrient deficiencies than isolated concentrations values; (b) some nutrient ratios are more important or sig-nificant than others; (c) maximum yields are only reached when important nutrient ratios are near the ideal or opti-mum values, which are obtained from high yielding-se-lected populations; (d) as a consequence of the stated in (c), the variance of an important nutrient ratio is smaller in a high yielding (reference population) than in a low yielding population, and to the relations between vari-ances of high and low yielding populations can be used in the selection of significant nutrient ratios; (e) the DRIS indices can be calculated individually, for each nutrient, using the average nutrient ratio deviation obtained from
the comparison with the optimum value of a given nutri-ent ratio, hence, as pointed by Jones (1981) and Walworth & Sumner (1987), the ideal value of the DRIS index for each nutrient should be zero.
In general, the DRIS has some advantages over other diagnosis methods: presents continuous scale and easy interpretation; allows nutrient classification (from the most deficient up to the most excessive); can detect cases of yield limiting due to nutrient unbalance, even when none of the nutrients is below the critical level; and fi-nally, allows to diagnose the total plant nutritional bal-ance, through an unbalance index (Baldock & Schulte, 1996). An additional advantage of DRIS, acknowledged by some authors but rebuted by others, is that, overall, it is less sensitive to tissue aging in comparison to others (Walworth & Sumner, 1987). Tissue aging influence the nutrient concentration (nutrient content/ dry matter); sev-eral examples are reported in the literature, including studies in alfalfa, potato, corn, peach, and many other ag-ricultural and horticultural crop species. Although some exceptions may occur, concentrations of nitrogen, phos-phorus, potassium and sulfur tend to decrease with tis-sue aging. On the other hand, calcium and magnesium concentrations tend to increase in older tissues (low mo-bility), in spite of the opposite being reported in the very early or later stages for some crops. The dynamic nature of the plant tissue mineral composition tends to restrict the use of leaf analysis for nutritional diagnosis. As al-ready stated, the criteria of critical levels or sufficiency ranges generally depend on norms for diagnosis derived from an specific plant tissue part and age, and classifies the plants based solely in the leaf nutrient concentration (leaf nutrient content/ leaf dry matter). Thus, the plant growth stage for leaf sampling is an essential factor for the application of both methods, and therefore, the diag-noses based on these criteria are usually applied in leaf samples obtained from a well-defined growth stage.
little research has been developed to determine the influ-ence of the cultivar in the nutrient concentration in a given maturation or development stage. Finally, factors that affect the tissue aging rate might also influence the relation between nutrient concentration and maturation.
An option for these diagnosis methods was pro-posed through the DRIS (Beaufils, 1973), which defined that, in general, nitrogen, phosphorus and potassium con-centrations decrease with tissue maturation. Therefore, the ratios N/P, N/K, and P/K (or reciprocal ratios) should be kept constant. In the same way, because of concentrations of Ca and Mg generally increase with maturation, quo-tients between these nutrients (Ca/Mg or Mg/Ca) should result in constant values. Moreover, the product of two nutrients, with concentrations running in opposite direc-tions with time (N × Ca, for example), also should re-main constant.
An example of nutrient ratio use is illustrated in Table 1, where nutrient concentrations in corn tissues are expressed in a dry matter basis or as nutrient ratios (Walworth & Sumner, 1987). The expression in a dry matter basis (%N, %P and %K) showed much more co-herent correlation with tissue maturation (higher deter-mination coefficients - r2) than the expression as nutrient ratios.
Such constancy in the nutrient ratios and their products cannot be applied in all cases. Several nutrient concentration rate can change very fast in young plants, and the nutrient ratios and their products can also vary in these cases. Even so, these expression forms are less affected by the maturation processes, therefore present-ing great potential to expand usefulness and exactness of the leaf tissue diagnosis.
Nevertheless, DRIS advantages have already been contested, because for some crops, it showed to be as sen-sitive as SRA to plant tissue maturation and plant age (Baldock & Schulte, 1996). Moreover, additional limita-tions to the method can be pointed, such as the need for extensive and advanced computational calculations and
Table 1 - Determination coefficients (r2) for the correlation
between corn plant age at sampling (tissue maturation) and tissue nutrient concentration, and nutrient ratios (Beaufils, 1971).
m r o f n o i s s e r p x
E Determinationcoefficient(r2)
) % ( s i s a b r e t t a m y r D
N 0.41
P 0.25
K 0.55
s i s a b o i t a r t n e i r t u n a n I
B /
N 0.00
K /
N 0.06
P /
K 0.01
equipment, results expressed in non-independent indices, and frequent occurrence of false diagnosis for some nu-trient excesses.
Due to recent developments in both hardware and software resources, the difficulty in running the method turned to be of little importance. The non-independent indices are perhaps an advantage, because this might be the greater DRIS contribution in relation to the SRA. Other ten mistakes in the diagnosis through DRIS have also been identified, but many of them do not affects the method effectiveness in a relevant way (Hallmark & Beverly, 1991).
2.1.1 - DRIS norms
The first step for the implementation of any nu-tritional diagnosis method is the establishment of stan-dards or norms, and the same applies for the DRIS method. The DRIS norms are always obtained in a high-yielding population, named reference population, which is selected from a larger population. The databases for definition of norms might have variable size in function of premises to be adopted in the method and should be uniform, regarding the crop characteristics. Norms ob-tained from a large database derived from different soil types, climates and cultivars, usually cannot be general-ized, and they will be considered representative just if they include all the population variability. Therefore, these attributes should be previously well defined, and thus, be gathered to form the database (Letzsch & Sumner, 1984).
The database size might not be directly related to standard quality. DRIS norms developed from 10 cornfield observations, with yields exceeding 18 t ha-1, were more representative and efficient than norms deriving from larger databases (Walworth et al., 1988). Scientific literature re-ports a large variation in the database size for DRIS norms definition, from just 24 observations (Leite, 1992) up to about 2,800 (Sumner, 1977) or even more. However, al-though the latter presents a high quality, it is also more embracing because, it refers to a population of all corn cul-tivars and to the whole Southern Africa territory, while the first is originated from Conilon coffee plants, cultivated only in the north of the Espírito Santo State, Brazil. Maybe, too much generic DRIS norms can negatively affect the diagnosis efficiency. Despite the data quantity, the obser-vation quality should be the goal for database choice.
Several researches have revealed that the selec-tion of the reference populaselec-tion is an important factor for the DRIS effectiveness and success. Walworth & Sumner (1987) alleged that the reference limit to separate two sub-populations should be arbitrarily chosen, because each sub-population ought to present normal distribution. Other authors recommended that the reference population contain, at least, 10% of the overall database observations (Letzsch & Sumner, 1984). Malavolta & Malavolta (1989) recommended the reference population to be ob-tained with 80% maximum yield observations.
DRIS norms are originated after the reference population definition, in other words, the relation between all the nutrients pairs and their respective standard de-viations or coefficient of variation are obtained. The ra-tio between a pair of nutrients can be direct or inverse. The concentrations of nitrogen and phosphorus, for in-stance, can be related either as N/P or P/N ratio.
In DRIS calculi, each pair of nutrients is discrimi-nated by only one expression. There are several criteria to select the best adequate expression and the most used is the variance largest ratio among high and low yield-ing populations (Letzsch, 1985; Walworth & Sumner, 1987). That same criterion was named “F value” (Nick, 1998). Bataglia & Santos (1990) evaluated direct and in-direct ratios, concluding that the ratio order can interfere in the indexes results in citrus, especially if the function is obtained according to Jones (1981) proposal. Nick (1998) suggested the criterion named “r value” for the nutrient ratio order choice for DRIS application in pruned coffee plants, which is referred to the correlation coeffi-cient calculation (r) between plant variable response val-ues and the ratio between nutrient pairs, both in direct or inverse order. This ratio order that will result in higher correlation coefficient absolute value is the chosen one. Studies in citrus showed that the “r value” is an adequate criterion for the determination of the nutrient ratio order (Mourão Filho et al., 2002).
The DRIS for plant nutritional diagnosis can ba-sically be applied in two forms: DRIS graphs and DRIS indices. The DRIS graphs are applied in the norms for only three nutrients and their ratios (Walworth & Sumner, 1987). Although the use of diagrams or graphs enable the diagnosis for three nutrients, DRIS still favors the math-ematical ranking of the nutrient ratios or their products in nutritional indices, which can be easily interpreted. Ini-tially, the DRIS reference or norms values should be de-termined, as already described, for all the nutrient ratios or products (for all nutrient pairs) to be used in the indi-ces calculation.
After norms definition, sample analysis results are ready to be submitted to the DRIS indices calculation (Walworth & Sumner, 1987), which are composed of each nutrient individual index, calculated in two steps: first, the functions for each nutrient pair ratio, and second, the
sum of functions involving each nutrient. Hypothetical A to N nutrient indices can, therefore, be calculated as fol-lows (Walworth & Sumner, 1987):
Index A = [ (A/B) + (A/C) + (A/D) ... + (A/N)]f f f f Z
Index B = [- (A/B) + (B/C) + (B/D) ... + (B/N)]f f f f Z
Index N = [- (A/N) - (B/N) + (C/N) ... - (M/N)]f f f f Z
where: When A/B is larger or equal to a/b,
F(A/B) = (A/B – 1) 1000
a/b CV
Or, when A/B is smaller than a/b,
F(A/B) = (1 - a/b) 1000
A/B CV
In these equations, A/B is the tissue nutrient ra-tio of the plant to be diagnosed; a/b is the optimum value or norm for that given ratio; CV is the coefficient of varia-tion associated with the norm; and z is the number of functions in the nutrient index composition. Values for other functions, such as f(A/C) and f(A/D) are calculated
in the same way, using appropriate norms and CV. In other words, one nutrient index is the average function of all the ratios containing a given nutrient. The compo-nents of this average value are pondered by the CV re-ciprocal of the high yielding populations (reference popu-lations). Thus, if the A/B and A/C ratios are both used to generate an index for the A nutrient, the contribution of each one to the calculation of this index will be func-tion of the CV values (reference ratios) associated to them, what will reflect the relative influence of these two expressions in the crop yield.
Several model modifications have been proposed to increase accuracy in the nutritional diagnosis for sev-eral crops. The calculation of the nutrient ratio functions is made according to one of three methods, namely: (a) the original method proposed by Beaufils (1973); (b) the Jones (1981) method; and (c) the Beaufils (1973) method, modified by Elwali & Gascho (1984). Although these nutrient function ratio calculation methods have been evaluated in some researches, there is not yet a clear defi-nition for the best recommendation. The three methods applied to rubber trees revealed that Beaufils (1973) and Elwali & Gascho (1984) procedures presented similar re-sults, and that Jones (1981) procedure showed depen-dence on the nutrient ratio (Bataglia & Santos, 1990).
& Gascho (1984) method showed lesser interpretation er-rors (Santos, 1997).
According to Beverly (1991), there are two ways for the second and last stage of DRIS indices calculation (the function sum involving each nutrient) namely: DRIS (Beaufils, 1973) and M-DRIS (Hallmark et al., 1987; Walworth et al., 1986). The original DRIS method just uses the nutrient ratio functions. On the other hand, the M-DRIS method, a variation and expansion of original DRIS, foresees dry matter inclusion in the indices calcu-lation. The expressions are identical to the ordinarily used, however, in this case, the dry matter is treated as an additional constituent and a new index is calculated, in the same way as for the other plant constituents. In fact, dry matter is, essentially, the sum of the concentration of three nutrients usually ignored in nutritional consider-ations: C, H, and O. That additional index is the dry mat-ter mass index, a good indicator of the sampled tissue maturity regarding the standard.
The DRIS utilization can be enlarged for evalua-tion of other given data beyond the limits of those related to leaf analysis. Thus, norms for soil analysis tests were developed for P, K, Ca, and Mg to be applied in sugar cane crop in Southern Africa (Beaufils & Sumner, 1976). As in the leaf diagnosis, the use of DRIS for soil analyses re-sults, presents the advantage of carrying considerations on the nutritional balancing and the nutrient ranking in terms of relative abundance to the optimum levels.
DRIS can also be expanded for expressions includ-ing essential elements, such as Si or Na, or even non-nutritional variables, like plant population or planting date, although such variables were not included in calibrations in already published diagnosis. Theoretically, nutrients such
as nitrate and ammonium can be considered apart and treated as individual nutritional factors, in expressions within the method (Walworth & Sumner, 1987).
The absolute sum values of the nutrients indices generate an additional index denominated Nutritional Balance Index (NBI). This index can be useful to the plant nutritional status indication, without however, hint-ing their causes. The higher the sum value, the larger will be the indication of plant nutritional unbalance and, there-fore, the lower will be the yield. NBI can be calculated for both DRIS and M-DRIS.
2.1.2- Interpretation of the DRIS nutritional indexes
The value of each ratio function is added to the subtotal of one index and subtracted from another [that is, the value f (A/B) is added to A index and subtracted
from B index]; before the final ponderation, all the in-dexes are balanced around zero (Walworth & Sumner, 1987). Consequently, the sum of the nutritional indexes must be zero. When results are negative (lower than zero), that means deficiency, and the more negative the index, the higher the deficiency will be in relation to the other diagnosed nutrients. On the other hand, high index val-ues (the more positive and distant from zero indexes) in-dicate excessive quantity of the considered nutrient rela-tively to the others.
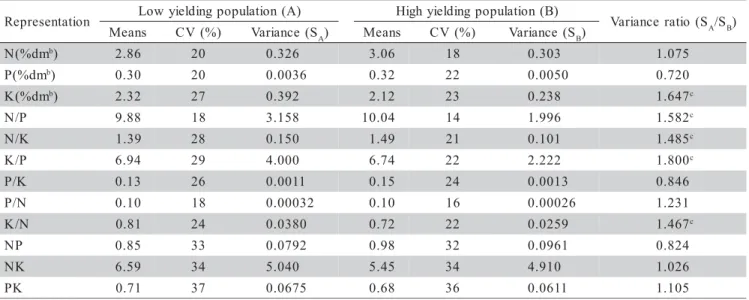
The following example may illustrate the DRIS method interpretation, and to make it simple, this example refers only to nitrogen (N), phosphorus (P) and potassium (K). Other nutrients may be incorporated to the calcula-tions using the same procedure. For a nutritional diag-nosis in maize, the interpretation norms are presented in Table 2.
n o i t a t n e s e r p e
R Lowyieldingpopulation(A) Highyieldingpopulation(B) Varianceratio(SA/SB) s
n a e
M CV(%) Variance (SA) Means CV(%) Variance(SB) m
d % (
N b) 2.86 20 0.326 3.06 18 0.303 1.075
m d % (
P b) 0.30 20 0.0036 0.32 22 0.0050 0.720
m d % (
K b) 2.32 27 0.392 2.12 23 0.238 1.647c
P /
N 9.88 18 3.158 10.04 14 1.996 1.582c
K /
N 1.39 28 0.150 1.49 21 0.101 1.485c
P /
K 6.94 29 4.000 6.74 22 2.222 1.800c
K /
P 0.13 26 0.0011 0.15 24 0.0013 0.846 N
/
P 0.10 18 0.00032 0.10 16 0.00026 1.231 N
/
K 0.81 24 0.0380 0.72 22 0.0259 1.467c
P
N 0.85 33 0.0792 0.98 32 0.0961 0.824 K
N 6.59 34 5.040 5.45 34 4.910 1.026 K
P 0.71 37 0.0675 0.68 36 0.0611 1.105
Table 2 - Maize DRIS norms for nitrogen, phosphorus and potassium(a).
a Data from Sumner (1982), apud Walworth & Sumner (1987)1; b dm = dry matter; cVariances obtained for low and high yielding populations
are significantly different at P < 0.01.
1SUMNER, M.E. The Diagnosis and Recommendation Integrated System (DRIS). Soil/Plant Analysis Workshop, Council on Soil
Considering a maize leaf sample with the follow-ing nutrient concentrations in the dry matter: N (3.30%), P (0.20%) and K (1.20 %), the calculations to be made are the ratios between the nutrients (represented in capi-tal letters in the previous equations) that are: N/P = 3.30/ 0.20 = 13.5; N/K = 3.30/1.20 = 2.75; and N/P = 1.20/ 0.20 = 6.0.
Thus,
f(N/P) = (N/P – 1) 1000
n/p CV
because N/P > n/p.
Applying the respective values, it will result: f(N/
P) = [(16.5/10.04) – 1] (1000/14) = 45.96.
In the same way,
f(N/K) = (N/K – 1) 1000 = (2.75 – 1) 1000 = 40.27
n/k CV 1.49 21
The equation for the f(K/P) is, however, 1 – [(k/
p)/(K/P)] (1000/CV), because k/p > K/P and is equal to [1 – 6.74/6.00)] (1000/22) = -5.61. The other nutrient in-dexes are calculated:
N index = [f(N/P + f(N/K)]/2 = (45.96 + 40.27)/2 = 43
P index = [-f(N/P) – f(K/P)]/2 = (-45.96 + 5.61)/2 = -20
K index = [-f(N/K) + f(K/P)]/2 = (-40.27 – 5.61) = -23
The N index (43) >> P index (-20) > K index (-23); thus, this result may be interpreted as: for a high yielding corn, the K is being relatively more required than P, which is more required than N.
A leaf sample with adequate nutritional balance will show all indexes equal to zero. However, it is pos-sible to have a nutrient presenting an index equal to zero and not being at the adequate concentration. For example, supposing the following diagnosis results:
Nutrient: N P K Ca Mg
Index: -21 0 +7 +7 +7
It might be concluded that N index would indi-cate the most deficient nutrient, compared to the others, and would probably be the most limiting nutrient if the yields were entirely related to the nutrition. And the P index equal to zero, would indicate a nutrient relatively less abundant than K and Ca or Mg and would be the sec-ond more deficient in this diagnosis. Nevertheless, in this case, because of nutrients may be added but not be re-moved from the soil, at least under ordinary conditions, the recommendations for this diagnosis would be addi-tion of N, and addiaddi-tion of P in lower proporaddi-tion, despite the P index equal to zero.
2.1.3 - Application of DRIS method to fruit crops
Since the original proposal, DRIS was developed for several horticultural, ornamental, and fruit species. Among the main horticultural species already diagnosed by this method are the lettuce (Sanchez et al., 1991), to-mato (Caron & Parent, 1989; Caron et al., 1991; Hartz et al., 1998; Parent et al., 1993; Rouin et al., 1988; Mayfield et al., 2002), potato (Mac Kay et al., 1987; 1989; Meldal-Johnsen & Sumner, 1980; Navvabzdeh & Malakouti, 1993; Parent et al., 1994a), onion (Caldwell et al., 1994), cucumber (Mayfield et al., 2002), and car-rot (Parent et al., 1994b)
There are few research works in the literature about the application of DRIS method in ornamental plants. Some of them refer to the Christmas pine (Abies fraseri) (Rathfon & Burger, 1991a; 1991b; Arnold et al.,
1992).
There are reports on DRIS application to fruit crops and some DRIS norms were developed for appli-cation on cherries, Napolean cultivar, in the State of Or-egon, USA (Davee et al., 1986). The DRIS indexes for each nutrient and the unbalance-index were calculated. Plants with high unbalanced indexes presented consis-tently low yield, but crop systems using mulching pre-sented lower unbalanced indexes and relatively higher yields. These nutrient unbalanced indexes were more cor-related with relative increases in yield than any other nu-tritional parameter. Some authors from the State of Or-egon, using DRIS norms recommended for cherries and hazelnuts, have calculated the DRIS indexes for N, P, K, Ca, Mg, Mn, Fe, Cu, B and Zn in more than 1,000 leaf sample data for each crop (Righetti et al., 1988). The nu-trient unbalanced indexes were obtained through the sum of values in module. The sample with the least nutrient unbalanced indexes was considered the ideal sample for their nutrient concentrations, and its values were used to create an artificial database and determining which criti-cal values would be more consistent when compared to the DRIS evaluations. By means of calculations that maintained all but one nutrient in ideal levels, and vary-ing another, the authors identified the concentration of each nutrient that would be associated to nutritional un-balance occurrence. Thus, besides the nutritional diag-noses evaluation based on the nutrient ratios, the norms for DRIS also allowed evaluating the SRA for nutrients that DRIS itself sometimes appoints as relatively deficient or excessive nutrients.
severely unbalanced plants, would be efficiently detected in leaf samples. From a total of 624 leaf analyses, the di-agnoses resulted in agreement of both methods, especially when the sufficiency range was narrow for a given nu-trient. On the other hand, some nutrients were not iden-tified in the range of severely in excess or deficiency in any of the leaf samples classified as severely unbalanced, based on the DRIS indexes sum. N and Mg deficiencies were not detected, unless extremely low limits for the nu-trient unbalance indexes were used. The use of such low limits for the N and Mg deficiencies unbalance indexes induced the identification of some high-yielding plants as nutritionally unbalanced. Thus, in this situation, DRIS was not effective in detecting nutrient deficiencies or tox-icities and it was concluded that the method is a comple-mentary tool to the SRA, providing additional informa-tion about nutriinforma-tional unbalances.
The application of DRIS has also been consid-ered for apple trees (Parent & Granger, 1989). DRIS norms were derived from an apple compact orchard in Canada. The experiment was installed in the Appalachian mountains region, at Quebec, with the Morspur McIntosh cultivar on the M.7, M.26, Ott. 3, and M. 9 dwarfing rootstocks. The plants received 12 different fertilization treatments involving commercial products based on N, P, K, Ca, and Mg in three rates. The higher yielding plants on the Ott.3 rootstock presented lower leaf Mg concen-trations than on the other rootstocks. Variations in the norms, year by year, led to an annual norm definition. It was concluded that annual yields could be used instead of cumulative yields for the DRIS norms definition, es-pecially after the sixth planting year. The incorporation of the dry matter index in the nutritional balance equa-tions (M-DRIS) was important to better define the limit-ing and non-limitlimit-ing nutrients, especially when the tis-sue samples were collected in a specific period, as is the case of fruit trees.
Research works carried out in Hungary investi-gated the DRIS standard ratios for apple orchards (Szucs et al., 1990). Data on yield and leaf nutrient concentra-tion from 18 representative orchards were collected dur-ing three consecutive years. By means of conventional DRIS method calculations, the indexes indicated K-ex-cess and P-deficiency, while the N concentrations were adequate. The norms estimated by quadratic regression analyses for N/P, N/K and K/P indicated K excess and relative N- and P-deficiency, suggesting that the norms obtained by regression analysis might possibly point out more extreme nutrient ratios than the traditional method. DRIS norms and indexes involving N, P, K, Ca and Mg were established for apple orchards in New Zealand (Goh & Malakouti, 1992). DRIS was compared to the SRA and the conclusion was that both methods pre-sented similar efficacy. Unbalances referred to the N-ex-cess and Ca-deficiency were detected. The best sampling
period for diagnosis purposes was 3 to 5 months after blooming.
Preliminary norms for DRIS in vineyards were determined in Germany (Schaller & Lohnertz, 1984). The indexes were calculated based on approximately 7,000 groups of leaf samples. The reference population (high productivity) was defined as that presenting high sugar content in the fruit must. The developed norms allowed the detection of limiting nutrient concentrations for pro-ductivity and quality, which could not be detected using the conventional methods. On the other hand, it was not possible to demonstrate coincident results between soil analysis and DRIS norms. By means of simple and mul-tiple regression analyses, DRIS norms provided precise estimates for the next year yields.
In India, DRIS preliminary norms were derived from ‘Thompson Seedless’ grape, which indexes were evaluated in a low yielding vineyard (Chelvan et al., 1984). The DRIS norms were determined from a popu-lation in 48 plots, with three-year-old plants, cultivated with four N rates (300; 600; 900 and 1200 kg ha-1), four K2O rates (0; 500; 1000 and 1500 kg ha-1) in a factorial, and a unique P2O5 rate (500 kg ha-1). Plots that showed yields higher than 20 kg per vine plant (9 m2) were con-sidered as high-yielding plots and those lower than 15 kg per vine plant in the same area, as low-yielding plots. Overall, for low productivity plots, high P- and low K-indexes were obtained. The most limiting nutrients were K and N in the plots that received only N in the rate of 900 kg ha-1. In another research in India, new criteria was developed to classify the N nutritional status of two grapevine cultivars based on the DRIS indexes calculated with soil and leaf analysis data (Bhargava & Raghupathi, 1995). Besides the new nutrient level adopted, new fer-tilization procedures were also recommended.
Research data on the nutritional diagnosis meth-ods for pecan were also developed and preliminary DRIS norms were obtained from a data collection of more than 3,000 entries, including the yield and 11 nutrient concen-trations. The reference population was selected from 25% best yielding plants (yield above 58 kg per plant) (Beverly & Worley, 1992).
method and some of its variations with the method DOP (Deviation from Optimum Percentage), using leaf samples of the ‘Batsch’ peach cultivar, and concluded that both methods presented similar efficiency.
The DRIS method was used to identify mineral deficiencies associated to the mango decline (a disorder of unknown etiology), in ‘Tommy Atkins’ cultivar orchards, in Florida, USA (Schaffer et al., 1988). The nutrient defi-ciencies associated to decline-affected plants were corre-lated to the whole orchard nutrition and not to the indi-vidual plant nutritional status. Higher nutrient unbalanced indexes were observed in highly affected than in healthy orchards. In the decline-affected plants, the nutrients con-sidered deficient according to the DRIS method were Mn, Fe, or a combination of both. These nutrient concentrations were below the critical value in two of the three decline-affected mango orchards. The Mg concentration was higher, overall, in decline-affected plants than in healthy plants. In the affected orchards, phosphorus was the nutri-ent with the lowest DRIS index, but the average leaf P centration was still above the critical value. It was con-cluded that DRIS used together with sufficient ranges, might be a good auxiliary tool to detect nutritional defi-ciencies in decline-affected mango orchards.
DRIS norms were developed for mango orchards, Alphonso cultivar, using a plant population from the Maharashtra district, India (Raghupathi & Bhargava, 1999). The reference population was defined within the produc-tivity range of 5.4 and 7.4 t ha-1. Low yield was associ-ated to low Mg concentrations. The same authors devel-oped another similar research work with pomegranate (Punica granatum, L.) (Raghupathi & Bhargava, 1998).
Preliminary DRIS norms were also developed for N, P, and K for pineapple plantation, based on more than 1,100 observations (previously published) on the leaf nu-trient composition and yields (Angeles et al., 1990). The data were separated in high yielding (above 60 t ha-1) and low yielding groves (below 60 t ha-1), and the DRIS norms were derived by the standard method. The norms validity was tested using independent groups of published data from factorial experiments with significant responses for N, P and K. For most data grouping, correct diagno-sis were obtained using DRIS, while the method of criti-cal values was inefficient for the N, P and K diagnosis.
In another paper, Angeles et al. (1993) developed DRIS norms for banana, based on 915 observations from 26 sources (published and unpublished data). The refer-ence subpopulation was selected according to productiv-ity equal or superior to 70 t ha-1. The indexes originated from the developed norms were compared with the method of critical values and the results of both methods were similar, except for K and K/nutrient ratios. The DRIS norms validity and their advantages over the method of critical values, by providing correct nutritional diagnosis, were partially confirmed through a fertilization
experiment. In Eastern Africa, experiments and research carried out in 45 farms in the region of Kagera, Tanza-nia, also derived new norms to estimate the nutritional status of the banana plantation, using both DRIS and the critical value method (Wortmann et al., 1994).
These two methods were also utilized to identify nutrient deficiencies in papaya grown in nutrient solution in the greenhouse and in the field, in Hawaii, USA (Bowen, 1992). Plants grown in complete nutrient solu-tion in the greenhouse did not show any nutrient defi-ciency, and the DRIS indexes were all positive, indicat-ing that no nutrient was actually limitindicat-ing plant growth. Plants grown in the field were found to present some vi-sual symptoms of nutrient deficiency and their leaf peti-ole contents indicated deficient nutrient concentrations that according to DRIS were P, Fe and Zn. The average P concentration was below the critical level in all plants showing visual symptoms of nutrient unbalance, what was confirmed by the negative DRIS index. The indexes for Fe and Zn were also negative, indicating that they might not be in adequate levels, although the actual leaf Fe and Zn concentrations were within or above the sufficiency range. Toxicity might be, thus, an important factor ex-pressing visual symptoms, particularly for Zn. Magnesium concentrations were significantly higher in unhealthy plants than in the healthy ones, but the DRIS indexes did not detect this situation. It was concluded that the DRIS method seems to be useful in detecting nutrient deficien-cies in papaya, when used simultaneously with the method of critical values for the interpretation of tissue nutrient analysis.
For citrus, early studies on DRIS were carried out at California, USA, by Beverly et al. (1984), when prelimi-nary reference values were derived for nutritional diagno-sis of N, P, K, Ca, and Mg for ‘Valencia’ sweet orange. These values were also used for subsequent comparisons with the SRA and, overall, both methods presented simi-lar results. However, the DRIS diagnosis was affected by the sample tissue type and maturation, and the indexes re-flected the nutrient concentration change related to the yield alternation or to the presence of fruits in the shoots at sampling time. The DRIS indexes were in agreement with the SRA diagnosis, only when changes in nutrient concentration significantly affected the second method.
more precise recommendations when evaluated by field tests. After this work, new researches involving data col-lecting during five more years revealed that SRA could be more advantageous than DRIS for ‘Valencia’ sweet orange (Beverly, 1992). The author compared SRA, DRIS and three modifications of DRIS. The SRA showed effi-cacy (not presenting false diagnosis) for N and P diag-nosis status in 75 and 90% of the cases, respectively, com-pared to 50% or less by the other methods. All tested methods showed efficacy for K diagnosis.
Wallace (1990) carried out studies on DRIS for ‘Valencia’ sweet orange, from the established by Beverly et al. (1984), investigating several N, P, K ratios and in-teractions. This author observed 23 % yield increase in re-sponse to K supply, but 69 % increase when N and P were also added. DRIS was an effective method for nutritional diagnosis in this study. Woods & Villiers (1992), in re-search works developed at South Africa, obtained well suc-ceeded DRIS results for ‘Valencia’ sweet orange, in dis-agreement with the results reported by Beverly (1992). Those authors observed good correlation between yield (kg plant-1) and fruit quality (fruit mass; g), with DRIS indexes derived from 1,700 observations. The results were com-pared with the conventional diagnosis method. The DRIS norms were also evaluated in fertilization experiments and the increase in yield and fruit quality (fruit mass) were con-sistent with DRIS diagnosis.
To develop DRIS norms for ‘Verna’ lemon nu-tritional diagnosis, research was carried out at Murcia and Alicante, Spain (Cerda et al., 1995). The adopted refer-ence population presented yield equal or above 125 kg plant-1. The DRIS determinations were influenced by the rootstock/scion combination and leaf sampling period. The results of diagnosis agreed with those obtained by the SRA only when the analyzed leaves came from the same period of sampling than the ones for the DRIS norms. Under salinity conditions, DRIS was not effective in detecting if the cause of nutrient deficiency, that is, whether the nutrient unbalance was due to high salinity of fertilization deficiency. Results obtained in hydropon-ics were used to establish a data bank for DRIS indexes calculation for several citrus rootstock/scion combinations in Spain (Moreno et al., 1996). Useful reference values were determined for Fe availability evaluation and its in-fluence in the nutrition of studied citrus rootstock/scion combinations, under sufficient and deficient Fe supply. A lemon scion budded on Citrus macrophylla rootstock
showed less Fe-chlorosis deficiency symptoms compared to the same lemon budded on sour orange. Citrus volkameriana induced higher Fe-deficiency tolerance than
Cleopatra mandarin, when used as rootstocks combined with sweet orange scions.
DRIS norms were developed for ‘Valencia’ sweet orange for a plant population with different plant ages, on various rootstocks, at several regions of the four most
important citrus producing States of Venezuela (Rodriguez et al., 1997). The reference population was obtained through the selection of the 20% most produc-tive plants. The values obtained were comparable to the previously determined in the literature. The authors con-cluded that DRIS method might be a low cost, timesav-ing and trustful alternative for the development of nutri-tional diagnosis norms.
In Brazil, there is paucity on DRIS method inves-tigations, especially in fruit crops. Apart of one research carried out in banana (Teixeira et al., 2002), a few other studies were realized in citrus. Bataglia (1989) was prob-ably the first author to report the application of this method for citrus nutritional diagnosis and indicated DRIS as an alternative diagnosis method, pointing out the need of us-ing it together with other diagnoses criteria. The DRIS norms for N, P, K, Ca, Mg and S, were calculated accord-ing to Jones (1981), usaccord-ing a reference subpopulation with productivity equal or superior to 120 kg plant-1.
Creste (1996) reported the first DRIS evaluation by comparison with the SRA in groves of Brazil, study-ing ‘Siciliano’ lemon. Data were obtained from the analy-sis of leaves of fruiting branches of different plant ages and rootstocks, collected in several harvesting years. The reference population was derived from plants with pro-ductivity greater than 80 t ha-1. After the DRIS norms cal-culations, the method was evaluated under field condi-tions. DRIS showed to be more advantageous over the SRA, mainly because it was able to discriminate the nu-trient importance order of deficiency or excess.
Santos (1997) evaluated the DRIS method using results of leaf analysis derived from a series of field ex-periments with N, P, K fertilization in commercial groves of the State of São Paulo. This author obtained superior results with the DRIS compared to the SRA, for detecting yield limitation by nutrient deficiency. Among the three available procedures for the DRIS indexes calculations, that proposed by Jones (1981) was the most advantageous.
Yield response curves were established for three cultivars of sweet orange (‘Pera’, ‘Valência’ and ‘Natal’) budded on two rootstocks (Rangpur lime and Cleopatra mandarin) in southwestern State of São Paulo (Creste & Grassi Filho, 1998). The most productive rootstock/scion combination was obtained for ‘Pera’ sweet orange bud-ded on Rangpur lime. It was suggested that regional DRIS norms should be established instead of general norms.
Mourão Filho & Azevedo (2003) established DRIS norms for the ‘Valencia’ sweet orange budded on Rangpur lime, Caipira sweet orange, and Poncirus trifoliata rootstocks. The nutritional balance indexes
3 - Final remarks
A careful overview on the scientific literature re-veals that DRIS is a promising, effective auxiliary tool for the nutritional diagnosis in several crops, although, still unknown, barely studied and applied. Except for a few studies, most of the developed research works turns clear that DRIS is as effective as the conventional meth-ods of nutritional diagnosis (critical values and suffi-ciency range) with the additional advantage of establish-ing a nutrient deficiency or excess rankestablish-ing, accordestablish-ing to its importance, and a strong relation among them, quan-tifying the plant nutrient balance.
There are controversies regarding calculation pro-cedures for the norms and DRIS indexes. One of the main questions is about the method application validation and the data universe that the norms are expected or supposed to represent. Most research results have indicated that the more specific the data universe, the more effective the method for the norms derivation.
The criteria for the reference subpopulation defi-nition also demand further studies, and are, to a certain extent, specifically adjusted for each situation. In this way, DRIS norms should be developed for specific con-ditions, in which all other factors to be correlated with yield or quality (or any other variable) be known and iso-lated: cultivar, climate, soil and crop management, pro-ductivity etc., attaining the specific objectives.
Finally, it is highlighted that researches, both in a worldwide or Brazilian basis, on DRIS method utiliza-tion are incipient. Further investigautiliza-tions are necessary on the identification and isolation of factors that significantly affect productivity, under several fruit crop management production systems.
REFERENCES
ALKOSHAB, O.; RIGHETTII, T.L.; DIXON, A.R. Evaluation of DRIS for judging the nutritional status of hazelnuts. Journal of the American Society for Horticultural Science, v.113, p.643-647, 1988.
ANGELES, D.E.; SUMNER, M.E.; BARBOUR, N.W. Preliminary nitrogen, phosphorous, and potassium DRIS norms for pineapple. HortScience, v.25, p.652-655, 1990.
ANGELES, D.E.; SUMNER, M.E.; LAHAV, E. Preliminary DRIS norms for banana. Journal of Plant Nutrition, v.16, p.1059-1070, 1993. ARNOLD, R.J.; JETT, J.B.; ALLEN, H.L. Identification of nutritional
influences on cone production in fraser fir. Soil Science Society of America Journal, v.56, p.586-591, 1992.
BALDOCK, J.O.; SCHULTE, E.E. Plant analysis with standarized scores combines DRIS and sufficiency range approaches for corn. Agronomy Journal, v.88, p.448-456, 1996.
BATAGLIA, O.C. DRIS-Citros: uma alternativa para avaliar a nutrição das plantas. Laranja, v.10, p.565-576, 1989.
BATAGLIA, O.C.; SANTOS, W.R. dos. Efeito do procedimento de cálculo e da população de referência nos índices do sistema integrado de diagnose e recomendação (DRIS). Revista Brasileira de Ciência do Solo, v.14, p.339-344, 1990.
BEAUFILS, E.R. Diagnosis and recommendation integrated system (DRIS).
Soil Science Bulletin, v.1, p.1-132, 1973.
BEAUFILS, E.R. Physiological diagnosis: a guide for improving maize production based on principles developed for rubber trees. Fertilizer Society of South Africa Journal, v.1, p.1-28, 1971.
BEAUFILS, E.R. Research for rational exploitation of Hevea using a
physiological diagnosis based on the mineral analysis of various parts of the plants. Fertilite, v.3, p.27-38, 1957.
BEAUFILS, E.R.; SUMNER, M.E. Application of the DRIS approach for calibrating soil, plant yield and plant quality factors of sugarcane.
Proceedings of the South Africa Sugar Technology Association, v.50, p.118-124, 1976.
BEVERLY, R.B. Modified DRIS method for simplified nutrient diagnosis of ‘Valencia’ oranges. Journal of Plant Nutrition, v.10, p.1401-1408, 1987. BEVERLY, R.B. A practical guide to the diagnosis and recommendation
integrated system (DRIS). Athens: Micro-Macro, 1991. 87p. BEVERLY, R.B. Prescient diagnostic-analysis shows sufficiency range
approach superior to DRIS for Citrus. Communications in Soil Science and Plant Analysis, v.23, p.2641-2649, 1992.
BEVERLY, R.B.; WORLEY, R.E. Preliminary DRIS diagnostic norms for Pecan. HortScience, v.27, p.271, 1992.
BEVERLY, R.B.; STARK, J.C.; OJALA, J.C.; EMBLETON, T.W. Nutrient diagnosis of ‘Valencia’ oranges by DRIS. Journal of the American Society for Horticultural Science, v.109, p.649-654, 1984.
BHARGAVA, B.S.; RAGHUPATHI, H.B. Current status and new norms of nitrogen nutrition for grapevine (Vitis vinifera). Indian Journal of
Agricultural Sciences, v.65, p.165-169, 1995.
BOWEN, J.E. Comparative DRIS and critical concentration interpretation of papaya tissue analysis data. Tropical Agriculture, v.69, p.63-67, 1992. CALDWELL, J.O.; SUMNER, M.E.; VAVRINA, C.S. Development and testing of preliminary foliar DRIS norms for onions. HortScience, v.29, p.1501-1504, 1994.
CARON, J.; PARENT, L.E. Derivation and assessment of DRIS norms for greenhouse tomatoes. Canadian Journal of Plant Science, v.69, p.1027-1035, 1989.
CARON, J.; PARENT, L.E.; GOSSELIN, A. Effect of nitrogen and salinity levels in the nutrient solution on the DRIS diagnosis of greenhouse tomato. Communications in Soil Science and Plant Analysis, v.22, p.879-892, 1991.
CERDA, A.; NIEVES, M.; MARTINEZ, V. An evaluation of mineral analysis of Verna lemons by DRIS. Communications in Soil Science and Plant Analysis, v.26, p.1697-1707, 1995.
CHAPMAN, H.D.; BROWN, S.M. Analysis of orange leaves for diagnosing nutrient status with reference to potassium. Hilgardia, v.19, p.501-540, 1950.
CHELVAN, R.C.; SHIKHAMANY, S.D.; CHADHA, K.L. Evaluation of low yielding vines of Thompson seedless for nutrient indices by DRIS analysis. The Indian Journal of Horticulture, v.41, p.166-170, 1984. CRESTE, J.E. Uso do DRIS na avaliação do estado nutricional do limoeiro
Siciliano. Botucatu: UNESP/FCA, 1996. 120p. (Tese - Doutorado). CRESTE, J.E.; GRASSI FILHO, H. Estabelecimento de curvas de
produtividade para três variedades e dois porta-enxertos cítricos na região sudoeste do Estado de São Paulo, com ênfase ao DRIS. In: CONGRESSO BRASILEIRO DE FRUTICULTURA, 15., Poços de Caldas, 1998.
Resumos. Poços de Caldas: Sociedade Brasileira de Fruticultura, 1998. v.1, p.299.
DAVEE, D.E.; RIGHETII, T.L.; FALLAHI, E.; ROBBINS, S. An evaluation of the DRIS approach for identifying mineral limitations on yield in ‘Napolean’ sweet cherry. Journal of the American Society for Horticultural Science, v.111, p.988-993, 1986.
ELWALI, A.M.O.; GASCHO, G.J. Soil testing, foliar analysis, and DRIS as guide for sugarcane fertilization. Agronomy Journal, v.76, p.466-470, 1984.
GOH, K.M.; MALAKOUTI, M.J. Preliminary nitrogen, phosphorous, potassium, calcium and magnesium DRIS norms and indexes for apple orchards in Canterbury, New Zealand. Communications in Soil Science and Plant Analysis, v.23, p.1371-1385, 1992.
HALLMARK, W.B.; BEVERLY, R.B. Review – An update in the use of the Diagnosis and Recommendation Integrated System. Journal of Fertilizer Issues, v.8, p.74-88, 1991.
HALLMARK, W.B.; MOOY, C.J. de; PESEK, J. Comparison of two DRIS methods for diagnosing nutrient dificiencies. Journal of Fertilizer Issues, v.4, p.151-158, 1987.
JONES, W.W. Proposed modifications of the diagnosis and recommendation integrated system (DRIS) for interpreting plant analyses.
Communications in Soil Science and Plant Analysis, v.12, p.785-794, 1981.
LEITE, R. de A. Avaliação do estado do cafeeiro conilon no estado do Espírito Santo utilizando diferentes métodos de interpretação de análise foliar. Viçosa: UFV, 1992. 87p. (Tese - Doutorado).
LETZSCH, W.S. Computer program for selection of norms for use in the diagnosis and recommendation integrated system (DRIS).
Communications in Soil Science and Plant Analysis, v.16, p.339-347, 1985.
LETZSCH, W.S.; SUMNER, M.E. Effect of population size and yield level in selection of Diagnosis and Recommendation Integrated System (DRIS) norms. Communications in Soil Science and Plant Analysis, v.15, p.997-1006, 1984.
LOPES, A.S. Manual internacional de fertilidade do solo. 2.ed. Piracicaba: POTAFOS, 1998. 177p.
MAC KAY, D.C.; CAREFOOT, J.M.; ENTZ, T. Evaluation of the DRIS procedure for assessing the nutritional status of potato (Solanum tuberosum L.) Communications in Soil Science and Plant Analysis, v.18, p.1331-1353, 1987.
MAC KAY, D.C.; ENTZ, T.; CAREFOOT, J.M.; DUBETZ, S. Comparison of critical nutrient concentrations with DRIS for assessing nutrient deficiencies of potatoes on irrigated chernozemic soils. Canadian Journal of Plant Science, v.69, p.601-609, 1989.
MALAVOLTA, E.; MALAVOLTA, M.L. Diagnose foliar: princípios e aplicações. In: BULL, L.T., ROSOLEM, C.A. Interpretação de análise química de solo e planta para fins de adubação. Botucatu, Fundação de Estudos e Pesquisas Agrícolas e Florestais, Faculdade de Ciências Agronômicas, Universidade Estadual Paulista, 1989. p. 227-308. MAYFIELD, J.L.; SIMONNE, E.H.; MITCHELL, C.C.; SIBLEY, J.L.;
BOOZER, R.T.; VINSON, E.L. Effect of current fertilization practices on nutritional status of double-cropped tomato and cucumber produced with plasticulture. Journal of Plant Nutrition, v.25, p.1-15, 2002. MELDAL-JOHNSEN, A.; SUMNER, M.E. Foliar diagnostic norms for
potatoes. Journal of Plant Nutrition, v.2, p.569-576, 1980. MORENO, J.J.; LUCENA, J.J.; CARPENA, O. Effect of the iron supply
on the nutrition of different citrus variety/rootstock combinations using DRIS. Journal of Plant Nutrition, v.19, p.689-704, 1996.
MOURÃO FILHO, F.A.A.; AZEVEDO, J.C. DRIS norms for Valencia sweet orange on three rootstocks. Pesquisa Agropecuária Brasileira, v.38, p.85-93, 2003.
MOURÃO FILHO, F.A.A.; AZEVEDO, J.C.; NICK, J.A. Funções e ordem da razão dos nutrientes no estabelecimento de normas DRIS em laranjeira ‘Valência’. Pesquisa Agropecuária Brasileira, v.37, p.185-192, 2002. NAVVABZDEH, M.; MALAKOUTI, M.J. Development of DRIS norms for potato in the calcareous soils of Iran. Journal of Plant Nutrition, v.16, p.1409-1416, 1993.
NICK, J.A. DRIS para cafeeiros podados. Piracicaba: USP/ESALQ, 1998. 86p. (Dissertação - Mestrado).
PARENT, L.E.; GRANGER, R.L. Derivation of DRIS norms from a high-density apple orchard established in the Quebec Appalachian Mountains. cherry. Journal of the American Society for Horticultural Science, v.114, p.915-919, 1989.
PARENT, L.E.; KARAM, A.; VISSER, S.A. Compositional nutrient diagnosis of the greenhouse tomato. HortScience, v.28, p.1041-1042, 1993.
PARENT, L.E.; CAMBOURIS, A.N.; MUHAWENIMANA, A. Multivariate diagnosis of nutrient imbalance in potato crops. Soil Science Society of America Journal, v.58, p.1432-1438, 1994a.
PARENT, L.E.; ISFAN, D.; TREMBLAY, N.; KARAM, A. Multivariate nutrient diagnosis of the carrot crop. Journal of the American Society for Horticultural Science, v.119, p.420-426, 1994b.
RAGHUPATHI, H.B.; BHARGAVA, B.S. Diagnosis of nutrient imbalance in pomegranate by diagnosis and recommendation integrated system and compositional nutrient diagnosis. Communications in Soil Science and Plant Analysis, v.29, p.2881-2892, 1998.
RAGHUPATHI, H.B.; BHARGAVA, B.S. Preliminary nutrient norms for ‘Alphonso’ mango using diagnosis and recommendation integrated system. Indian Journal of Agricultural Sciences, v.69, p.648-650, 1999.
RATHFON, R.A.; BURGER, J.A. Diagnosis and Recommendation Integrated System (DRIS) nutrient norms for Fraser Fir Christmas trees.
Forest Science, v.37, p.998-1010, 1991a.
RATHFON, R.A.; BURGER, J.A. Diagnosis and Recommendation Integrated System modifications for Fraser Fir Christmas trees. Soil Science Society American Journal, v.55, p.1031-1037, 1991b. REUTHER, W.; SMITH, P.F. Leaf analysis of citrus. In: CHILDERS, N.F.
(Ed.) Fruit nutrition. New Brunswick: Rutgers University, 1954. cap.7, p.257-294.
REUTHER, W.; EMBLETON, T.W.; JONES, W.W. Mineral nutrition of tree crops. Annual Review of Plant Physiology, v.9, p.175-205, 1958. RIGHETII, T.L.; ALKOSHAB, O.; WILDER, K. Verifying critical values from DRIS norms in sweet cherry and hazelnut. Communications in Soil Science and Plant Analysis, v.19, p.1449-1466, 1988.
RODRIGUEZ, O.; ROJAS, E.; SUMNER, M. Valencia orange DRIS norms for Venezuela. Communications in Soil Science and Plant Analysis,
v.28, p.1461-1468, 1997.
ROUIN, N.D.; CARON, J.; PARENT, L.E. Influence of some artificial substrates on productivity and DRIS diagnosis of greenhouse tomatoes (Lycopersicum esculentum L. Mill., cv “Vedettos”). Acta Horticulturae,
n.221, p.45-52, 1988.
SANCHEZ, C.A.; SNYDER, G.H.; BURDINE, H.W. DRIS evaluation of the nutritional status of Crisphead lettuce. HortScience, v.26, p.274-276, 1991.
SANTOS, W.R. dos. Avaliação do equilíbrio nutricional dos macronutrientes em citros com diferentes adubações. Piracicaba: USP/ESALQ, 1997. 112 p. (Dissertação - Mestrado).
SANZ, M. Evaluation of interpretation of DRIS system during growing season of the peach tree: Comparison with DOP method.
Communications in Soil Science and Plant Analysis, v.30, p.1025-1036, 1999.
SANZ, M.; HERAS, L.; MONTANES, L. Relationships between yield and leaf nutrient contents in peach-trees – early nutritional-status diagnosis.
Journal of Plant Nutrition, v.15, p.1457-1466, 1992.
SCHAFFER, B.; LARSON, K.D.; SNYDER, G.H.; SANCHEZ C.A. Identification of mineral deficiencies associated with mango decline by DRIS. HortScience, v.23, p.617-619, 1988.
SCHALLER, K.; LOHNERTZ, O. Accomodation of DRIS-system to grape nutrition. In: INTERNATIONAL COLLOQUIUM FOR THE OPTIMIZATION OF PLANT NUTRITION, Montpellier, 1984. v.4, p.1255-1263.
SUMNER, M.E. Application of Beaufils’ diagnostic indices to corn data published in literature irrespective of age and condition. Plant and Soil, v.46, p.359-363, 1977.
SZUCS, E.; KÁLLAY, T.; SZENCI, G. Determination of DRIS indices for apple (Malus domestica Borkh). Acta Horticulturae, n.274, p.443-453,
1990.
TEIXEIRA, L.A.J.; SANTOS, W.R. dos; BATAGLIA, O.C. The N and K diagnosis on banana plants using the diagnosis and recommendation integrated system (DRIS) and critical value approach . Revista Brasileira de Fruticultura, v.24, p.530-535, 2002.
WALLACE, A. Nitrogen, phosphorous, potassium interaction on Valencia orange yields. Journal of Plant Nutrition, v.13, p.357-365, 1990. WALWORTH, J.L.; SUMNER, M.E. The Diagnosis and Recommendation
Integrated System (DRIS). Advances in Soil Science, v.6, p.149-188, 1987.
WALWORTH, J.L.; WOODDARD, H.J.; SUMNER, M.E. Generation of corn tissue norms from a small, high-yield data base. Communications in Soil Science and Plant Analysis, v.19, p.563-577, 1988.
WALWORTH, J.L.; SUMNER, M.E.; ISAAC, R.A.; PLANK, C.O. Use of boundry lines in establishing diagnostic norms. Soil Science Society of America Journal, v.50, p.123-128, 1986.
WOODS, D.B.; VILLIERS, J.M. Diagnosing the nutrient status of ‘Valencia’ oranges in Southern Africa. In: INTERNATIONAL CITRUS CONGRESS, 7., Acireale, 1992. Proceedings. Acireale, 1992. p.556-559.
WORTMANN, C.S.; BOSCH, C.H.; MUKANDALA, L. Foliar nutrient analyses in bananas grown in the highlands of East-Africa. Journal of Agronomy and Crop Science, v.172, p.223-226, 1994.