doi: 10.1590/S1984-46702012000100006
The variation in resources used by sympatric amphibian species may not necessarily reflect competition. Empirical re-search showing differences between sympatric species in the use of trophic, temporal and spatial niches have frequently been used to describe and explain community structure (PIANKA 1975). The segregation of these niche dimensions may permit the partitioning of resources, and thus the ecological coexist-ence of species. Food is a fundamental aspect of the niche, and it seems reasonable to assume that the structure of a commu-nity is based mostly on the way that food is shared among coexisting species (ANDREW & CHRISTENSEN 2001). Thus, the study of trophic relationships among sympatric species is critical to understanding inter-specific interactions (DURÉ & KEHR 2001).
Several mechanisms that promote coexistence have been found in closely related species of anurans, including food dif-ferences (e.g., MENINet al. 2005, SABAGH & CARVALHO-E-SILVA 2008), microhabitat use (DURÉ & KEHR 2004), temporal segregation (e.g., BOWKER & BOWKER 1979, DONNELLY & GUYER 1994), habitat segre-gation (e.g., DIAZ & VALENCIA 1985, LIZANAet al. 1990), and call site segregation (OLDHAM & GERHARDT 1975).
The Asiatic toad, Bufo gargarizans Cantor, 1842; Guentheri
frog, Rana guentheri (Boulenger, 1882); and Ricefield frog, Rana limnocharis (Boie, 1834) are three common species sharing same habitats during autumn in southwestern China. The Asiatic toadsare widely distributed in forests, in fields, and in residen-tial areas in China (FEI 2000). The Guentheri frogs and Ricefield frogs prefer to inhabit still ponds, paddy fields, and rivulets in southern china (FEI 2000). Guenther’s frogs migrate to feeding sites, and live with Ricefield frogs and Asiatic toads before hi-bernation. Although supposedly exposed to a similar spectrum of prey, they have some differences, which may result in dif-ferences in the type and range of prey that they ingest. Fur-thermore, they belong to two distinct families, and our preliminary field observations suggested that they differ in body size and probably also in microhabitat use.
In this work, we studied feeding habits and microhabitat use of three species of anuran, specifically addressing the follow-ing aims: 1) to describe three anuran species, 2) identify and quan-tify the prey consumed by three species, 3) to calculate the niche width, niche overlap and diversity of the diet of B. gargarizans, R. guentheri and R. limnocharis, and 4) to establish the relationship between diet and microhabitat used by the three species.
Trophic ecology and microhabitat utilization by the
Bufo gargarizans
,
Rana guentheri
, and
Rana limnocharis
in southwestern China
Tonglei Yu
1& Yanshu Guo
21 Corresponding Author. College of Life Science, Xinyang Normal University, Henan, China.
E-mail: yutonglei_00000@163.com
2 College of Life Science, China West Normal University, Sichuan, China.
ABSTRACT. We studied the trophic ecology and microhabitat use of the Asiatic toad, Bufo gargarizans Cantor, 1842; Guentheri frog, Rana guentheri (Boulenger, 1882); and the Ricefield frog, Rana limnocharis (Boie, 1834). These three species are common around Nanchong City, in southwestern China, where they live in the same habitat before hiberna-tion. The main objective of this study was to analyze the diets and patterns of coexistence relative to the microhabitat of each species. In the Asiatic toad, based on index of relative importance, the diet was dominated by adult Coleoptera, Isopoda, and Hymenoptera (29.53%, 22.07%, and 15.20%, respectively), while the Guenther’s frog and Ricefield frog ingested predominantly Orthoptera (67.44% and 40.94%, respectively). The standardized feeding niche breadth of the Asiatic toad (0.277) was wider than that of the Guentheri frog (0.177) and Ricefield frog (0.269). The overlap in the trophic niche (prey proportion) between the toad and two species of frog was low (toad vs. Guentheri frog, CH = 0.526; toad vs. Ricefield frog, CH = 0.521), while this was high for the two species of frogs (CH = 0.942). The three species also differed in microhabitat use. Asiatic toads showed strong preference for small roads close to shrubs or pre-harvest corn, while Guenther’s frogs preferred bare surfaces on habitat edges, and Ricefield frogs showed a preference for bare surfaces as feeding sites in the middle of habitat. The difference in diet observed during three species seems to be explained by the difference in microhabitat use and body size of three species.
MATERIAL AND METHODS
Our field study was carried out at County of Gaoping (30°35’N, 105°45’W, elevation 300 m), in southwestern China. The feeding site consists of a large farmland (58%) and a pond (20%) along the Jia Ling River, in contrast to some bare areas (12%) owing to crop harvest. Bushes and weeds (10%) at farm-land edges were the predominant plants, in addition to veg-etable crops. The local climate is subtropical monsoon climate, with an annual average rainfall of 1020 mm. The annual aver-age temperature is 17.6°C; the coldest month is January (6.5°C), the hottest is August (32°C).
We captured toads and frogs from September to October 2006 by hand about once every two weeks during the night or dawn hours by slowly walking in the feeding site and looking for animals. We then transported a random sample of animals back to the laboratory. Body length (measured as snout-to-vent length, SVL) was measured to the nearest 1mm using a plastic ruler with the toads or frogs put belly-down on a flat surface.
Stomach contents were collected using the stomach flush-ing method (LEGLER & SULLIVAN 1979) at least three times for each specimen to remove all stomach contents and stored in separate airtight test tubes in 4% formaldehyde. Prey items were subsequently identified in the laboratory under a binocular anatomical lens.
When animals were found, we recorded the type of mi-crohabitat in which they occurred. We found 109 distinct sites for their availability based on the three species of anurans cap-tured, including three major types of habitat: small roads or bare surface close to shrub or pre-harvested corn, bare surfaces or short grass in the middle of habitat, and bare surfaces or short grass at habitat edges. For better visualization of their activity patterns, habitat types were presented as percentages of the total records per species. In order to determine differ-ences in the frequency of occurrence of habitat type, the Chi-square test was used.
The obtained food items were measured as length and width (with a caliper to the nearest 0.1 mm) and their volume was estimated by the ellipsoid formula V = 4/3 × × L/2 × (W/2)2 (COLLI & ZAMBONI 1999), where (L) item length and (W) item width. We compared SVL (in separate analyses) among species with a one-way ANOVA for each sex. If the overall ANOVA re-sults were significant, we did pairwise multiple comparisons (Tukey’s HSD) to evaluate differences among species. We also compared prey size (mean volume in mm3) of the three species using ANCOVA, with SVL as the covariate. A simple linear re-gression was plotted between prey size (mean volume per stom-ach) and total volume per stomach versus SVL, and total number of prey items per stomach versus SVL.
In addition, we used an index of relative importance (IRI) that was proposed by PIANKAet al. (1971); IRI = %O × (%N +%V), where(%O) relative occurrence, (%N) = relative abundance, and (%V) relative volume.
The food niche breadth was calculated for the three anu-ran species using the total number of items identified in the stom-ach. We used the standardized Levins index as a measurement of niche breadth, BA = (B–1)/(n–1), where n = number of possible resources, and B is Levins index (LEVINS 1968) of niche breadth, B = 1/⌺pi2, where(p
i) the proportion of item i in the diet.
The food niche overlap was calculated using the total number of items identified in the stomachs of three species.
The overlapping formula is given as: where (CH) Morisita-Horn index of niche overlap (HORN 1966), (pij) corresponds to the proportion of resource i in the total resource used by species j, (pik) corresponds to the proportion of resource i in the total resource used by species k. The index ranges from 0 to 1, where 0 indicates no overlap and 1 indicates complete overlap.
RESULTS
A total of 1097 food items were collected from the three anurans. The most important prey items for the entire study period were adult Coleoptera and Myriapoda. Beetles of 12 fami-lies were identified, the most important being Carabidae, Staphylinidae, Elateridae, Curculionidae and Chrysomelidae. The number of empty stomachs was twelve (three B. gargarizans, four R. guentheri, and five R. limnocharis). Traces of molted skin were recorded in three stomachs (B. gargarizan), but were not quantified. Plant remains such as leaves (e.g., gramineae), hy-drophyte (e.g., duckweed), small twigs and seeds (e.g., fever-few), as well as dirt were also observed in 15 (13.76%) stomachs (eight B. gargarizans, four R. guentheri, and three R. limnocharis). Adult female B. gargarizans can reach a SVL of 102.89 ± 2.02 mm (N = 35), and the males are 83.41 ± 2.35mm (N = 14). The Guentheri frog is a medium-sized frog, the adult females are 57.58 ± 1.18 mm (N = 18), and the males are 52.85 ± 1.84 mm (N = 7). The Ricefield Frog is small frog, the adult females of which can reach a SVL of 37.51 ± 1.36 mm (N = 21), and the males are 34.21 ± 1.42 mm (N = 14). Body size varied signifi-cantly among three species in both males (F2, 32 = 181.34, p < 0.001) and females (F2, 71 = 361.32, p < 0.001). Male Asiatic toads were significantly larger than males from the two frog species (Post Hoc test, all p < 0.001). For females, Ricefield frog’s were significantly smaller than Asiatic toads and Guentheri frogs (all p < 0.001). The ANCOVAs showed that the mean volume of prey ingested by two frogs species (Guentheri frog, 264.56 ± 25.47 mm3, N = 95 prey Units; 172.06 ± 21.91 mm3, N = 85 prey Units) was significantly higher (F2, 93 = 4.05, p = 0.021) than that of toads (149.03 ± 7.12 mm3, N = 917 prey Units).
Diet
From 49 Asiatic toad stomachs (14 males, 35 females), we identified 917 food items that represented 20 prey catego-ries. The most common prey was adult Coleoptera, which had highest frequency of occurrence of 80.43% and followed by Orthoptera (63.04%), Isopoda (60.87%), Hymenoptera (54.35%), Diplopoda (45.65%), and Dermaptera (32.61%). Items consumed by the Asiatic toads were: Hymenoptera (26.17%), Isopoda (19.74%), Coleoptera-adults (18.32%), Diplopoda (10.14%), Orthoptera (5.56%), Lepidoptera-larvae (4.03%), and Dermaptera (3.49%). However, according to the IRI (Tab. I), adult Coleoptera were the most important items at 29.53%, Isopoda (22.07%) were the second most important item, fol-lowed by Hymenoptera (15.20%), Orthoptera (11.97%), and Diplopoda (9.00%).
From 25 stomachs of Guenther’s frog (7 males, 18 females), 95 food items were identified, which represented only nine prey categories. The most common prey was Orthoptera, which had the highest frequency of occurrence of 71.43%, and followed by Isopoda (28.57%), Oligochaeta (28.57), Araneae (19.05%), Hy-menoptera (14.29%), Coleoptera-adults (14.29%). Items con-sumed by the Guenther’s frogs, Orthoptera (40.00%), Isopoda (17.89%), Oligochaeta (12.62%), Oligochaeta (12.63%), Hy-menoptera (10.53%), Araneae (7.37%), and Coleoptera-adults (6.32%). Similarly, according to the IRI (Tab. I), Orthoptera (67.44%) were the most important items in the diet. Oligochaeta (12.52%) were the second most important item, followed by Isopoda (6.61%), Araneae (1.90%), and Hymenoptera (1.52%).
From 35 stomachs of the Ricefield frog (13 males, 22 fe-males), we only identified 85 food items that represented 14
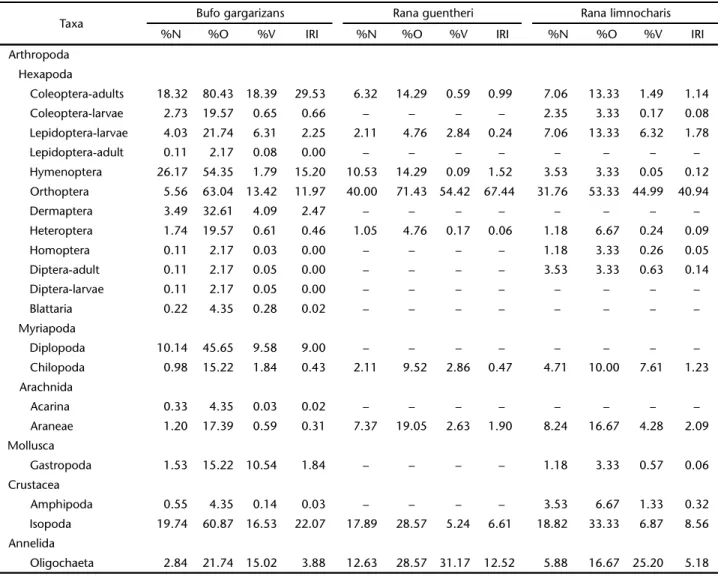
Table I. Prey categories with their respective absolute values and relative abundance (%N), frequency of occurrence (%O), volume (%V) and index of relative importance (IRI).
Taxa Bufo gargarizans Rana guentheri Rana limnocharis
%N %O %V IRI %N %O %V IRI %N %O %V IRI
Arthropoda Hexapoda
Coleoptera-adults 18.32 80.43 18.39 29.53 6.32 14.29 0.59 0.99 7.06 13.33 1.49 1.14
Coleoptera-larvae 2.73 19.57 0.65 0.66 – – – – 2.35 3.33 0.17 0.08
Lepidoptera-larvae 4.03 21.74 6.31 2.25 2.11 4.76 2.84 0.24 7.06 13.33 6.32 1.78
Lepidoptera-adult 0.11 2.17 0.08 0.00 – – – – – – – –
Hymenoptera 26.17 54.35 1.79 15.20 10.53 14.29 0.09 1.52 3.53 3.33 0.05 0.12
Orthoptera 5.56 63.04 13.42 11.97 40.00 71.43 54.42 67.44 31.76 53.33 44.99 40.94
Dermaptera 3.49 32.61 4.09 2.47 – – – – – – – –
Heteroptera 1.74 19.57 0.61 0.46 1.05 4.76 0.17 0.06 1.18 6.67 0.24 0.09
Homoptera 0.11 2.17 0.03 0.00 – – – – 1.18 3.33 0.26 0.05
Diptera-adult 0.11 2.17 0.05 0.00 – – – – 3.53 3.33 0.63 0.14
Diptera-larvae 0.11 2.17 0.05 0.00 – – – – – – – –
Blattaria 0.22 4.35 0.28 0.02 – – – – – – – –
Myriapoda
Diplopoda 10.14 45.65 9.58 9.00 – – – – – – – –
Chilopoda 0.98 15.22 1.84 0.43 2.11 9.52 2.86 0.47 4.71 10.00 7.61 1.23
Arachnida
Acarina 0.33 4.35 0.03 0.02 – – – – – – – –
Araneae 1.20 17.39 0.59 0.31 7.37 19.05 2.63 1.90 8.24 16.67 4.28 2.09
Mollusca
Gastropoda 1.53 15.22 10.54 1.84 – – – – 1.18 3.33 0.57 0.06
Crustacea
Amphipoda 0.55 4.35 0.14 0.03 – – – – 3.53 6.67 1.33 0.32
Isopoda 19.74 60.87 16.53 22.07 17.89 28.57 5.24 6.61 18.82 33.33 6.87 8.56
Annelida
prey categories. The most common prey was Orthoptera (53.33%) had the most frequency of occurrence, and followed by Isopoda (33.33%), Oligochaeta (16.77%), Araneae (16.77%), larval Lepidoptera and adult Coleoptera, with 13.33% frequency of occurrence each. Items consumed by the Ricefield Frog in-cluded Orthoptera (31.76%), Isopoda (18.82%), Araneae (8.24%), Coleoptera-adults (7.06%), Lepidoptera-larvae (7.06%), and Oligochaeta (5.88%). Similarly, according to the IRI (Tab. I), Orthoptera (40.94%) were the most important items in the diet. Isopoda (8.56%) were the second most important item, followed Oligochaeta by (5.18%), Araneae (2.09%), and larval Lepidopterans (1.78%).
Food niche breadth and overlap
The Asiatic toads presented the largest niche breadth (BA = 0.277), followed by Ricefield Frogs (BA = 0.269) and Guenther’s Frogs (BA = 0.177). Among the three anurans, the Guenther’s Frogs and the Ricefield Frogs presented the highest food over-lap indices (Tab. II), followed by the Asiatic toads and the Guenther’s Frogs.
abundant by Asiatic toad, while Guenther’s Frog and the Ricefield Frog ingested only Orthoptera. The two frog species demonstrated a narrower food spectrum, especially Guenther’s Frog, with only nine orders consumed.
Considering the type and proportion of prey in the diet, Asiatic toads could be considered generalists with a foraging strategy that could be classified as intermediate along the ex-tremes of sit-and-wait and actively foraging. This species also selected adult Coleoptera, and for that, the predator would change from sit-and-wait behavior to actively foraging. The typical sit-and-wait predator has a low metabolic rate, the en-counter rate with the active prey is low, niche breadth is wide, and the sensory mode is visual to locate prey items (PERRY & PIANKA 1997). Most foraging strategy reviews have emphasized that active foragers search for their prey (BELL 1991, OWEN 1980). At night, we observed that toads left their shelters and moved to feeding sites. Then, the toads can act as a sit-and-wait preda-tor. Therefore, the feeding behavior of the Asiatic toad is vari-able because this animal is common in three microhabitats, where prey diversity is greater.
From the morphological features of the two frog species, and the type and number of prey consumed, Guenther’s Frog and Ricefield frog would be classified nearer to the extreme of active foraging. Guenther’s frog, however, consumed larger prey and has a robust body with a large mouth. The difference in body size observed between the two species seems to explain the difference in prey volume. The proportionately higher num-ber of crickets in the two species diets resulted in fewer prey categories and in a narrower niche breadth than toads. It seems that these two species could not feed some mephitic (e.g., diplo-pod, Dermaptera), or difficultly digesting prey (e.g., snail), though these small arthropods or molluscs are available in large
num-Table II. Morisita-Horn’s food niche overlap (CH) (below the
diagonal) found for Bufogargarizans, Ranaguentheri and Rana
limnocharis in Southwest China, calculated from the 20 food items identified in the stomachs of the three species.
B. gargarizans R. guentheri R. limnocharis
B. gargarizans 1.000 0.526 0.521
R. guentheri 0.526 1.000 0.942
R. limnocharis 0.521 0.942 1.000
Habitat use
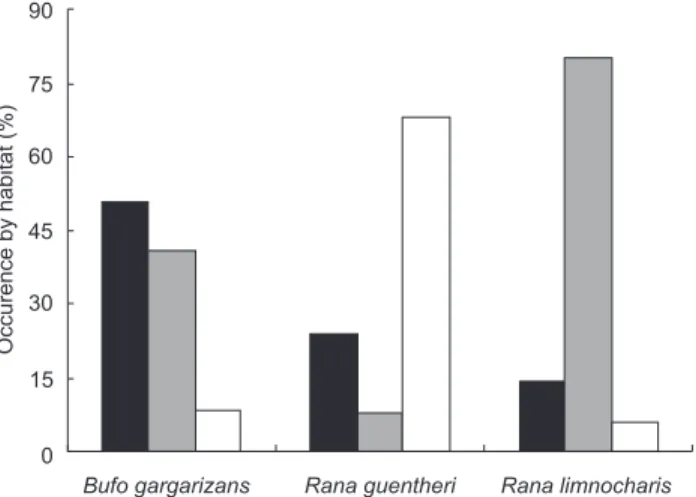
We found 109 distinct sites for toad and frog availability based on capture locations of the three species. Habitat use showed significant differences among the three anurans (Chi-square test: 2 = 59.92, df = 4, p < 0.001; Fig. 1). The results showed Asiatic toads preferred to select small roads or bare surface close to shrubs or pre-harvest corn (2 = 14.74, p = 0.001), while Guenther’s frogs preferred to select bare surfaces or short grass at habitat edges (2 = 14.48, p = 0.001). For Ricefield frogs, they selected bare surfaces or short grass as feeding sites in the middle of habitat (2 = 34.67, p < 0.001), and utilized some harvested plants as shelters during the day.
DISCUSSION
The Asiatic toad, Guenther’s frog and Ricefield frog are morphologically very different species, but they temporally occur in sympatry in some sites before hibernation (Yu per-sonal observations). Owing to differences in body size, their diet were significant different among three species. The con-sumption of adult Coleoptera, Isopoda, and Hymenoptera was
Figure 1. Habitat use (%) by Bufo gargarizans, Rana guentheri, and
bers. However, the SVL of toads is,larger, but they consumed prey that is small and medium size. The proportionately high number of ants in the diet of the Asiatic toad, even though they formed the lower volume, could be a result of the abundance of these insects in the sampled area. Many authors classify Bu-fonidae as ant-specialists based on large toads with thick skin that probably makes them more resistant to ant bites and stings (TOFT 1980, FLOWERS & GRAVES 1995, ISACCH & BARG 2002). We hy-pothesize that for Asiatic toads the selection of this prey type would be profitable owing to the cost-benefit ratio, or the large amount and easy capture in the field, though they would need to consume large quantities of ants to obtain sufficient energy. Our results showed that the trophic niche of the two frog species was significantly overlapping (CH = 0.942), which indi-cated a similarity between the diets. It is possible that high overlap implies the potential for strong competition that has not yet led to divergence in resource use (CONNELL 1980, SALE 1974). Guenther’s frog migrates to the feeding site, and lives with both Ricefield frogs and Asiatic toads before hibernation. Moreover, they use different microhabitats, so we suggest that competitive interactions between the two frog species are in-frequent. For toads and the two frog species, trophic niche overlap was low, and the differences in prey volume would favor the coexistence of three temporary congregated species in an effective way.
ACKNOWLEDGMENTS
We are grateful to W.H. Qi and Y.L. Han for their field assistance, especially to my wife. We would also like to thank D. Pike’s comments and revision on the manuscript. Our study was conducted with the permission of the Nanchong of Wildlife.
LITERATURE CITED
ANDREW, S. & B. CHRISTENSEN. 2001. Optimal diet theory: when does it work, and when and why does it fail? Animal Behavior 61: 379-390.
BELL, W.J. 1991.Searching behaviour. The behavioural ecology of finding resources. New York, Chapman and Hall. BOWKER, R.G.; M.H. BOWKER. 1979. Abundance and distribution
of anurans in a Kenyan Pond. Copeia 1979: 278-285. COLLI, G.R. & D.S. ZAMBONI. 1999. Ecology of the worm-lizard
Amphisbaena alba in the cerrado of central Brazil. Copeia 3: 733-742.
CONNELL, J.H. 1980. Diversity and the coevolution of competitors, or the ghost of competition past. Oikos 35: 131-138. DONNELLY, M.A. & C. GUYER. 1994. Patterns of reproduction and
habitat use in an assemblage of Neotropical hylid frogs. Oecologia 98: 291-302.
DIAZ, N.F. & J. VALENCIA. 1985. Microhabitat utilization by two leptodactylid frogs in the Andes of central Chile. Oecologia 66: 353-357.
DURÉ, M. I. & A. KEHR. 2001. Differential exploitation of trophic resources by two pseudid frog from Corrientes, Argentina. Journal of Herpetology 35: 340-343.
DURÉ, M.I. & A. KEHR. 2004. Influence of microhabitat on the trophic ecology of two Leptodactylids from Northeastern Argentina. Herpetologica 60: 295-303.
FEI, L. 2000. Atlas of amphibians of China. Luoyang, Henan University of Science and Technology Press.
FLOWERS, M.A. & B.M. GRAVES. 1995. Prey selectivity and size specific diet changes in Bufo cognatus and Bufo woodhousii
during early post metamorphic ontogeny. Journal of Herpetology 29: 608-612.
HORN, H.S. 1966. Measurement of overlap in comparative ecological studies. The American Naturalist 100: 419-424. ISACCH, J.P. & M. BARG. 2002. Are bufonid toads specialized antfeeders? A case test from the Argentinian flooding pampa. Journal of Natural History 36: 2005-2012.
LEGLER J.M. & L.J. SULLIVAN. 1979. The application of stomach-flushing to lizards and anurans. Herpetologica 35: 107-110. LEVINS, R. 1968. Evolution in changing environments: some theoretical explorations. Princeton, Princeton University Press, 132p.
LIZANA, M.; V. PEREZ-MELLADO & M.J. CIUDAD. 1990. Analysis of the structure of an amphibian community in the central system of Spain. Herpetological Journal 1: 435-446. MENIN, M.; D.C. ROSSA-FERES & A.A. GIARETTA. 2005. Resource use
and coexistence of two syntopic hylid frogs (Anura, Hylidae). Revista Brasileira de Zoologia 22: 61-72.
OLDHAM, R.S. & H.C. GERHARDT. 1975. Behavioral isolating mechanisms of the treefrog Hyla cinerea and H. gratiosa. Copeia 1975: 223-231.
OWEN, J. 1980. Feeding strategy. Chicago, University of Chicago Press.
PIANKA, E.R. 1975. Niche relations of desert lizards, p. 292-314.
In: M. CODY & J.M. DIAMOND (Eds). Ecology and evolution of communities. Cambridge, Harvard University Press. PIANKA, L.; M.S. OLIPHANT & Z.L. IVERSON. 1971. Food habits of albacore
bluefin, tuna and bonito in California waters. California Department of Fish and Game Bulletin 152: 1-350. PERRYA, G. & E.R. PIANKA. 1997. Animal foraging: past, present
and future. Trends in Ecology & Evolution 12: 360-364. SABAGH, L.T. & A.M.P.T. CARVALHO-E-SILVA. 2008 Feeding overlap in two
sympatric species of Rhinella (Anura: Bufonidae) of the Atlantic Rain Forest. Revista Brasileira de Zoologia 25: 247-253. Sale, P.F. 1974. Overlap in resource use, and interspecific
compe-tition. Oecologia 17: 245-256.
TOFT, C.A. 1980. Feeding ecology of thirteen syntopic species of anurans in a seasonal tropical environment. Oecologia 45: 131-141.