Size Distribution Imaging by Non-Uniform
Oscillating-Gradient Spin Echo (NOGSE) MRI
Noam Shemesh¤, Gonzalo A. Álvarez, Lucio Frydman*
Department of Chemical Physics, Weizmann Institute of Science, Rehovot, 76100, Israel
¤ Current Address: Champalimaud Neuroscience Programme, Champalimaud Centre for the Unknown, Lisbon, 1400–138, Portugal
Abstract
Objects making up complex porous systems in Nature usually span a range of sizes. These size distributions play fundamental roles in defining the physicochemical, biophysical and physiological properties of a wide variety of systems–ranging from advanced catalytic materials to Central Nervous System diseases. Accurate and noninvasive measurements of size distributions in opaque, three-dimensional objects, have thus remained long-stand-ing and important challenges. Herein we describe how a recently introduced diffusion-based magnetic resonance methodology, Non-Uniform-Oscillating-Gradient-Spin-Echo (NOGSE), can determine such distributions noninvasively. The method relies on its ability to probe confining lengths with a (length)6parametric sensitivity, in a constant-time,
con-stant-number-of-gradients fashion; combined, these attributes provide sufficient sensitivity for characterizing the underlying distributions inμm-scaled cellular systems. Theoretical
derivations and simulations are presented to verify NOGSE’s ability to faithfully reconstruct size distributions through suitable modeling of their distribution parameters. Experiments in yeast cell suspensions–where the ground truth can be determined from ancillary micros-copy–corroborate these trends experimentally. Finally, by appending to the NOGSE proto-col an imaging acquisition, novel MRI maps of cellular size distributions were proto-collected from a mouse brain. The ensuing micro-architectural contrasts successfully delineated dis-tinctive hallmark anatomical sub-structures, in both white matter and gray matter tissues, in a non-invasive manner. Such findings highlight NOGSE’s potential for characterizing aber-rations in cellular size distributions upon disease, or during normal processes such as development.
Introduction
Cellular morphologies are intimately linked with biological functions in general, and with a tis-sue’s capacity to perform its physiological rolein-vivoin particular. Cell sizes can determine, inter-alia, the Central-Nervous-System (CNS) axonal conduction velocities [1], and the effi-ciency of oxygen transport by red-blood cells [2]. When viewed as an ensemble, cellular sizes OPEN ACCESS
Citation:Shemesh N, Álvarez GA, Frydman L (2015) Size Distribution Imaging by Non-Uniform Oscillating-Gradient Spin Echo (NOGSE) MRI. PLoS ONE 10(7): e0133201. doi:10.1371/journal.pone.0133201
Editor:Ichio Aoki, National Institute of Radiological Sciences, JAPAN
Received:November 25, 2014
Accepted:June 24, 2015
Published:July 21, 2015
Copyright:© 2015 Shemesh et al. This is an open access article distributed under the terms of the
Creative Commons Attribution License, which permits unrestricted use, distribution, and reproduction in any medium, provided the original author and source are credited.
Data Availability Statement:All relevant data are within the paper and its Supporting Information files.
are nearly invariably dispersed across a distribution, whose profile is tightly regulated by elabo-rate mechanisms aiming to maintain the optimal cellular dimensions for a proper physiological function [3]. In mammalian brains, for instance, distinct cortical regions evolved slight–but functionally crucial [4]–variations in their neuronal size distributions, which enable the execu-tion of different kinds of neural computaexecu-tions [5]. Furthermore, even slight aberraexecu-tions in axo-nal sizes have been found related to severe neurological disorders [6–8]. Most evidence about the mutual dependencies between such physiological processes and underlying size-dependent distributions, arises fromex-vivohistological studies. Clearly, having the capability to image cellular size distributions non-invasively and underin-vivoconditions, could be crucial for understanding the subtle but important connections between morphological features and nor-mal processes like maturation [9] or plasticity [10], as well as for predicting and understanding the nature of CNS diseases [11].
Owing to its noninvasiveness and multi-modal contrasts, Magnetic Resonance Imaging (MRI) has evolved into a central technique forin-vivoinvestigations of bulk structural, func-tional and metabolic aspects of the CNS [12]. Diffusion-based MRI in particular, has been used to shed light on structures whose dimensions are orders-of-magnitude smaller than the imaged voxel sizes [13,14]. This is made possible by detecting restricted micron-scale Brownian motions undergone by endogenous water molecules, diffusing within the tissue’s micro-archi-tecture. Such restriction-related phenomena have proven instrumental in the early diagnosis of ischemia [15], as well as for mapping white matter (WM) connectivity [13]. MRI methods for the robust mapping ofin-vivosize distributions, however, remain elusive. So-calledq-space imaging [16,17] can generate exquisite contrasts reflecting regional average axonal diameters [18]. Still, quantifying key parameters of such size distributions (e.g., their mode, peak and width) remains subject to elaborate assumptions on the nature of the tissues involved, while requiring the application of extremely strong gradients for probing small compartment dimen-sions [19–21]. Related microstructure-probing methods have also been put forward [22–24], but these likewise require complex analyses for parameterizing the distributions, while also requiring the application of very strong gradients [25]. These difficulties reflectq-space’s lim-ited parametric sensitivity towards the average lengthlcdefining the confinement, which in
these approaches varies asl2
c. An alternative approach enhancing MRI’s sensitivity towards small compartment sizes relies on utilizing oscillating gradient waveforms [26–30]. In particu-lar, thel4
c parametric sensitivity of Oscillating-Gradient Spin-Echo (OGSE) MRI towards the confinement lengths by determining a diffusion spectrum, enables one to probe small elements in the size distribution by suitably tailoring the gradient’s waveform [29,31,32].
The OGSE approach is designed to scan a diffusion spectrum, and from its width one can extract the restriction lengthlc[30]. Alternatively, if the functional form of the diffusion
spec-trum is known, one could design an OGSE-like sequence to directly extract the restriction length. This study explores the potential for mapping subtle features of compartment size dis-tributions in this manner, using a recently introduced methodology that probes confining lengths with al6
cparametric sensitivity [33,34]. At the core of our approach lies a Selective-Dynamical-Recoupling (SDR) variant known as Non-uniform-Oscillating-Gradient Spin-Echo (NOGSE), which in previous studies was shown to accurately extract monodisperse or average pore sizes in a constant-time, constant-number-of-gradients fashion [35]. The constant-time, constant-number-of-gradients features of this family of sequences allows one to factor out T2
and gradient-switching related weightings from the signal. The present study investigates how this microstructurall6
c parametric sensitivity can be further exploited to probe the parameters of cell-scale size distributions in the 1–10μm range. To this effect we discussfirst the method’s principles, including simulations demonstrating NOGSE’s ability to report on size
distributions. The methodology is then validated in yeast cells suspensions, where excellent matching is obtained against a ground-truth stemming from optical microscopy. Finally, NOGSE is combined with MRI measurements to map the salient features of size distributions in mouse brains. These measurements clearly reveal hallmark microstructural features of the CNS, in both white and gray matter tissues. The prospects of exploiting the ensuing size distri-bution contrasts for correlating betweenμm-size morphologies and CNS maturation and dis-orders in human-oriented settings, are discussed.
Theoretical Background: Size Distributions from NOGSE
Measurements
SDR is a recently-developed methodology [33] which utilizes dynamical decoupling concepts [36] to characterize frequency fluctuations in a constant-time fashion, via non-equidistant multipleπ-pulse echo trains. When used to monitor diffusion-driven fluctuations, SDR offers a simple way for quantifying confinements with al6
c parametric sensitivity by microscopically characterizing the diffusion process, rather than byfitting apparent-diffusion weightings/ decays [34]. This is performed by systematically changing a single time-delay variable in a con-stant time fashion and with afixed number of refocusingπ-pulses, which provides robustness against progressive T2decay and cumulative refocusing pulse errors, respectively. In the
con-text of compartment size estimations, the opportunity arises of replacing SDR’s multi-pulse echo trains by a gradient waveform modulation [34,35]. The resulting Non-uniform-Oscillat-ing-Gradient-Spin-Echo (NOGSE) methodology involves(N-1)gradient oscillations akin to those in a Carr-Purcell-Meiboom-Gill (CPMG) like modulation characterized by a variable time x[37], followed by a single Hahn-echo-like oscillation of periodysuch that (N−1)x+y TNOGSE–whereTNOGSEis a constant (Fig 1A). The diffusion-weighted signal attenuationE
(TNOGSE) arising from a spin ensemble within a single compartment that is dephased by this
oscillating gradient waveformG(t), can be described asMNOGSE(TNOGSE) = exp{−β(TNOGSE)}.
Here the attenuation factorbðTNOGSEÞ ¼1 2
R1
1jFðo;TNOGSEÞj
2
SðoÞdo[30,30,34,35,37], where S(ω)is a spectral density given by the Fourier Transform (FT) of the spins’displacement
cor-relation functiongðtÞ= ffiffiffiffiffiffi
2p p
¼ hrð0ÞrðtÞi=p2ffiffiffiffiffiffip;andF(ω,TNOGSE) is afilter function given by
the FT of the gradient modulation ffiffiffiffiffiffi
2p p
gGðtÞ. Under typical restricted diffusion conditions the
spectral density will be given bySðoÞ ¼ D0t2
c ð1þo2t2
cÞp[34], where
τcis the time required for most
molecules to fully probe the pore boundaries [34,38,39].τcis therefore related to the confining
length scalelcby the Einstein-Smoluchowski expressionl
2
c ¼2D0tc;whereD0is the free
diffu-sion coefficient. For more complex geometries the displacement power spectrumS(ω) can be
written as a sum of Lorentzian terms [35,39]; however, given that for typical geometries (cylin-der, spheres, planar layers) the contribution from the second term in these series expansions is lower than 2% [39], we shall for simplicity ignore all but the dominant term in this study.
NOGSE’s ability to probe confinements aslc6, derives from the signal amplitude modulation
that it exhibits as a function of the delayx. This modulation will vary between values corre-sponding to a purex= 0 Hahn-echo oscillation,MNOGSE(TNOGSE,N,x= 0) =MHahn(TNOGSE),
and values arising from a CPMG gradient oscillation wherex=TNOGSE/N:MNOGSE(TNOGSE,N,
x=TNOGSE/N) =MCPMG(TNOGSE,N). The difference between these two limiting values
repre-sents NOGSE’s amplitude modulation,ΔMNOGSE=MCPMG(TNOGSE,N)−MHahn(TNOGSE)/
exp[−ΔβNOGSE(TNOGSE,N)]−1, whose value can then be monitored as a function ofx. If
TNOGSE/N>>τc,i.e. if the diffusing spins experience a restriction imposed by a confining
topol-ogy, the CPMG-related attenuation factorbCPMGðTNOGSE;NÞ g 2
G2
D0t2
c½TNOGSE ð2Nþ1Þtc [34]. This includes a dominant term/t2
plus a correction proportional tot3 c /l
6
c:The Hahn-related attenuation factor (N= 1) under similar conditions is given bybHahnðTNOGSE;NÞ g
2
G2
D0t2
c½TNOGSE 3tc. By combining these two elements in a single pulse sequence, NOGSE delivers a modulation depending on the
dif-ferencebetween these attenuation factors:DbrestrictedNOGSE ðTNOGSE;NÞ ¼
1 4D2
0 ðgGÞ 2
ðN 1Þl6 c. This explains the experiment’slc6dependence on restriction lengths, which is different from
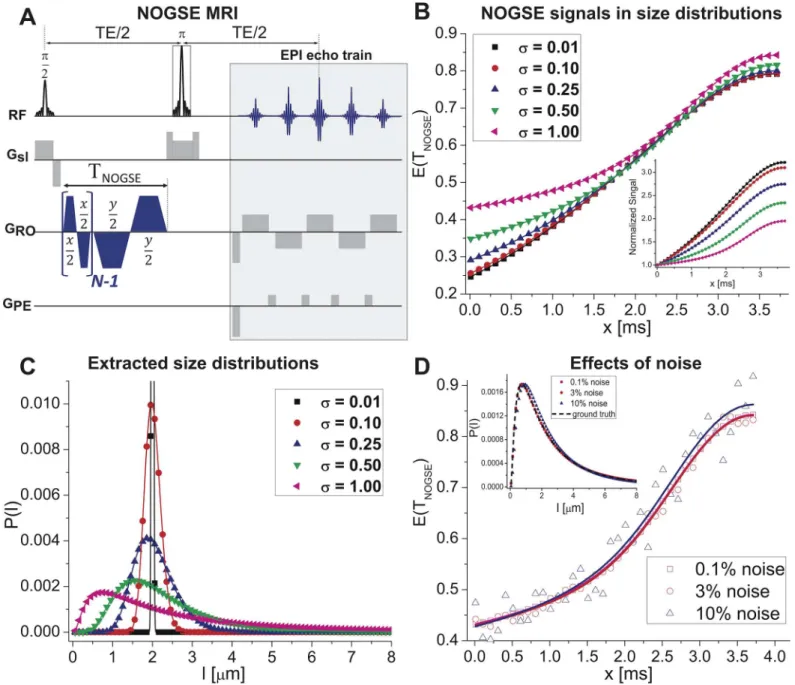
Fig 1. Characterizing size distributions from NOGSE data. (A)NOGSE MRI sequence used, encompassing an initial block probing the confinements over a time TNOGSE, and a single-shot spin-echo Echo-Planar-Imaging readout (NOGSE gradients are shown along the RO direction, but can be applied in
arbitrary orientations).(B)xtime-dependence of the NOGSE signal attenuationE(TNOGSE)for different size distributions. Note that as the lognormal
distribution width increases theE(TNOGSE)changes both in curvature and in overall amplitude; the inset highlights this by normalizing the curves to their first
point (Min(x)).(C)Probability distributionsP(l)extracted from fitting the simulations in (B) for a given restricting lengthlin a noise-less reconstruction. The extracted distributions overlap perfectly with the simulated ones.(D)Effects of adding noise to the NOGSE signal for the widest distribution considered in (C): notice that even when fluctuations reach 10% of the signal, the fits remain robust and the distributions are well reconstructed (inset). Throughout this Fig symbols represent the synthetic data whereas solid curves represent fits to these data. For all distributionslc= 2μm,G= 40 G/cm,N= 8,TNOGSE= 30ms.
eitherq-space’s quadratic or OGSE’s quartic conventional dependencies. Notice that whereas OGSE experiments are mostly analyzed in the frequency domain in order to discriminate the transition from free to restricted diffusion regimes [27,28,30], NOGSE is performed and ana-lyzed in the time domain as a function of the aforementionedxparameter. This reveals the transition between free and restricted diffusion regimes as an amplitude modulation, mimick-ing the time evolution of the mean square root displacement of the diffusmimick-ing spins [34,35]. By virtue of the sixth-power law of NOGSE’s amplitude modulation, one could envision a subset of experimental conditions and substrates (μm sizes, suitable relaxation delays, moderate gradi-ents) whereby NOGSE could have a good ability to distinguish different restriction lengths; examining whether this potential translates into a useful new tool to characterize size distribu-tions, is the main goal of this work.
To do so we assume that the NMR signal in most porous system can be considered as arising from an ensemble of compartments with potentially different sizesl. The total signal modula-tion in these experiments will thus be given bySNOGSE(x) =∑lP(l)MNOGSEl(x), whereP(l) is the
compartment size’s probability distribution characterizing the ensemble, andMNOGSE(x) is as
described above. As a model for the compartment size’s distribution we chose a lognormal
dis-tribution of the formPðlÞ ¼ 1 llnðsÞpffiffiffiffi2pe
ðlnðlÞ lnðlcÞÞ2 2lnðsÞ2
, wherelcis the mean compartment size andσis
the width of the probability distribution about its mean. Although a different distribution could be clearly chosen, we preferred this specific distribution as it often describes well CNS-type systems [40,41]; as further illustrated below, experimental results were consistent with this model. Notice as well that given the assumed functional forS(ω), the pores being characterized
are considered completely hermetic and described by an average restriction length. Therefore, certain effects such as incomplete restrictions, exchange between compartments or permeabil-ity cases, will not be optimally described by our model. These effects will still be accounted for, either by a larger effective pore size, or by a change in the distribution of ensemble sizes. To account for such complexities in a more accurate fashion, further refinements of the Lorentzian S(ω) model would be necessary.
Before describing the results of these tests it is worth stressing that, if a given signal decay could be unambiguously traced to the effects of diffusion during the application of a per-fectly characterized gradient waveform modulation, thenlccould be probed with similar
parametric sensitivities using suitable Hahn-based, or CPMG/OGSE-based sequences. In such cases, however, this would require comparing signals arising from measurements that involve different total evolution times or different number of gradient oscillations; under such conditions, T2as well as oscillating gradient waveform imperfections (or cross-terms
with background gradients) might introduce attenuation artifacts that could eclipse the pure diffusion signal attenuation. Hence the potential of NOGSE for probing constrained diffu-sion could be summarized as stemming from: i) the fact that in a favorableTNOGSE/N>>τc
regime NOGSE’s amplitude modulation will vary asl6
c, a parametric dependence which might be desirable for microstructural characterizations, and ii) NOGSEl6
c modulations are retrieved from a single constant-time, constant-number-of-gradient-modulation sequence, rendering these measurements independent of T2and of gradient-switching related artifacts.
Materials and Methods
Simulations
All simulations were performed using Matlab (Mathworks, Natick, MA, USA). The full analyti-cal expressions expected for NOGSE signals in homogeneously confined geometries were recently derived [34,35]. To extend these NOGSE responses to a given distribution of confine-ments, an array of individual NOGSE signalsMlNOGSE(x) arising from 1989 compartment
sizeslequidistantly dispersed between 0.056 and 10μm was first simulated. An intrinsic dif-fusion coefficient ofD0=0.7x10⁻⁵cm2/sec was used for generation of these signals, which
were subsequently weighted by their fraction in the lognormal distribution, and summed as SNOGSE(x) =∑lP(l)MlNOGSE(x). Additional specific parameters for the simulations are given in
the figure captions.
Specimen preparation
All experiments were approved by the Institutional Animal Care and Use Committee of the Weizmann Institute of Science under protocol number 10790514–1. Freshsaccharomyces
cere-visiaeBaker’s yeast cells were dissolved in PBS in a 10 mm NMR tube, and left for ~72 hours
prior to their MR investigation. Two mice were sacrificed by isoflurane overdose and their brains were fixed in formaline, and washed twice with PBS prior to their insertion to a 10 mm NMR tube filled with Fluorinert (Sigma-Aldrich, Rehovot, Israel). All specimens were left in the magnet for at least three hours prior to experiment commencement, to thermally equilibrate.
MRI experiments
Experiments were performed on a 9.4 T Bruker Avance III equipped with a Micro5 probe capable of producing gradients up to 291 G/cm in all three dimensions. Temperatures were stabilized in the 20–25°C range, and experiments were performed using the NOGSE MRI sequence shown inFig 1A. For the yeast cells, the following imaging parameters were used:
TR/TE= 4000 / 64 ms, Field of View FOV = 19 x 19 mm2with a matrix size of 64x64, leading
to an in-plane resolution of 296x296 (μm)2, and slice thickness = 3000μm and 48 signal averages (total experiment time, ~1.5 hours for the entire curve). NOGSE parameters were G= 87 G/cm,TNOGSE= 30 ms,N= 8, andxwas varied between 1 and 3.75ms in 29 steps.
The mouse brain imaging parameters were as follows: for the sagittal orientation,TR/TE= 4000 / 100 ms, FOV = 13 x 13 mm2with a matrix size of 144x144, leading to an in-plane reso-lution of 90x90 (μm)2, and slice thickness = 400μm and 160 signal averages; for the coronal orientation,TR/TE= 4000 / 91 ms, FOV = 16 x 12 mm2with a matrix size of 192x144, leading to an in-plane resolution of 83x83 (μm)2, and slice thickness = 600μm and 160 signal averages (total experiment time ~5.5 hours for the entire curve). NOGSE parameters for both coronal and sagittal planes wereG= 57.6 G/cm,TNOGSE= 30 ms,N= 8, andxvaried between 0.8 and
3.75 ms in 31 steps. In the corpus callosum experiments, the NOGSE gradients were applied perpendicular to the main axis of the axons; in the coronal experiments, NOGSE experiments were applied in the R-L direction.
Data analysis
presence of distributions assuming a uniformD0of 0.7x10⁻⁵cm2/sec and 1.0x10⁻⁵cm2/sec in
the brains and yeast cells, respectively. The size distributions were fitted by first generating NOGSE signals for an array of restricting lengths ranging between 0.056 and 10μm, in equidis-tant 0.005μm steps. The experimental data was then regressed onto these curves. To avoid local minima, each search began with 18 combinations of different mean and width distribu-tions, and complex-valued solutions were excluded. The best fit was then selected and its distri-butions parameters were stored. No assumptions on tissue models (e.g., intra/extra-cellular compartments) were made; a single lognormal distribution was thus fitted for each fitted ele-ment, regardless of the element’s potential heterogeneity. This implicitly means that the con-strained diffusion signal contributions arising from all underlying compartments (e.g., extracellular, intracellular, etc.), are assumed described by a single lognormal distribution weighting. The yeast cells geometry was assumed to be spherical (as was validated by the microscopy results shown inFig 2B), such that the lognormal distribution described spheres rather than one dimensional objects. A correction factor of 1/0.3 was thus applied to the distri-bution mean, to account for this spherical compartment shape [30,35]. In the brains, we did not assume any particular geometry, and simply considered a distribution of correlation lengthslc.
Yeast Cells Microscopy
A sample of the yeast cells was taken directly from the NMR tube and imaged via a DeltaVision system consisting of an Olympus IX71 wide-field inverted fluorescence microscope, an Olym-pus UPlanApo 63x and a NA 1.40 oil immersion objective (Applied Precision, Seattle, WA, USA). Thirty images containing thousands of yeast cells were subsequently imported in Ima-geJ, and their Feret diameter (i.e., the longest distance within the oval shape) was automatically
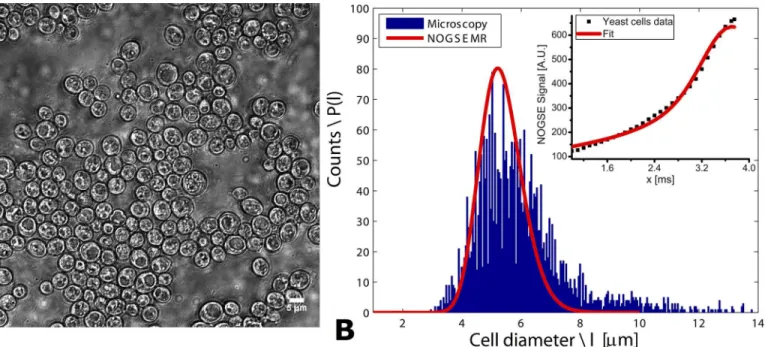
Fig 2. Validating NOGSE’s size distribution predictions in yeast cells. (A)A representative image of the examined yeast ensemble; note that objects larger than ~8μm are not observed in these images, suggesting that the wide right shoulder of the microscopy-derived distribution in (B) arises from
unresolved, adjacent cells.(B)Size distribution reconstructed from a NOGSE experiment on the yeast ensemble (red curve, with symbols in the inset presenting the experimental data and the solid line their best fit), overlaid on the cellular size distribution obtained from optical microscopy (bin size = ~ 0.05μm).
NOGSE parameters:TNOGSE= 30 ms,G= 87.3 G/cm,N= 8.D0was assumed 1x10⁻⁵cm2/sec, as this gave the best fits to the data.
quantified. Objects smaller than 2μm were misidentified by the software recognition algorithm and were hence discarded from the analysis.
Results
Validating NOGSE
’
s ability to extract size distributions
As a test of NOGSE’s ability to extract simple parameters to characterize size distributions–
including their mean, peak and widths–signals were first simulated for five lognormal distribu-tionsP(l)distributed around a biologically-relevant size oflc= 2μm, and possessing different
distribution widthsσ(Fig 1B; seeMaterials and Methodsfor details). Clearly, even small
dif-ferencesσ0.1.l
cimprint a marked dependence on the amplitude modulations and on the
cur-vatures of the NOGSE signals (inset,Fig 1B). Excellent correspondence was observed when synthetic NOGSE data are given as input, and the originating size distributions are recovered by fitting (Fig 1C). Moreover, although it might be expected that the presence of noise in realis-tic biological data would influence these fittings, even adding 10% fluctuations (a value that is much higher than the typical noise levels present in typical experiments) yields only marginal variations in the extracted size distributions: all the general features of the distribution includ-ing mean, peak and width values, are still captured (Fig 1D, inset). Furthermore, such features are not limited to the particular length we have chosen; supplementaryS1 Figshows further analyses for smaller and larger sizes revealing that, in each case, fits of the NOGSE experiment recapitulate well the underlying size distributions.
With these simulations as background, size distributions were experimentally quantified in a biological system whose ground-truth was determined by an independent modality. Yeast cells were chosen due to their simple spherical geometry, and the NOGSE MRI characterization was checked against a large number (thousands) of cells whose sizes were quantifiedex vivoby optical microscopy. Results of these measurements are shown inFig 2;Fig 2Bin particular compares the size distributions extracted by fitting experimental NOGSE data (inset), against the cell size histogram obtained by light microscopy. The two size distributions closely resem-ble one another and peak at the same cell diameter of ~5.8μm; this value is in close agreement with the average yeast cell size measured via a different diffusion MR methodology [42]. Importantly, not only the maxima but also the widths of the two distributions overlap signifi-cantly. Notice that although the microscopy suggests a broadening of the distribution biased towards larger cell sizes, closer inspection of the yeast cells’images (Fig 2A) evidences that almost no cell is actually larger than 8μm. The microscopy’s high-lctail therefore likely results
from artifacts in the image recognition algorithm, and reflects adjacent cells that were not suffi-ciently resolved in the image to be recognized as separate entities. Minor deviations can also suggest that a different distribution model could be appropriate for characterizing this speci-men; in particular, consideration of different models for the intra- and extra-cell signals contri-butions could perhaps enhance these fits even further. Additional effects due that were not considered in our model–for instance spin exchanges between intra- and extra-cellular com-partments–could also contribute to these deviations.
Mapping cellular size distributions: Non-invasive NOGSE-based brain
characterizations
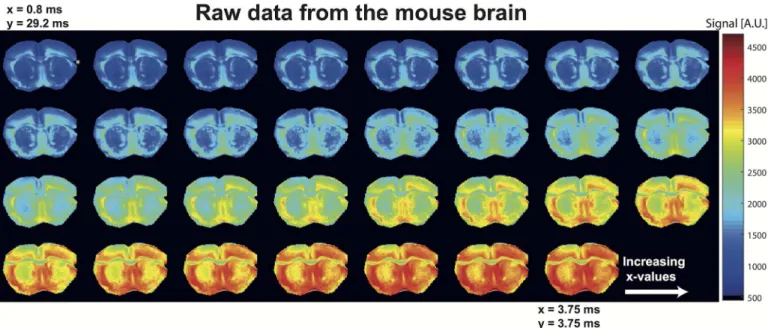
potential structural correlations with CNS diseases [7]. NOGSE MRI signals were therefore col-lected and examined; raw data arising from these experiments are presented inFig 3for the corpus callosum–a prominent white matter structure–and clearly show the expected signal increase with increasingx-values.
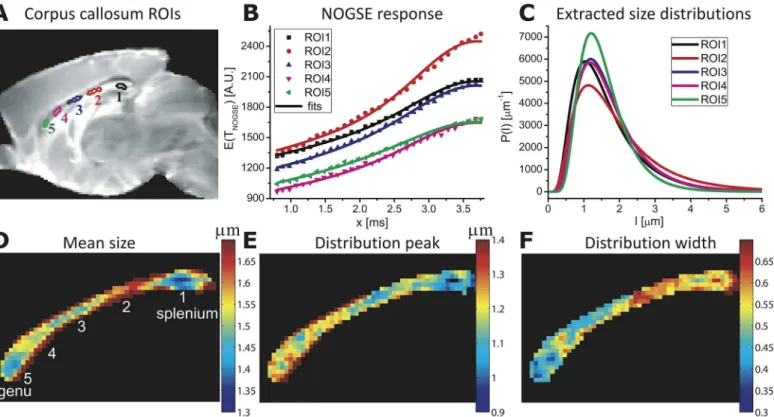
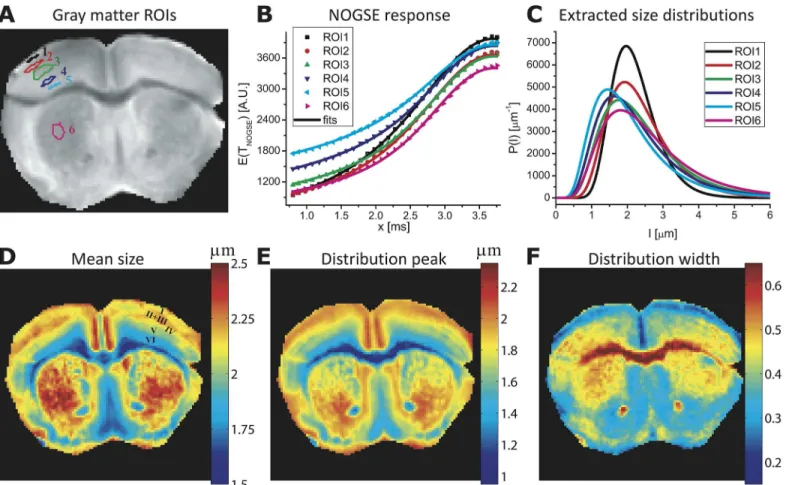
Fig 4analyzes the corpus callosum data in closer detail.Fig 4Bdisplays this structure’s NOGSE signals observed as a function ofxfor the five selected regions-of-interest (ROIs) defined in panel 4A, when the diffusion-sensitizing oscillating gradient is applied in a direction orthogonal to the main axis of the fibers (i.e., along the vertical axis for the displayed image planes). Each of these regions exhibits a slightly differentΔMNOGSEmodulation; fits of these
data to the size distributions’lognormal parameters (Fig 4B, solid lines) led to the lognormal curves inFig 4C, showing variations in the means, peaks and widths of the confinements for these various ROIs. The excellent agreement of the fitted curves with the experimental data is consistent with the lognormal-distribution assumption. Extending these analyses on a pixel-by-pixel fashion results in the compartment size maps shown inFig 4D–4F. The mean size and the distribution width maps in particular demonstrate significant contrasts between different corpus callosum anatomical regions, providing a microstructure-based tissue segmentation. For instance, although thegenuandspleniumregions of the corpus callosum exhibit similar mean sizes, the width of their distributions appears larger in the latter–consistent with human-based histological results [44]. Furthermore, the corpus callosum midsection exhibits larger compartment sizes distributed with a larger width. Overall these results suggest five morpho-logically distinct regions (Fig 4D), in good agreement with hallmark anatomical segmentations observed in end-point histological human studies [44,45]. These NOGSE-derived maps also resemble those in a recent study that employed pseudo-2D q-space MRI and pixel clustering, to portray size distributions in a rat’s corpus callosum [46]. Notice, however, that the quantita-tive results summarized inFig 4are obtained in a 1D fashion, and do not need to invoke clus-tering or other models of the tissue’s microstructure.
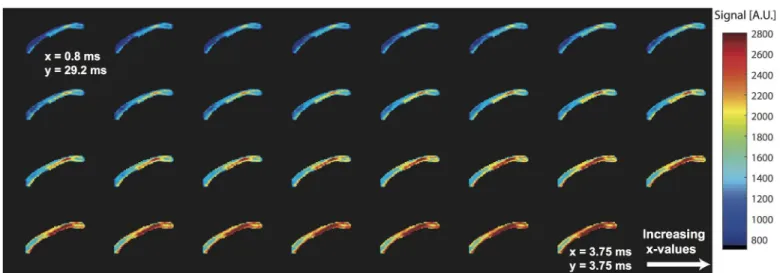
Fig 3. Raw NOGSE MRI data arising from sagittal images of a mouse brain, masked for the corpus callosum and plotted as a function of increasing x-values.Notice the clear increase in signal intensity with increasingx-values, as the weighting gradient transitions from a mostly long bipolar block to an OGSE-like sequence–while always retaining a constant-time fashion. Notice as well the different profiles evidenced by the various corpus callosum sub-sections. The diffusion gradients were along the phase-encoding direction,i.e. along the vertical axis of the image.
Due to their higher, more coherent cellular organizations, most microstructural diffusion MRI studies focus on white matter characterizations. Structural disorder at a cellular level has made studying microstructural features of gray matter (GM) much more challenging [47,48]. In view of this we sought to explore NOGSE’s size distribution contrast capabilities to identify GM’s most salient morphological feature: its cortical layering [49,50]. To this end a mouse brain was imaged along a coronal plane;Fig 5shows raw data arising from such experiments, demonstrating once again a well-behaved and characteristic NOGSE response for all pixels, both in the grey and the white matter. ROIs were selected from these data in different cortical gray matter prominent features including the cortical layers and deep gray matter of the stria-tum (Fig 6A). The ensuing NOGSE signals, shown inFig 6B, exhibit once again region-depen-dent responses. On comparing these with the responses inFig 4B, NOGSE’s amplitude modulations appear larger in GM than in WM counterparts. This reflects the typically larger mean cellular sizes that characterize GM over WM axon counterparts, as evidenced upon com-paring the distributions in Figs4Cand6C. Note again the excellent agreement between the fits and data inFig 6B, withσandl(besides the overall amplitude of the signal) as the only free
parameters to adjust; this consistency lends further support to the usefulness of the lognormal-distribution assumption. Pixel-by-pixel maps of the NOGSE-derived GM size lognormal-distributions are shown inFig 6D–6F, and point to several remarkable features. One concerns the markedly dif-ferent contrasts that the mean, the width and the peak of the size distributions yield in the cor-tical GM. The contrast afforded by the mean sizes of these distributions closely resembles Fig 4. Mapping histological size distributions in a mouse corpus callosum. (A)Definitions of the various ROIs placed in different anatomical regions, superimposed on a reference MRI image.(B)Ensuing curves (symbols) and best fits (solid lines) arising from a NOGSE MRI experiment.(C)Size
distributionsP(l)extracted from (B), under a D0= 0.7x10⁻⁵cm2/sec assumption.(D-F)Maps of the mean, the peak and the width values extracted from
pixel-by-pixel fits of the NOGSE response, highlighting the contrast between the corpus callosum different anatomical regions. NOGSE parameters:TNOGSE= 30
ms,N= 8,GNOGSE= 57.6 G/cm applied perpendicular to the main axis of the fibers in the corpus callosum (i.e., the vertical axis of the images). The extracted
values describe the correlation lengthslc. SeeMaterials and Methodsfor further parameters.
known features of the cortical layering. These layers, identified inFig 6Das I, II+III, IV, V and VI, have thicknesses of ~ 90, 450, 180, 360 and 450μm, respectively. These thicknesses are con-sistent with literature values for mice cortical brain layers [50]. Interestingly, the peak map exhibits a similar but not identical layering contrast: layers I, II and III appear to have similar distribution peaks (Fig 6E); layers are even further melded together in the distribution width map. This highlights the need for a sensitive technique capable of furnishing a full morphologi-cal characterization of size distributions, vis-à-vis other methods that may rely solely on one parameter (like the average compartment size) to deliver this information. It should be further noted that diffusion anisotropy effects–though typically quite small in gray matter [47]–would also need to be considered if proceeding with a further refinement of this model.
Discussion
This study sought to test the feasibility of extracting cellular-scale size distributions parame-ters–including means, peaks and widths–using a microstructural sequence that like NOGSE, exhibits al6
c dependence. Experiments show that such distributions can indeed be accurately characterized from simple curves involving a single variable and moderate gradient amplitudes. NOGSE’s robustness reflects the good contrast that small-sized structures like the ones targeted in this study endow it, a constant-time nature freeing it from T2-derived decays, and a constant
number of gradient switchings that reduce potential sources of error. We further note that although NOGSE’sl6
c term may exist in principle also in OGSE, it has insofar not been used and would require special precautions to unambiguously reveal it.
When coupled to MRI’s non-invasive mapping abilities, NOGSE’s contrast opens a wealth of vistas for thein vivocharacterization of tissue structures in general, and of the CNS in partic-ular. These types of“virtual histology”characterizations could depict aberrations in cellular morphologies in a range of pathologies including de- and dys-myelination of axons [51] and changes in neural densities and sizes [52]–information which is usually evidenced only upon Fig 5. Idem as inFig 3, but showing raw NOGSE MRI data from coronal images of a mouse brain.Different brain regions manifest different NOGSE signal increases with increasingx-values, even within the gray matter. These features allow for the microstructural segmentations shown in the main text. The asterisk in the top-leftmost image represents a tissue area damaged upon preparation.
post-mortem histological evaluations. Noninvasively tracking the longitudinal evolutions of such size-distribution contrasts in the CNS via NOGSE MRI experiments could also open new vistas in understanding, at a physiological level, the evolution of cognitive and behavioral activities.
At an analytical level it is worth stressing that although this study focused on lognormal dis-tributions, experimental findings do not have to fulfill this specific scattering to yield a mean-ingful insight. Ongoing studies are showing that NOGSE can also reveal other distributions, including multi-modal ones. Indeed, a strong point of the presented results is that the only
“model”that it needs to invoke is that spins diffuse with a uniform coefficientD0that disperses
their evolution phases according to the Gaussian Phase Approximation [53]. One might argue that the assumption of a uniformD0, particularly in the brain, may compromise our results;
however, whenD0was mapped via very rapid gradient oscillations and raw data like those
shown inFig 6were refitted point-by-point to account for pixel-specific diffusivities, no signifi-cant differences in the derived distributions could be observed. This robustness can be ascribed to NOGSE’s exponential contrast, which varies as the relevant lengths to the power of six but only asD 2
o : variations inD0will therefore shift slightly the absolute values of the extracted
dis-tributions, yet their intrinsic contrast will be preserved.
Fig 6. Mapping size distributions of a mouse’s gray matter. (A)ROI definitions of various GM regions.(B)NOGSE curves from these ROIs (symbols) along with the size distribution fittings in each ROI (solid lines). Note the stronger amplitude modulation in the gray matter compared with the WM shown in Fig 3.(C)Size distributions extracted from the data in (B).(D-F)Maps of mean sizes, peak values and distribution widths obtained by fitting the NOGSE data retrieved from a mouse brain, reflecting the correlation lengthslc. Cortical layering can be observed, and are marked with Roman numbers on the Mean size
map. NOGSE parameters:TNOGSE= 30 ms,G= 57.6 G/cm,N= 8; the gradient was oriented along the left-right axis of the image, andD0was assumed
0.7x10⁻⁵cm2/sec.
One may also wonder whether the Lorentzian approximation adopted here for the spectral density function, is an optimal one. Whereas this assumption is often adopted for completely hermetic pores [27,39], its validity may be compromised if restrictions are incomplete, in the presence of multi-compartment exchange processes, or if mixed diffusion modes are consid-ered. Moreover, the assumption of a lognormal distribution of pore sizes implies that each pore is independent, and as such it constrains the possible complexity of the entire system, whose pores could be interconnected leading to different types of diffusion processes. An alternative approach could have consisted of assuming a more complexS(ω) form, that includes these
effects. Still, given the very good agreement observed between experimental results and the simpler Lorentzian model, this research did not justify resorting to more complex spectral den-sity forms: data could be fitted well by suitable Lorentzian distribution parameters. Still, further theoretical, computational and experimental studies are needed to determine whether this dis-tribution is the most adequate characterization to describe spectral densities in more complex pore structures.
It should also be noted that thel6
c parametric-sensitivity is not an automatic guarantee of better size distribution characterizations. Indeed, in unfavorable instances, the applied gradi-ents may be too strong or the pores too big, leading to the erasing of contributions from larger structures and/or data that lack sufficient signal sensitivity. Still, in the context of CNS-relevant pores, one is often interested in the smaller (<10μm) dimensions, where NOGSE’slc6
-depen-dence should be beneficial for practical gradient values. Another point worth highlighting is that NOGSE experiments, at least as here performed, are not rotationally invariant; hence, the corpus callosum analyses require that the gradients be applied perpendicular to the main axis of thefiber. Nevertheless NOGSE experiments could be performed in alternative ways; and it would be interesting to explore whether some of these options could lead to rotationally invari-ant metrics. One should also notice that maximizing NOGSE’s contrast will come at the expense of prolonging the TE, an attribute that may bias NOGSE towards a tissue’s longer T2
species. Still, at preclinical and clinicalfields this limitation should not be too restricting. Fur-thermore, one could envision performing NOGSE MR Spectroscopy on CNS metabolites which have very long T2s, to endow the measurement with enhanced specificity towards intra /
extra cellular compartments. Double-NOGSE modes for probing the eccentricities of orienta-tionally-dispersed morphological distributions [47,54], can also be envisioned. Last but not least, the NOGSE waveforms could be split around the refocusing pulse, thereby garnering greater immunity towards sources of artifacts such as eddy currents, or internal susceptibility-induced gradients.
distributions effects are indeed observed. These microstructural findings bode well for future characterizations of size distributions in the contexts of health, function and disease. Further studies will be required to test the stability of these results among larger cohorts of brains, incorporating end-point histology to quantitatively correlate the NOGSE observations with axonal diameter distributions. Furthermore, following the overall framework given here, it would be interesting to test whether the contributions of different tissue components (e.g., intra/extra-cellular environments) and geometries (e.g., packing, dispersion, etc.) could be modeled, and their effects included into this kind of studies. In this sense, the data from the cortex (Figs5and6) are particularly interesting. Although diffusion anisotropy (as obtained from, e.g., DTI), is generally low in the cortex as well as in most other gray matter areas of the brain, the gray matter’s underlying microstructures are indeed highly heterogeneous [47,48]. The NOGSE experiment seems to nevertheless show prominent features of cortex; this could be a result of its filtering of the larger components (such as cell bodies), and from having an enhanced sensitivity towards the smaller sizes (as manifest in the ~2–3μm compartments denoted inFig 6). Also, as axons project radially in the cortex, it is plausible that NOGSE tracks to some extent the orientation of these fibers. Future studies will focus on deriving rotationally invariant metrics from NOGSE, an interesting vista as these distribution parameters could become a novel way of characterizing orientations in the brain.
It is worth concluding with a reflection on the potential relevance of this study’s experi-ments for human investigations on the one hand, and for characterization of porous media in general on the other. The cellular-level characterizations in Figs4and6were performed using NOGSE gradient peak amplitudes of 57.6 G/cm; although this is a reasonable gradient strength for systems designed to investigate animal models, it is significantly higher than gradient strengths available in clinical scanners. Still, since NOGSE’s amplitude modulation varies as
ΔMNOGSE=
1 4D2
0 ðgGÞ 2
ðN 1Þl6
c, NOGSE’s parametric-sensitivity towards compartment sizes can be increased not only by raisingG, but also withN[34]. At the lowerfields used in
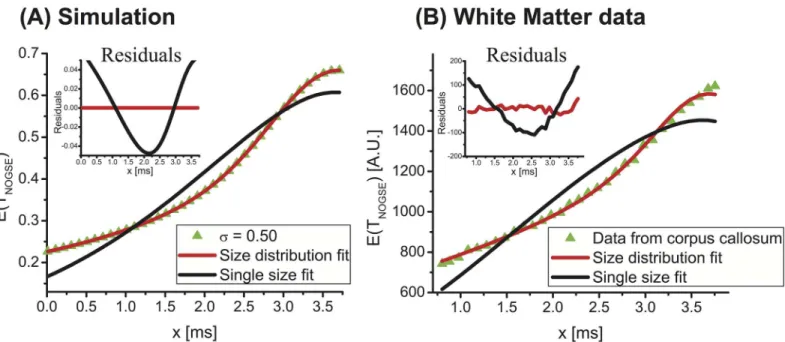
Fig 7. On the need for distributions to describe the NOGSE response arising in brain tissues. (A)Simulation for NOGSE data arising from a
distribution characterized bylc= 2μm andσ= 0.5 atG = 57.6G/cm,N = 8, andTNOGSE= 30msalong with fits to the distribution (red curve) and an attempt to
fit just a single size to the data (black curve). Residuals of the fits are shown in the inset.(B)Idem but for experimental data arising from ROI #4 of the corpus callosum (seeFig 4Afor the ROI’s definition). The residuals clearly demonstrate the need for distributions to fit the data in a robust way.
clinical studies T2is substantially increased;TNOGSEcan therefore be made significantly longer
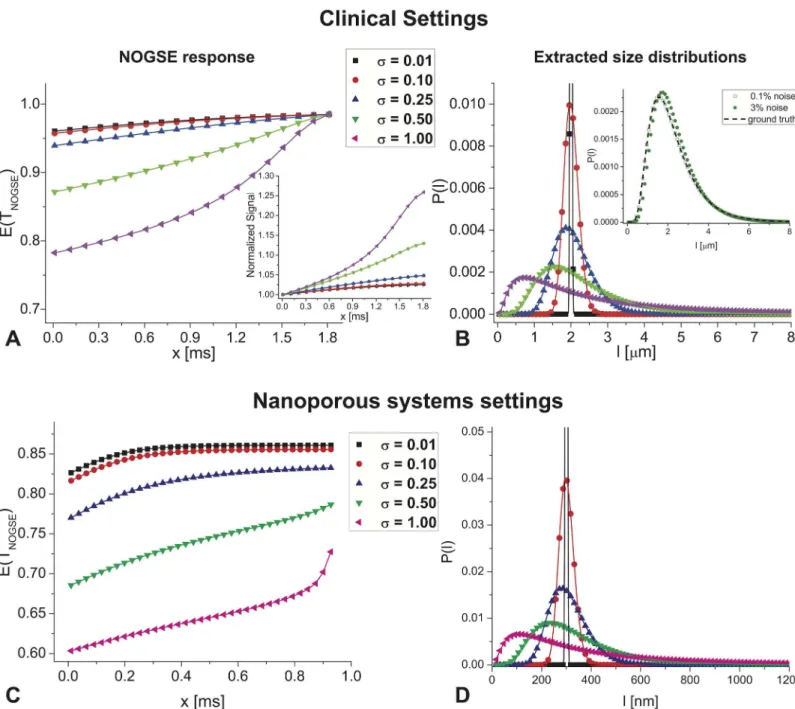
than the 30 ms values used in this study, and thereby accommodate moreNoscillations for the same range ofx-values as were used here. Although the“dynamic-range”of the amplitude modulations may be reduced (a result of trading the square dependence onGfor a linear dependence onN), simulations akin to those shown inFig 1for clinically-relevant parameters Fig 8. NOGSE’s size-resolving potential in human- and materials-oriented setting. (A-B)Simulations predicting NOGSE’s ability to extract cellular size distributions in clinically-relevant settings, involvingG =6 G/cm,N =64, andTNOGSE=120 ms,D0= 3.0E-5 (cm)2/sec. Notice that even when assuming the
relatively weak gradients available in whole body MRIs, cell-sized distributions can be resolved and characterized. The inset in panel B analyzes the effect of 0.1 and 3% noise added to the third distribution, showing that with some noise levels, distribution can still be reconstructed. All definitions are akin to those in Fig 1B and 1C.(C-D)Simulations demonstrating NOGSE’s ability to extract pore distributions in mesoporous materials (10–1000 nm range), using the stronger diffusion gradients available in NMR scanners (G =200 G/cm,N =160, andTNOGSE=150 ms,D0= 0.41E-5 (cm)2/sec). Notice the strong
differences in signals arising when pores are distributed aroundlc= 300nm.
(G =6 G/cm,N= 64,TNOGSE= 120 ms,D0=3.10
−9m2/sec) reveal that at least some
cellular-sized distributions can be faithfully reconstructed, particularly if they have a slightly larger width (Fig 8A and 8B). Still, it is important to note that the smaller NOGSE’s amplitude modu-lation becomes, the more challenging it is to resolve narrower distributions. While these simu-lations rely on somewhat highD0values–which could reflect diffusivity in white matter [55]–as
well as somewhat higher gradient amplitudes than are conventionally present (e.g., 4 G/cm), we note that if a more conventionalD0value of 1.5.10
−9m2/sec along with a more conventional
clinical gradient amplitude are chosen, NOGSE’sG2/D02dependence would render it even
more sensitive, with its amplitude increasing over these calculations by a factor of ~80%. In this respect, a new generation of scanners possessing stronger gradients, could be particularly useful to enhance the quality of such experiments. A second realm where NOGSE-based size distribution characterization methods could apply, arises in the realm of mesoporous materials. These are important catalytic systems where relevant pore sizes vary between a few nanometers and fractions of microns [56].Fig 8C and 8Dshow the expected NOGSE-derived distributions arising from such media, assuming pores distributed around a typical size of 300 nm. While these sizes are over an order of magnitude smaller than those involved in tissue studies, NOGSE still demands gradient strengths that are normally available on contemporary microi-maging NMR scanners, to reconstruct these pore size distributions. Even pore-size distribu-tions in the neighborhood of 100 nm can be characterized in this way, reflecting the relevance of NOGSE to enable these MR-challenging characterizations vis-à-vis pore size distributions.
In summary, this study presented a new approach to unravel cellular size distributions using a simple experiment monitoring the time-dependent transitions between free and restricted diffu-sion regimes. Simulations andin-cellvalidations demonstrate the reliability of the approach; when combined with MRI-based mapping techniques, remarkable contrasts demonstrating struc-tures and size distributions consistent withex vivohistological analyses, were evidenced in both white and grey matter tissues. All these features augur well for further exploiting this approach in novel characterizations of microstructures in porous systems in general, and for studying micro-structural correlations of normal and diseased CNS in particular.
Supporting Information
S1 Fig. NOGSE simulations for distributions centered around different correlation lengths.
The left panels shows NOGSE signals expected forlc= 1 and 4μm, for the different
distribu-tions indicated by the symbols. The right panels show the corresponding size distribudistribu-tions extracted (symbols) along with the ground truth (lines) by fits of the NOGSE data. The lines in the left panel are then fits generated from simulating NOGSE signals, from the distributions reconstructed from the right-panel fits. Simulation parameters:G= 40 G/cm,TNOGSE= 30 ms,
N= 8,D0= 0.7.10
−5cm2/sec.
(PDF)
S2 Fig. Analysis of the NOGSE signals in Figs4and6, as a function of abvalue.Thebvalue
of the gradient modulation waveform is defined as [(N-1)(x/TNOGSE)3+(1-(N-1)(x/TNOGSE))3]
G2(TNOGSE)3/12. The figures clearly show the non-exponential behavior manifesting the
restriction effects of the diffusion process. (PDF)
Acknowledgments
Dr. Nava Nevo (Weizmann Veterinary Services) for her assistance with the brain specimens. This work was supported by the Israel Science Foundation grant ISF 1142/13, a Helen and Martin Kimmel Award for Innovative Investigation, and the generosity of the Perlman Family Foundation.
Author Contributions
Conceived and designed the experiments: NS GAA LF. Performed the experiments: NS. Ana-lyzed the data: NS GAA. Wrote the paper: NS GAA LF. Contributed new theoretical tools: GAA.
References
1. Perge JA, Niven JE, Mugnaini E, Balasubramanian V, and Sterling P. Why Do Axons Differ in Caliber? J. Neurosci 2012; 32: 626–638.
2. Park Y, Best CA, Badizadegan K, Dasari RR, Feld MS, Kuriabova T, et al. Measurement of red blood cell mechanics during morphological changes (2010). Proc. Nat. Acad. Sci. U.S.A. 107: 6731–6736. 3. Tzur A, Kafri R, Lebleu VS, Lahav G, and Kirschner MW. Cell Growth and Size Homeostasis in
Prolifer-ating Animal Cells (2009) Science 325: 167–171.
4. Caminiti R, Ghaziri H, Galuske R, Hof PR, and Innocenti GM. Evolution amplified processing with tem-porally dispersed slow neuronal connectivity in primates (2009) Proc. Nat. Acad. Sci. U.S.A. 106: 19551–19556.
5. Innocenti GM. Development and evolution: Two determinants of cortical connectivity (2011). Gene Expression to Neurobiology and Behavior: Human Brain Development and Developmental Disorders 189: 65–75.
6. Deluca GC, Ebers GC, and Esiri MM. Axonal loss in multiple sclerosis: a pathological survey of the cor-ticospinal and sensory tracts (2004) Brain 127: 1009–1018.
7. Evangelou N, Konz D, Esiri MM, Smith S, Palace J, and Matthews PM. Size-selective neuronal changes in the anterior optic pathways suggest a differential susceptibility to injury in multiple sclerosis (2001) Brain 124: 1813–1820.
8. Lovas G, Szilagyi N, Majtenyi K, Palkovits M, and Komoly S. Axonal changes in chronic demyelinated cervical spinal cord plaques (2000) Brain 123: 308–317.
9. Innocenti GM, Vercelli A, and Caminiti R. The Diameter of Cortical Axons Depends Both on the Area of Origin and Target (2013) Cereb.Cortex in-press, doi: 10.1093.
10. Stepanyants A, Hof PR, and Chklovskii DB. Geometry and structural plasticity of synaptic connectivity (2002) Neuron 34: 275–288.
11. Cruz L, Roe DL, Urbanc B, Cabral H, Stanley HE, and Rosene DL. Age-related reduction in microco-lumnar structure in area 46 of the rhesus monkey correlates with behavioral decline (2004) Proc. Nat. Acad. Sci. U.S.A. 101: 15846–15851.
12. Johansen-Berg H. and Behrens T.E.J. Diffusion MRI: From quantitative measurement to in-vivo anat-omy. 2009 Academic Press.
13. Le Bihan D. Looking into the functional architecture of the brain with diffusion MRI (2003) Nat. Rev. Neurosci. 4: 469–480.
14. Budde MD and Frank JA. Neurite beading is sufficient to decrease the apparent diffusion coefficient after ischemic stroke(2010)Proc. Nat. Acad. Sci. U.S.A. 107: 14472–14477.
15. Moseley ME, Cohen Y, Mintorovitch J, Chileuitt L, Shimizu H, Kucharczyk J, et al. Early detection of regional cerebral-ischemia in cats—comparison of Diffusion-Weighted and T2-Weighted MRI and spectroscopy. Magn. Reson. Med. 1990 14: 330–346.
16. Callaghan PT, Coy A, Macgowan D, Packer KJ, and Zelaya FO. Diffraction-like effects in NMR diffusion studies of fluids in porous solids. Nature 1991 351: 467–469.
17. Cory DG and Garroway AN. Measurement of translational displacement probabilities by NMR—an indi-cator of compartmentation. Magn. Reson. Med. 1990 14: 435–444.
18. Ong HH, Wright AC, Wehrli SL, Souza A, Schwartz ED, Hwang SN, et al. Indirect measurement of regional axon diameter in excised mouse spinal cord with q-space imaging: Simulation and experimen-tal studies. Neuroimage 2008 40: 1619–1632.
20. Assaf Y and Basser PJ. Composite hindered and restricted model of diffusion (CHARMED) MR imaging of the human brain. Neuroimage 2005 27: 48–58.
21. Panagiotaki E, Schneider T, Siow B, Hall MG, Lythgoe MF, and Alexander DC. Compartment models of the diffusion MR signal in brain white matter: A taxonomy and comparison. Neuroimage 2012 59: 2241–2254.
22. Ambrosone L, Murgia S, Cinelli G, Monduzzi M, and Ceglie A. Size polydispersity determination in emulsion systems by free diffusion measurements via PFG-NMR. J. Phys. Chem. B 2004 108: 18472– 18478.
23. Özarslan E, Shemesh N, Koay CG, Cohen Y, and Basser PJ. Nuclear magnetic resonance characteri-zation of general compartment size distributions. New J. Phys. 2011 13: 015010.
24. Shemesh N, Özarslan E, Basser PJ, and Cohen Y. Detecting diffusion-diffraction patterns in size distri-bution phantoms using double-pulsed field gradient NMR: Theory and experiments. J. Chem. Phys.2010 132: 034703.
25. Latt J, Nilsson M, Malmborg C, Rosquist H, Wirestam R, Stahlberg F, et al. Accuracy of q-space related parameters in MRI: Simulations and phantom measurements. IEEE Trans. Med. Imaging 2007 26: 1437–1447.
26. Aggarwal M, Jones MV, Calabresi PA, Mori S, and Zhang JY. Probing mouse brain microstructure using oscillating gradient diffusion MRI. Magn. Reson. Med. 2012 67: 98–109.
27. Gore JC, Xu JZ, Colvin DC, Yankeelov TE, Parsons EC, and Does MD. Characterization of tissue struc-ture at varying length scales using temporal diffusion spectroscopy. NMR Biomed. 2010 23: 745–756. 28. Lasic S, Stepisnik J, and Mohoric A. Displacement power spectrum measurement by CPMG in constant
gradient. J. Magn. Reson. 2006 182: 208–214.
29. Siow B, Drobnjak I, Chatterjee A, Lythgoe MF, and Alexander DC. Estimation of pore size in a micro-structure phantom using the optimised gradient waveform diffusion weighted NMR sequence. J. Magn. Reson. 2012 214: 51–60.
30. Stepisnik J, Lasic S, Mohoric A, Sersa I, and Sepe A. Spectral characterization of diffusion in porous media by the modulated gradient spin echo with CPMG sequence. J. Magn. Reson. 2006 182: 195– 199.
31. Drobnjak I, Siow B, and Alexander DC. Optimizing gradient waveforms for microstructure sensitivity in diffusion-weighted MR. J. Magn. Reson. 2010 206: 41–51.
32. Alexander DC, Hubbard PL, Hall MG, Moore EA, Ptito M, Parker GJM, et al. Orientationally invariant indices of axon diameter and density from diffusion MRI. Neuroimage 2010 52: 1374–1389. 33. Smith PES, Bensky G, Alvarez GA, Kurizki G, and Frydman L. Shift-driven modulations of spin-echo
signals. Proc. Nat. Acad. Sci. U.S.A. 2012 109: 5958–5961.
34. Alvarez GA, Shemesh N, and Frydman L. Coherent Dynamical Recoupling of Diffusion-Driven Deco-herence in Magnetic Resonance. Phys. Rev. Lett. 2013 111: 080404.
35. Shemesh N, Alvarez GA, and Frydman L. Measuring small compartment dimensions by probing diffu-sion dynamics via Non-uniform Oscillating-Gradient Spin-Echo (NOGSE) NMR. J. Magn. Reson. 2013 237: 49–62.
36. Uhrig GS. Keeping a quantum bit alive by optimized pi-pulse sequences. Phys. Rev. Lett. 2007 98:
100504-37. Callaghan PT, Stepisnik J (1995) Frequency-Domain Analysis of Spin Motion Using Modulated-Gradi-ent Nmr. Journal of Magnetic Resonance Series A 117: 118–122.
38. Klauder JR, Anderson PW (1962) Spectral diffusion decay in spin resonance experiments. Physical Review B 125: 912–923.
39. Stepisnik J (1993) Time-Dependent Self-Diffusion by Nmr Spin-Echo. Physica B 183: 343–350. 40. Lawson SN (1979) Postnatal-Development of Large Light and Small Dark Neurons in Mouse Dorsal
Root-Ganglia—Statistical-Analysis of Cell Numbers and Size. Journal of Neurocytology 8: 275–294. PMID:490184
41. Pajevic S, Basser PJ (2013) An Optimum Principle Predicts the Distribution of Axon Diameters in Nor-mal White Matter. Plos One 8.
42. Shemesh N, Ozarslan E, Basser PJ, Cohen Y (2012) Accurate noninvasive measurement of cell size and compartment shape anisotropy in yeast cells using double-pulsed field gradient MR. Nmr in Bio-medicine 25: 236–246. doi:10.1002/nbm.1737PMID:21786354
44. Aboitiz F, Scheibel AB, Fisher RS, Zaidel E (1992) Fiber Composition of the Human Corpus-Callosum. Brain Research 598: 143–153. PMID:1486477
45. Caminiti R, Carducci F, Piervincenzi C, Battaglia-Mayer A, Confalone G, Visco-Comandini F, et al. (2013) Diameter, Length, Speed, and Conduction Delay of Callosal Axons in Macaque Monkeys and Humans: Comparing Data from Histology and Magnetic Resonance Imaging Diffusion Tractography. Journal of Neuroscience 33: 14501–14511. doi:10.1523/JNEUROSCI.0761-13.2013PMID: 24005301
46. Barazany D, Basser PJ, Assaf Y (2009) In vivo measurement of axon diameter distribution in the corpus callosum of rat brain. Brain 132: 1210–1220. doi:10.1093/brain/awp042PMID:19403788
47. Shemesh N, Cohen Y (2011) Microscopic and Compartment Shape Anisotropies in Gray and White Matter Revealed by Angular Bipolar Double-PFG MR. Magnetic Resonance in Medicine 65: 1216– 1227. doi:10.1002/mrm.22738PMID:21305595
48. Shemesh N, Barazany D, Sadan O, Bar L, Zur Y, Barhum Y, Sochen N, et al. (2012) Mapping apparent eccentricity and residual ensemble anisotropy in the gray matter using angular double-pulsed-field-gra-dient MRI. Magnetic Resonance in Medicine 68: 794–806. doi:10.1002/mrm.23300PMID:22128033
49. Altamura C, Dell'Acqua ML, Moessner R, Murphy DL, Lesch KP, Persico AM (2007) Altered neocortical cell density and layer thickness in serotonin transporter knockout mice: A quantitation study. Cerebral Cortex 17: 1394–1401. PMID:16905592
50. Hagemann G, Kluska MM, Redecker C, Luhmann HJ, Witte OW (2003) Distribution of glutamate recep-tor subunits in experimentally induced cortical malformations. Neuroscience 117: 991–1002. PMID: 12654351
51. Kang SH, Li Y, Fukaya M, Lorenzini I, Cleveland DW, Ostrow LW, et al. (2013) Degeneration and impaired regeneration of gray matter oligodendrocytes in amyotrophic lateral sclerosis. Nature Neuro-science 16: 571–579. doi:10.1038/nn.3357PMID:23542689
52. Lai WS, Xu B, Westphal KGC, Paterlini M, Olivier B, Pavlidis P, et al. (2006) Akt1 deficiency affects neu-ronal morphology and predisposes to abnormalities in prefrontal cortex functioning. Proceedings of the National Academy of Sciences of the United States of America 103: 16906–16911. PMID:17077150
53. Stepisnik J (1999) Validity limits of Gaussian approximation in cumulant expansion for diffusion attenu-ation of spin echo. Physica B 270: 110–117.
54. Shemesh N, Adiri T, Cohen Y (2011) Probing Microscopic Architecture of Opaque Heterogeneous Sys-tems Using Double-Pulsed-Field-Gradient NMR. Journal of the American Chemical Society 133: 6028–6035. doi:10.1021/ja200303hPMID:21446740
55. Beaulieu C (2002) The basis of anisotropic water diffusion in the nervous system—a technical review. NMR in Biomedicine 15: 435–455. PMID:12489094