Article
J. Braz. Chem. Soc., Vol. 23, No. 10, 1900-1906, 2012. Printed in Brazil - ©2012 Sociedade Brasileira de Química 0103 - 5053 $6.00+0.00
A
*e-mail: [email protected]
Photocatalytic Decomposition of Phenol by Nanocomposite of ZnS Nanoparticles
and Montmorillonite
Petr Praus,* Jakub Matys and Ondřej Kozák
Department of Analytical Chemistry and Material Testing, VŠB-Technical University of Ostrava, 17, Listopadu 15, 708 33 Ostrava-Poruba, Czech Republic
O nanocompósito de partículas de ZnS estabilizadas por íons cetiltrimetilamônio (ZnS−CTA) e
montmorilonita (ZnS−CTA−MMT) foi preparado e usado como catalisador na fotodecomposição de fenol sob radiação UV de uma lâmpada de Hg de pressão média. A quantidade de ZnS em ZnS−CTA−MMT foi aproximadamente 6 wt.%. Para comparação, a fotodecomposição foi também realizada com ZnS−CTA, montmorilonita e sem catalisador, isto é, usando apenas irradiação UV. A eficiência da fotodecomposição decresceu na ordem: UV + ZnS−CTA−MMT ca. UV + ZnS−CTA > UV > UV + MMT. A fotodecomposição na presença de ZnS−CTA−MMT
e ZnS−CTA ocorreu de acordo com a cinética de pseudo-primeira ordem. Em outros casos, a fotodecomposição correspondeu à cinética de pseudo-segunda ordem de fenol e radicais hidroxila. Radicais hidroxila foram produzidos pelas reações de oxigênio dissolvido e elétrons liberados a partir das nanopartículas ZnS e moléculas de fenol excitadas. MMT reduziu a velocidade da reação de fotodecomposição e não foi observada a atividade catalítica de MMT.
The nanocomposite of ZnS nanoparticles stabilized by cetyltrimethylammonium ions (ZnS−CTA) and montmorillonite (ZnS−CTA−MMT) was prepared and used as a catalyst for the
photodecomposition of phenol under UV irradiation of a medium pressure Hg lamp. The content of ZnS in ZnS−CTA−MMT was about 7 wt.%. For comparison, the photodecomposition was also performed with ZnS−CTA, montmorillonite and with no catalyst, i.e., using only UV irradiation. The photodecomposition efficiency decreased in the order: UV + ZnS−CTA−MMT ≈ UV +
ZnS−CTA > UV > UV + MMT. The photodecomposition in the presence of ZnS−CTA−MMT
and ZnS−CTA proceeded according to the pseudo-first order reaction kinetics. In other cases, the photodecomposition corresponded to the pseudo-second order reaction of phenol and hydroxyl radicals. Hydroxyl radicals were produced by reactions of dissolved oxygen and electrons released from the ZnS nanoparticles and excited phenol molecules. MMT decreased the photodecomposition reaction rate and no MMT catalytic activity was observed.
Keywords: ZnS nanoparticles, montmorillonite, nanocomposite, photocatalysis, phenol
Introduction
Typical properties of nanoparticles are high specific surface area and high reactivity that makes them suitable for adsorption of various compounds and for photocatalysis. In addition, in case of semiconductor nanopaticles, decrease of their size leads to increase of their band-gap energy known as the quantum size effect or quantum confinement. Oxidation and/or reduction reactions on semiconductor nanoparticles begin with excitation of electrons from the valence band to conduction band. This may occur
when electrons in the valence band absorb photons with energy equals to or higher than band-gap energy of the nanoparticle. At the same time holes in the valence band are generated. Both electrons and holes can recombine forming heat or luminescence irradiation or can take part in reduction or oxidation reactions with electron acceptors
or donors adsorbed on the nanoparticle surface.1,2
Electrons are caught by dissolved oxygen molecules
forming superoxide ion-radicals O2• − that are in equilibrium
with their conjugate acids, hydroperoxyls HO2• (pKa = 4.8).3
Two HO2• radicals form hydrogen peroxide and oxygen.
e− + O
2→ O2•− (1)
O2•− + H+ HO
2• (2)
2 HO2•→ H
2O2 + O2 (3)
H2O2 + e−→ OH• + OH− (4)
The holes react with water forming hydroxyl radicals as follows:
h+ + H
2O → OH• + H+ (5)
Many papers were dedicated to using clay minerals as
photocatalysts.4-10 Their catalytic activity was ascribed to
the photo-Fenton reaction of ferric ions located in their
structures4-6 or leached to the aqueous phase. Hydrated Fe3+
ions absorb photons forming hydroxyl radicals as
Fe3+ + H
2O → Fe(OH)2+ + H+ (6)
Fe(OH)2+ + hν→ Fe2+ + OH• (7)
Ferrous ions are then back oxidized to ferric ones by oxidants such as dissolved oxygen and hydrogen
peroxide. The reaction of Fe(OH)2+ (equation 7) is based
on absorption of UV irradiation that can be often decreased by the presence of other absorbing compounds. This condition is very limiting for the decomposition of organic compounds especially in real systems containing also solid particles. Some comprehensive reviews on application of
clays for the Fenton11 and photo-Fenton12 reactions were
published in the literature as well.
Hydroxyl radicals are often used for the decomposition of organic compounds at e.g. wastewater treatment
processes.13-15 They behave as electrophiles attacking
aromatic π electrons.Hydroxyl radicals are very strong
oxidation agents with the high standard electrochemical potential of Eo = 2.6 V to 2.8 V.3,16
The aim of this paper was to prepare the nanocomposite of ZnS nanoparticles and phyllosilicates and use it for the UV decomposition of phenol. The ZnS nanoparticles were precipitated in the presence of stabilizing
cetyltrimethylammonium bromide (CTAB).17,18 Advantages
of the nanocomposite is the long-term stability of ZnS nanoparticles and easy handling with powder samples. Recently such nanocomposite was tested for the reduction
of carbon dioxide.17
Phenol was chosen for these experiments because (i) its
photodecomposition mechanisms are well documented
in the literature, (ii) there are reliable analytical methods
for its determination and (iii) phenol is a widely spread
organic pollutant and new findings can help to understand its behaviour in the environment.
Under UV irradiation, the phenol decomposition in neutral and acidic solutions is presumed to be a two-step
(biphotonic) process.19,20 The first photon is absorbed
to form exited phenol (ArOH) in a single state and, consequently, the second photon is absorbed by phenol in its triple state producing electron and phenoxyl radical
cation (ArOH•+) as follows
ArOH + hν→ ArOH•+ + e−→ ArO• + e− + H+ (8)
The radical cation is rapidly deprotonated yielding phenoxyl radical. The electron can be trapped by dissolved oxygen forming hydroxyl radicals according to the reactions 1-4. Reactions of hydroxyl radicals and phenol or phenoxyl radical can form many intermediates, such
as 1,2- and 1,4-dihydroxybenzenes and consequently
o-and p-benzoquinones. Benzoquinones can be gradually
oxidized by hydroxyl radicals to carboxylic acids, such
as oxalic, formic,14 acetic,21 maleic, malonic, mucotic,
fumaric acid22,23 that are finally oxidized to carbon
dioxide. Other reactions of phenoxyl radicals can lead to the dimerization of phenol forming diphenylethers and
biphenols.21
Experimental
Materials
All chemicals were of analytical reagent grade: phenol,
p-nitroaniline, sodium nitrite, sodium hydrogencarbonate,
zinc acetate, sodium sulphide (all from Lachema, Czech Republic), cetyltrimethylammonium bromide (Merck, Germany). Water deionised by reverse osmosis (Aqua Osmotic, Czech Republic) was used for the preparation of all solutions. Kaolinite KGa-1b (Clay Minerals Society, USA), vermiculite (Grena, Czech Republic) and montmorillonite Swy 2 (Wyoming, USA) were used for the deposition of ZnS nanoparticles.
Preparation of ZnS and phyllosilicate nanocomposite
50 mL of the aqueous solution of Na2S (15 mmol L–1)
and CTAB was added drop-wise to 250 mL of the aqueous
solution of zinc acetate (2 mmol L–1) under vigorous
stirring. The concentration of CTAB was 4 mmol L–1. An
Phenol photodecomposition procedure
Phenol photodecomposition was performed in a stirred batch reactor opened to the air. The medium pressure Hg lamp was used for all experiments. The light flux was measured by a radiometer (UVP, USA) in the distance,
where the reaction took place: 83 mW cm–2 for 254 nm
and 30 mW cm–2 for 365 nm. The nanocomposite was
mixed with 70 mL of the aqueous solution of phenol
(0.55 mmol L–1). The mixture was stirred for 10 min
before the UV lamp was switch on to provide good homogenization of the dispersions. The temperature in the reactor was kept at 27 °C.
Analytical methods
The phenol decomposition products were analysed by a gas chromatograph Varian CO 3800 (Varian Inc., Australia) equipped with a mass detector Varian Saturn 2000 (EI, 70 eV). The 60 m long DB5 column with an inner diameter of 0.25 µm and helium as a carrier gas were used. The reaction dispersions were centrifuged and extracted by dichloromethane, which was evaporated at a water bath. The evaporated products were dissolved in a hexane-toluene mixture (80:20) and derivatized by acetic anhydride. The extracts were injected by means of a splitless injector at 280 °C. The temperature during the GC separation was elevated from 70 °C to 300 °C.
The total concentrations of iron were determined by an atomic absorption spectrometer AA280FS (Varian Inc., Australia) with the acetylene-air atomization. Phenol was determined by the reaction with diazonium salt of
p-nitroaniline. Absorbances of the resulting azo dye
were measured at the wavelength of 470 nm. All UV-Vis spectrophotometric measurements were performed by a spectrometer Lambda 35 (Perkin Elmer, USA). Dissolved oxygen was determined by the Winkler´s volumetric method. Total organic carbon (TOC) was determined by a Shimadzu analyzer TOC 5000A.
Specific surface area (SSA) of the nanocomposites was measured with an instrument Sorptomatic 1990 (Thermo Electron Corporation, USA) using nitrogen as an adsorbing gas and calculated by the Advance Data Processing software according to the BET isotherm at the
temperature of 77.3 K and at a ratio p/p0 up to 0.3, i.e., up
to the beginning of capillary condensation.
The X-ray powder diffraction (XRD) study was performed by a powder diffractometer (Bruker D8 Advance, Germany) equipped with a scintillation and position-sensitive
detector (Vantec, Germany) and a source of CoKα radiation.
The diffraction patterns were recorded in an ambient atmosphere under constant conditions (50 kV, 60 mA).
Results and Discussion
Preparation and characterization of ZnS nanocomposite
The ZnS nanoparticles were precipitated in the presence
of CTAB in the concentration of 3 mmol L-1, i.e., above its
critical micelar concentration (about 1 mmol L–1). Under
these conditions CTAB molecules exist as free monomers and micelles. CTA ions can adsorb on the surface of ZnS nanoparticles forming positively charged ZnS−CTA
micelles.18 The micelles were stabilized by their deposition
on various phyllosilicates, such as kaolinite, vermiculite and montmorillonite. The dispersions of ZnS−CTA and the phyllosilicates were shaken for 24 h, filtered and the UV-Vis absorption spectra of the filtrates were recorded as demonstrated in Figure 1. The absorption spectrum of ZnS−CTA was added in the Figure for comparison.
As shown, the lowest absorbances were measured in the filtrates of the montmorillonite dispersion because the
ZnS−CTA micelles were deposited on MMT in higher
amounts than on kaolinite and vermiculite. The deposition was enhanced by the negative charge of the MMT surface
that attracted the positively charged micelles.18 Therefore,
the ZnS−CTA−MMT nanocomposite was used for
further experiments. The structural MMT formula of Na0.38K0.04(Ca0.12Mg0.50 Fe3+
0.41Al2.90Ti0.01Mn0.01)(Si8)O20(OH)4 was calculated from the results of X-ray fluorescence and spectrophotometric analysis also to determine the content
of Fe3+ that is necessary for the photo-Fenton reaction.
The stability of ZnS−CTA−MMT was verified by its
shaking in water for 24 h. These dispersions were filtered and the UV-Vis absorption spectra of the filtrates were recorded. They did not show the typical absorption edge of
ZnS nanoparticles at about 320 nm (Figure 1), which means the ZnS nanoparticles were firmly attached to MMT likely
located in its pores.24 To verify this, ZnS−CTA−MMT was
dried at 105 °C and –24 °C and its specific surface area was measured. Total SSA of the micro- and mesopores of the
heated and frozen nanocomposite was 5.2 and 18.4 m2 g–1,
respectively. It indicates that some pores containing the ZnS nanoparticles were closed by heating at 105 °C.
In our earlier study17 it was found that the nanocomposite
consisted of about 7 wt.% of ZnS, 30 wt.% of CTA and 63 wt.% of MMT. The ZnS nanoparticles with the mean size of 4 nm and wurtzite structure were observed by
transmission electron microscopy.It was also found by
XRD that CTA was intercalated into the MMT interlayer.
Photodecomposition of phenol
The aqueous dispersions of MMT, ZnS−CTA−MMT and ZnS−CTA were applied for the photodecomposition of phenol by UV irradiation in the batch reactor. MMT was
applied in two concentrations: (i) 1.3 g L–1 corresponding to
the MMT content in the ZnS−CTA−MMT nanocomposite
and (ii) at the concentration of 7.1 g L–1 marked as MMT(1).
The content of ZnS in the ZnS−CTA−MMT and ZnS−CTA dispersions was similar.
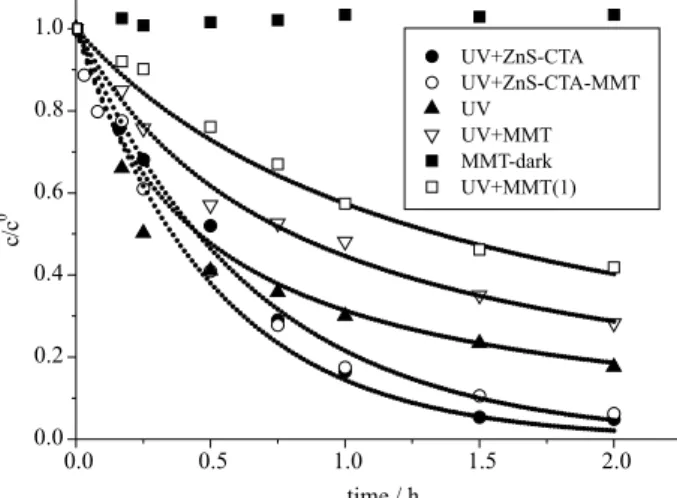
During 2 h the concentrations of phenol gradually decreased as shown in Figure 2. If no UV irradiation was applied (in dark) in the presence of MMT the phenol concentrations were nearly constant. It indicates that phenol was not adsorbed by MMT and the reactor walls. The photodecomposition efficiency decreased in the
order: UV + ZnS−CTA−MMT ≈ UV+ ZnS−CTA > UV >
UV + MMT. In comparison with the application of only UV irradiation, ZnS−CTA−MMT as well as ZnS−CTA
enhanced and, on the other hand, MMT deteriorated the phenol photodecomposition. The explanation of these phenomena is in the different concentrations of hydroxyl radicals produced under the various conditions.
Using the medium pressure Hg lamp hydroxyl radicals
cannot be produced by the dissociation of water molecules19
but they can be generated by the reactions of dissolved oxygen in water with electrons released from the ZnS nanoparticles and excited phenol molecules in accordance with equations 1-4.
The concentration of dissolved oxygen was measured during the UV photodecomposition without the catalysts. It steeply decreased within the first 30 min down to the
concentration of 1.5 mg L–1 and then became constant
(Figure 3). The determination limit of the used volumetric
method was about 0.5 mg L–1 therefore we can deduce that
a steady state between the consumption of oxygen for the formation of hydroxyl radicals and its transport from the air was reached.
Analysis of kinetic data
In general, the reactions of phenol and hydroxyl radicals on the surface of solid catalysts can be described by the
Langmuir-Hinshelwood model25
(9)
where kh is the kinetic parameter; KP, KOH, Ki and cP, cOH, ci are the adsorption constants and concentrations of remaining phenol, hydroxyl radicals and intermediates, respectively.
Figure 2. Reaction kinetics of phenol decomposition under various conditions.
In case of the catalytic activity of ZnS−CTA−MMT
and ZnS−CTA the production of high concentrations of hydroxyl radicals can be expected. If cOH >> cp and ΣKici is
neglected25 then equation 9 can be simplified to its mostly
used form
(10)
where kapp is the apparent kinetic parameter depending on
irradiation intensity, mass and nature of the solid phase (catalyst) and the concentration of hydroxyl radicals. It was theoretically approved this model is appropriate for the first
order kinetics.26 Adsorption of phenol on natural MMT and
MMT modified with CTA is low27 therefore K
pcp<< 1 and equation can be reduced to the pseudo-first order reaction,
r = kapp Kpcp = kobs cP (11)
where kobs is the observed kinetic constant. The reaction
rate constants were calculated by fitting the integrated rate equation of the first order kinetics (ln c/c0 = −kobs t, where c
and c0 are the concentrations of phenol at time t = t and t = 0,
respectively) and summarized in Table 1. The observed kinetic constants of ZnS−CTA−MMT and ZnS−CTA were similar which agrees with the similar content of ZnS. This fact is interesting and indicates that the ZnS nanoparticles enclosed in the MMT pores were in contact with the phenol molecules likely through the nanocomposite microspores.
The photodecompositon of phenol with MMT and with no photocatalysts proceeded according to the second order reaction kinetics. This situation occurs if ΣKici can be
neglected and it also holds that Kpcp<< 1 and KOHcOH<< 1.
Providing that cOH≈ cp equation 9 comes to the
pseudo-second order reaction:
r = k cOH cp≈ kobs cp2 (12)
This presumption means that some phenol molecules released electrons forming the similar number of hydroxyl radicals. These kinetic data were fitted by the integrated rate
equation for the second order reaction (1/c = 1/c0 + kobs t)
(Table 1). The observed kinetic constants decreased with the increasing content of MMT and, thus, no catalytic activity of MMT was observed. Some reasons are scattering of UV radiation on the MMT particles and absorption of UV irradiation by the photodecomposition intermediates.
The possibility of the photo-Fenton reaction in the
aqueous phase was verified. The concentration of Fe3+
could not be determined by spectrophotometric methods
based on complex forming reactions because Fe3+ ions form
complexes with phenol. Therefore, only the concentration of total iron was determined by AAS. As shown in Figure
3 it increased with the irradiation time up to 2.4 mg L-1 as a
result of iron leaching from the AlO6 octahedra where they
substitute Al3+. In spite of this, the photo-Fenton reaction
producing hydroxyl radicals was not observed. It can be
explained by the formation of complexes between Fe3+ ions
and phenol and/or other photodecomposition intermediates.
In addition, the amount of released Fe3+ was lower than its
content in MMT.
Intermediates of photodecomposition
There are many various compounds that can be formed during the photodecomposition of phenol as mentioned above. In this work, they were analysed by the UV spectrometry (Figure 4), GC-MS and the TOC analysis (Figure 3) in the reaction dispersions/solutions after 1 h of the photodecomposition. The analyses were not performed in the ZnS−CTA dispersion due to the high content of CTAB complicating the analytical procedures.
A s d e m o n s t r a t e d i n F i g u r e 4 t h e p h e n o l photodecomposition was characterized by the decrease of the absorbances at about 270 nm due to a ring-opening of phenol. The spectrum of phenol was used as a reference one. Using the absorbance at e.g. 238 nm (arrow in Figure 4) a degree of the decomposition of all organic compounds can
be ordered in this manner: UV + ZnS−CTA−MMT > UV >
UV + MMT. The UV absorption spectra of various Fe3+
salts were also recorded. They exhibited strong absorption in the range of 200-400 nm, which is necessary for the
Table 1. Reaction rate constants of phenol photodecomposition
Decomposition Observed kinetic constant Regression coefficient
UV+ZnS−CTA (0.537 ± 0.072) × 10–3 (s–1)a 0.9933
UV+ZnS−CTA−MMT (0.426 ± 0.039) × 10–3 (s–1)a 0.9947
UV 1.105 ± 0.116 (L mol–1 s–1)b 0.9945
UV+MMT (1.3 g L-1) 0.627 ± 0.061 (L mol–1 s–1)b 0.9954
UV+MMT (7.1 g L-1) 0.375 ± 0.036 (L mol–1 s–1)b 0.9956
photo-Fenton reaction and would be reduced by the presence of residual phenol and various organic intermediates.
Phenol and originating resorcinol were found by GC-MS as the majority organic compounds. The traces of acetophenone, dihydroxybenzenaldehydes, biphenyl-diols, dioxydiphenyls were also identified with the fit of
mass spectra ≥ 800 (max. fit = 1000). Dichloromethane
was used for a liquid-liquid extraction of reaction products and, therefore, some polar compounds could remain in the aqueous phase.
The total concentration of organic compounds was characterized by determined TOC that was compared with TOC calculated from the phenol concentrations (TOC-phenol). TOC decreased at 60 wt.%, which means that 40 wt.% of TOC was transferred to carbon dioxide. TOC-phenol decreased more rapidly because no other organic compound was taken into account in the calculation.
X-ray diffraction of montmorillonite
After the phenol photodecomposition in the presence of MMT, the MMT particles were separated, dried at 105 °C and examined by XRD. It was observed that the interlayer spacing d(001) changed from 1.13 nm of original MMT up to 1.27 nm of MMT after 2 h. A linear dependence between d(001) and irradiation time t (h) up to 2 h was obtained:
d(001) = 0.068 t + 1.13 (n = 6, r = 0.9926) (13)
We found in our earlier work27 that d(001) of MMT
intercalated by phenol increased of about 0.17 nm. Therefore, the intercalation of phenol and some intermediates can be assumed. The intercalated compounds could likely limit
the leaching of Fe3+ ions to the aqueous phase that was
demonstrated by the low concentrations of total iron in Figure 3.
Conclusions
The ZnS nanoparticles stabilized by CTA ions were deposited on montmorillonite forming the stable
ZnS−CTA−MMT nanocomposite. This nanocomposite was
tested as the catalyst for the photodecomposition of phenol by UV irradiation. For comparison, the experiments with ZnS−CTA, montmorillonite and with no catalyst (only UV) were also tested and the photodecomposition efficiency can
be ordered as UV + ZnS−CTA−MMT ≈ UV + ZnS−CTA >
UV > UV + MMT.
The reaction kinetics of the photodecomposition with the ZnS nanoparticles both fixed in the nanocomposite and as the free ZnS−CTA micelles corresponded to the pseudo-first order reaction model. It indicates that the ZnS nanoparticles produced the high concentrations of hydroxyl radicals (cOH>> cp). Taking into account the low content of ZnS (7 wt.%) the nanoparticles exhibited the very high photodecomposition efficiency. In other cases, the photodecomposition followed the pseudo-second order reaction model. The hydroxyl radicals were produced in lower concentrations by the reactions of electrons released from excited phenol and oxygen dissolved in water.
The MMT catalytic activity based on the photo-Fenton reaction referred in the literature was not observed. MMT decreased the decomposition reaction rates likely due to the UV irradiation scattering. It implies that a question of the clays photocatalytic activity is a complex and still open problem for further investigations and discussions. In next research the photocatalytic activity of the ZnS nanoparticles will be tested for the decomposition of other environmental pollutants.
Acknowledgments
The financial supports of the Grant Agency of the Czech Republic (P107/11/1918), Regional Material Technology Research Centre (CZ.1.05/2.1.00/01.0040) and VŠB-Technical University of Ostrava (student’s grants SP2012/29 and SP2012/196) are gratefully acknowledged. The authors thank Dr. Mamulová-Kutláková for measurement of the XRD patterns.
References
1. Mills, A.; Le Hunte, S.; J. Photochem. Photobiol., A 1997, 108, 1.
2. Hoffmann, M. R.; Martin, S.T.; Choi, W.; Bahnemann, D.W.;
Chem. Rev. 1995, 95, 69.
3. Buxton, G. V.; Greenstock, C. L.; Helman, W. P.; Ross, A. B.;
J. Phys. Chem. Ref. Data1988, 17, 513
4. Wu, F.; Li, J.; Peng, Z.; Deng, N.; Chemosphere2008, 72, 407. 5. Kibanova, D.; Trejo, M.; Destaillats, H.; Cervini-Silva, J.; Catal.
Commun.2011, 12, 698.
6. Gournis, D.; Karakassides, M. A.; Petridis, D.; Phys. Chem. Miner.2002, 29, 155.
7. León, M. A.; Castiglioni, J.; Bussi, J.; Sergio, M.; Catal. Today 2008, 133-135, 600.
8. Zhang, X.; Wu, F.; Deng, N.; Pozdnyakov, I. P.; Glebov, E. M.; Grivin, V. P.; Plyusnin, V. F.; Bazhin, N. N.; React.Kinet. Catal. Lett.2008, 94, 207.
9. Wang, Z.; Huang, L.; Du, L.; Sheng, L.; Lv, B.; J. Environ. Eng. 2010, Jan, 152.
10. Liu,Y.; Zhang, X.; Wu, F.; Appl. Clay Sci. 2010, 49, 182. 11. Navalon, S.; Alvaro, M.; Garcia, H.; Appl. Catal., B 2010,
99, 1.
12. Herney-Ramirez, J.; Vicente, M. A.; Madeira, L. M.; Appl. Catal., B2010, 98, 10.
13. Prousek, J.; Chem. Listy1996, 90, 307.
14. Schech, C. K.; Frimmel, F. H.; Water Res.1995, 29, 2346. 15. Dušek, L.; Chem. Listy2010, 104, 846.
16. Wood, P. M.; Biochem. J.1988, 253, 287.
17. Kozák, O.; Praus, P.; Kočí, K.; Klementová, M.; J. Colloid Interface Sci.2010, 352, 244.
18. Praus, P.; Dvorský, R.; Horínková, P.; Pospíšil, M.; Kovář, P.;
J. Colloid Interface Sci. 2012, 377, 58.
19. Alapi, T.; Dombi, A.; J. Photochem. Photobiol., A 2007, 188, 409.
20. Svetlichnyi, V. A.; Chaikovskaya, O. N.; Bazyl, O. K.; Kuznetsova, R. T.; Sokolova, I. V.; Kopylova, T. N.; Meshalkin, Yu. P.; High Energy Chem.2001, 35, 288.
21. Vogel, F.; Harf, J.; Hug, A.; von Rohr, P. R.; Environ. Prog. 1999, 18, 7.
22. Abbas, O.; Rebufa, C.; Depuy, N.; Kister, J.; Talanta2008, 77, 2000.
23. Ahmed, S.; Rasul, M. G.; Martens, W. N.; Brown, R.; Hashib, M. A.; Desalination 2010, 261, 3.
24. Praus, P.; Dvorský, R.; Pustková, P.; Kozák, O.; Adv. Sci. Eng. Med.2011, 3, 113.
25. Brosillon, S.; Lhomme, L.; Vallet, C.; Bouzaza, A.; Wolbert, D.;
Appl. Catal., B2008, 78, 232.
26. Kumar, K. V.; Porkodi, K.; Rocha, F.; Catal. Commun. 2008, 9, 82.
27. Kostelníková, H.; Praus, P.; Turicová, M.; Acta Geodyn. Geomater.2008, 5, 83.