Article
Printed in Brazil - ©2012 Sociedade Brasileira de Química0103 - 5053 $6.00+0.00
A
*e-mail: [email protected]
chttp://www.rqmg.com.br/
Determination of Sildenafil Citrate (Viagra
®) in Various Pharmaceutical Formulations by
Flow Injection Analysis with Multiple Pulse Amperometric Detection
Antônio Carlos V. Lopes Júnior,a,b Rita de Cássia Silva Luz,b,c Flávio S. Damos,b,c Alexandre S. dos Santos,c,d Diego L. Francoe and Wallans T. Pio dos Santos*,a,c
aDepartamento de Farmácia and bDepartamento de Química,
Universidade Federal dos Vales do Jequitinhonha e Mucuri, 39100-000 Diamantina-MG, Brazil
cRede Mineira de Química-MG, Brazil
dDepartamento de Ciências Básicas, Universidade Federal dos Vales do Jequitinhonha e Mucuri,
39100-000 Diamantina-MG, Brazil
eInstituto de Química, Universidade Federal de Uberlândia, 38700-128 Patos de Minas-MG, Brazil
O presente trabalho apresenta uma metodologia simples, rápida e de baixo custo para a
determinação de citrato de sildenafila (SC) em formulações farmacêuticas de referência (Viagra®)
e em produtos similares, genéricos e manipulados, por amperometria de múltiplos pulsos em sistema FIA (análise por injeção em fluxo). O método consiste na aplicação de três pulsos de potencial (sequenciais) em função do tempo sobre um eletrodo de trabalho de diamante dopado com boro. SC foi detectado em 1,6 e 1,9 V por meio de dois diferentes processos irreversíveis de oxidação. Um terceiro pulso de potencial (1,0 V) foi aplicado para regeneração da superfície
do eletrodo. Foram obtidos limites de detecção na ordem de 10 nmol L-1 e desvio padrão relativo
menor que 0,2% (n = 10) para SC 4,5 × 10⁻⁵ mol L-1, permitindo 86 injeções por hora. Estudos de
adição e recuperação nas amostras ficaram próximos de 100% e os resultados foram validados por cromatografia.
This work presents a simple, fast and low-cost method for determining sildenafil citrate
(SC) in Viagra®and in similar, generic and manipulated pharmaceutical formulations using flow
injection analysis (FIA) with multiple pulse amperometric detection. The method consists on the application of three sequential potential pulses as a function of time. SC is detected at 1.6 and 1.9 V by two different irreversible oxidation processes. The third potential pulse (1.0 V) is applied for the regeneration (cleaning) of the surface of the boron-doped electrode. The limit of detection on
an order of 10 nmol L-1 was reached with a relative standard deviation of less than 0.2% (n = 10)
for 4.5 × 10⁻⁵ mol L-1 CS. The analytical frequency was calculated in 86 injections per hour. The
addition recovery studies in all the samples were approximately 100% and the results were validated by chromatographic methods.
Keywords: sildenafil citrate, multiple pulse amperometry, flow injection analysis
Introduction
Sildenafil citrate (SC) (Viagra®, Figure 1) is the
pioneer drug in erectile dysfunction treatment introduced by Pfizer in 1998. Since then, Viagra® has become one of
the most marketed drugs worldwide, reaching 6 million prescriptions in its first 6 months on the market and generating billions of dollars in revenue.1-3 As a result of
such demand, Viagra® is among the most adulterated drugs
in the world.4,5 Moreover, Pfizer Viagra® manufacturing
patent expired in June 2010, and several pharmaceutical laboratories and pharmacies began to produce and market generic, similar and manipulated versions of the drug comparable to Viagra®, the reference listed drug. However,
there is no record of an official method for drug-quality control of Viagra® in the Brazilian Pharmacopeia, nor in
analytical methods for drug quality control in order to protect the health of consumers.
In the literature there are numerous methods for the identification, characterization and quantification of SC in several matrixes, among them high performance liquid chromatography with ultraviolet detection (HPLC-UV)5-10 or coupled to mass spectrometry (MS),11,12
gas chromatography (GC-MS),13,14 micellar electrokinetic
chromatography,15 capillary electrophoresis,16 UV-Visible
spectroscopy,1,7,17-19 nuclear magnetic resonance,20 X-ray
diffraction21 of resonance rayleigh scattering22 and
electrochemical techniques.6,23-26
Most reported techniques used today for SC quality control are based on HPLC-UV due to the fact that this method provides robust and selective analysis. It also allows the analysis of the active ingredient in complex samples. Although the chromatographic techniques are the ones most-utilized in pharmaceutical drug quality control, these techniques include several drawbacks, including high analysis costs, complexity of operation, high reagent consumption with waste generation, and, in many cases, the requirement of prior treatment of the sample before its injection. It is worth noting that when there is only one active ingredientin the pharmaceutical formulation, the case with SC, separation techniques for analyte quantification in the samples are unnecessary since the excipient present in the matrix is not a potential interferent in the analytical response obtained by the electrochemical detector. From this perspective, the development of an analytical method which combines reduced analysis time, high sensitivity and selectivity, simplicity and low cost is extremely important, mainly in routine laboratory analysis. Therefore, the electrochemical techniques stand out as promising alternatives, offering all the aforementioned advantages,27 while circumventing the inconveniences
presented by other methods, both on an industrial scale and in microenterprises, e.g., manipulation pharmacies.
However, in the published literature there are few methods based on SC electrochemical detection. The first work
reported was performed by Berzas et al.23 using square wave
voltammetry and adsorptive stripping square wave techniques on a hanging mercury drop electrode. Afterwards, the same research group used this method for SC determination in biologic fluids,24 obtaining a limit of detection in the range of
nmol L-1. Other working electrodes have recently been used
for SC determination in pharmaceutical formulations, e.g., the use of a lead film modified glassy carbon electrode by adsorptive stripping voltammetry,25 which reached a limit of
detection of 9.0 × 10⁻¹⁰ mol L-1. Two other electroanalytical
methods have utilized working electrodes based on diamond properties: one designed as a boron-doped diamond (BDD) film6 and the other as a paste-based diamond.26 Detection
with these diamond electrodes presents some advantages, such as low noise, a broad potential window and resistance towards insulation.6,26,28-32 The methods using diamond-based
electrodes for SC determination obtained good repeatability. The limit of detection was 1.0 × 10⁻¹³ mol L-1 by square wave
voltammetry on the diamond paste-based electrode and 6.4 × 10⁻⁷ mol L-1 by differential pulse voltammetry (DPV)
on BDD film. It is worth noting that a potentiometric method was used on ion selective membrane electrodes for the analysis of SC in its pure form, in pharmaceutical preparations and in blood serum.33 These sensors are based
on a complex ion formation between SC and sodium tetraphenylborate and phosphomolybdic acid as ionophores in polyvinyl chloride membrane. The limit of detection was on the order of µmol L-1. These electroanalytical studies
can be still improved in order to obtain a practical and efficient method for routine analysis in pharmaceutical laboratories, eliminating the need for modification or use of electrodes with toxic potential (e.g., mercury and lead), and, furthermore, improving the analytical parameters by increasing reproducibility, simplicity and analytical frequency.
An alternative method for improving electrochemical detection is the association with flow injection analysis (FIA), which may yield a higher analytical frequency and greater electrochemical response reproducibility when compared with stationary techniques. In addition, when the FIA system is coupled to the multiple pulse amperometry (MPA) technique, there is the possibility of a working electrode surface being cleaned and reactivated continuously, as well as the amperometric signal monitoring of each potential pulse applied, allowing for an increase in selectivity of the electrochemical method for electroactive compound quantification.34 A review in greater detail of the MPA
method and FIA technique was recently reported by dos Santos et al.35 The present work presents a simple, fast and
reproducible analytical method for SC determination in several pharmaceutical formulations based on MPA detection
coupled to the FIA system (MPA-FIA method), using a boron-doped diamond as the working electrode.
Experimental
Reagent and solutions
All reagents used were of analytical grade and the solutions were prepared in de-ionized water (18 MΩ cm) obtained from the Milli-Q Plus (Millipore®) purification
system. In the investigations of analyte electrochemical detection, the following were used: sulfuric acid solutions (Vetec, Rio de Janeiro, Brazil), acetate buffer from acetic acid and sodium acetate (Merck, Rio de Janeiro, Brazil) (pH 4.7), phosphate buffer from sodium dihydrogen phosphate and disodium hydrogen phosphate (Vetec, Rio de Janeiro, Brazil) (pH 7.0), borate buffer from boric acid and sodium borate (Merck, Rio de Janeiro, Brazil) at pH 10.0. SC was obtained from Sigma-Aldrich (St. Louis, MO, USA) and its stock solutions were prepared in a concentration of 10.0 mmol L-1 with water in an ultrasound bath (Unique:
USC-1400) for 10 min. SC drugs were acquired from drugstores in the Diamantina and Belo Horizonte Cities, Minas Gerais State, Brazil.
The proposed method was tested to determine SC in samples of reference, generic and manipulated pharmaceutical formulations, according to the following procedure: the contents of ten tablets were weighed and powdered. A portion of the fine powder containing approximately 25 mg (reference sample from Pfizer: Viagra®), 50 mg (generic
sample from pharmaceutical industry: EMS (Hortolândia, Brazil)), 100 mg (similar sample from EMS: Sollevare®) and
25, 50 and 100 mg (manipulated sample from manipulation pharmacy: BSPharma (Belo Horizonte, Brazil)) was weighed and then dissolved in 0.1 mol L-1 sulfuric acid
solutions using an ultrasonic bath for 30 min. The solution obtained after filtration was transferred quantitatively into a calibrated flask and diluted to a final volume of 100 mL. The respective working solutions and samples were prepared by the dilution of stock solution in the supporting electrolytes or in the mobile phase before use. HPLC/UV high-grade acetonitrile, triethanolamine and methanol (Merck) were used to compare the proposed method with that of liquid chromatography.
Instrumentation
Electrochemical measurements were performed using an Autolab potentiostat PGSTAT 128N (Eco Chemie) and a home-made electrochemical flow cell (“wall jet” type) with
three incorporated electrodes.36 Ag / AgCl, KCl (sat.)37 and
platinum wire were used as reference and auxiliary electrodes, respectively. A boron-doped diamond (BDD) film dopant concentration in 8.000 ppm (2.0 mm2), obtained
from Centre Suisse de Electronique et de Microtechnique SA (CSEM), Neuchatêl, Switzerland, was used as the working electrode. Gandini et al.38 described the details of
BDD. The BDD electrode was first cleaned in ethanol and electrochemically treated, as recently described, by cathodic and anodic treatment through application of
−9 C cm-2 and +5 C cm-2, respectively.39 The FIA system
(single line) utilized polyethylene tubing with 2 mm i.d. The flow rate (2.0 mL min-1) was controlled by the pressure
generated by a water column.40 Studies to establish the
potential steps to be used for amperometric detection were performed by cyclic voltammetry. A scan rate of 50 mV s-1
was used in the respective potential ranges provided by BDD in different supporting electrolytes at a concentration of 0.1 mol L-1. The MPA method in FIA technique was
evaluated together with the analytical parameters for SC quantification in pharmaceutical formulations. All experiments using MPA are presented after the subtraction of the constant background current (capacitive). The data obtained were processed off-line applying Origin 8.0 software (OriginLab Corporation).
The chromatographic analysis was carried out on a Shimadzu ultra fast liquid chromatograph (UFLC) with UV detection, Prominence LC 20 AD model. The analyte separation was performed using a C18 column (model Shim-Pack XRODS) and a mobile phase composed by methanol/acetonitrile/triethanolamine buffer solution pH 3.0 (17:25:58, v/v/v). The triethanolamine solutions used in the mobile phase were prepared in 0.7% (v/v) water, and the pH value was adjusted with orthophosphoric acid. Under these conditions, the retention time for SC was 2 min. UV detection was performed at a fixed wavelength of 290 nm.
Results and Discussion
Methodology optimization
The best conditions in relation to the supporting electrolyte and the working electrode were obtained in 0.1 mol L-1 sulfuric acid media over BDD electrode,
as can be verified in the voltammogram presented in Figure 2. There are two irreversible oxidation peaks related to SC, one around 1.4 V and another around 1.9 V, which are in accordance with previous studies described by Batista et al.6 The oxidation mechanisms of these two
by Ӧzkan et al.41 using a glassy carbon electrode. These
authors suggest that the first oxidation process is due to the monoprotonated form of the piperazine ring of sildenafil molecule and the second oxidation process corresponds to an adsorption-desorption of the oxidation product generated in the electrode surface.41 These studies were consistent
with results presented in this work. Voltammogram (b) in Figure 2 was obtained after cathodic treatment of BDD electrode surface. Comparing this voltammogram with the ones obtained after anodic treatment and without electrode treatment (not shown), no significant change in the oxidation profile presented by SC was observed. However, the cathodic treatment generated a slight oxidation shift to lower potential and a slight increase in the electrochemical response when compared to the process without anodic treatment and after anodic treatment of the BDD electrode surface. Thus, the studies for SC electrochemical detection were conducted using the electrode treated cathodically.
After SC electrochemical behavior characterization, the optimization of MPA detection parameters was performed in relation to the potential pulses and application time for analyte detection and cleaning of the electrode surface. Initially, the potential pulses were evaluated, fixing the application time to 100 ms with a flow rate of 2 mL min-1 and a sample loop volume of 100 µL.
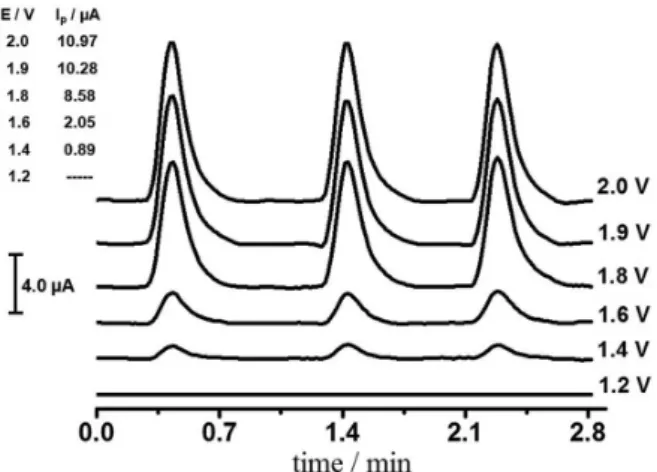
The amperograms presented in Figure 3 demonstrate that SC is not oxidized in a potential lower than 1.2 V, but only after 1.4 V, with a significant response at 1.6 V. It is only after 1.8 V that a response increase occurs which can be justified by the electrochemical response acquisition of two oxidative processes of SC at this potential. Since MPA allows for the monitoring of several potential pulses, two were chosen for SC detection: one at 1.6 V and the other at 1.9 V. The choice of these potentials is due to the fact that at a potential of 1.9 V, the experiment presents more
sensitivity, while at 1.6 V it presents more selectivity. In addition, SC amperometric profile against the application of two potential pulses may be helpful in the characterization of the sample active ingredient.
The application times of the two selected potential pulses for SC detection were also evaluated as a function of the amperometric response intensity. The results obtained indicated that the lower pulse application time of 30 ms generated, in both the 1.6 V and 1.9 V cases, the highest electrochemical response for a 2.0 mL min-1 flow rate.
However, since the second oxidation process depends on the first, the 1.9 V response increases as time increases at the generated potential (1.6 V). Because the initial work objective is SC detection in pharmaceutical formulations in which the analysis does not require high sensitivity, the application time selected for the two potentials was 30 ms. Furthermore, faster data acquisition may offer a higher analytical frequency and decrease the electrode surface contamination or passivation in the electrochemical detection.
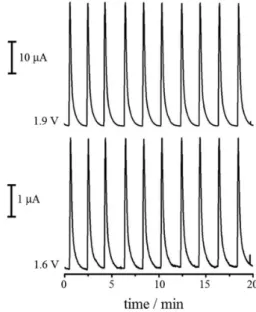
Several potential pulses used for cleaning and renewing the BDD electrode surface were evaluated in an effort to decrease electrode contamination or passivation. The potential which offered better repeatability was selected. The best cleaning application time selected was also evaluated in terms of repeatability. This parameter was determined based on the relative standard deviation (RSD) responses of 10 consecutive injections of 4.5 × 10⁻⁵ mol L-1
SC. The best conditions established were at 1.0 V for 600 ms, at which RSD of 0.1% was obtained for the potential pulse at 1.9 V and RSD of 0.2% was obtained for the pulse at 1.6 V, indicating that the method is
Figure 2. Cyclic voltammograms at BDD of the supporting electrolyte 0.1 mol L-1H
2SO4 (a) and of supporting electrolyte plus 7.5 × 10⁻⁴ mol L-1
SC after cathodic treatment (b), scan rate of 50 mV s-1.
Figure 3. Amperograms obtained by MPA detection in FIA injections in triplicate of 1.0 × 10⁻⁴ mol L-1 SC; flow rate of 2.0 mL min-1, sample
loop of 100 µL and application time of 100 ms for the following working potential: 1.2, 1.4, 1.6, 1.8, 1.9 and 2.0 V. The average intensity of peak current (IP) for the respective detection potential is shown in the upper
highly reproducible, as can be verified in Figure 3. It is noteworthy that the MPA method in FIA using BDD for SC determination presented greater reproducibility (RSD 10 times lower) than the stationary method described in previous studies using the same working electrode and the DPV technique.6
As can be seen in Figures 3 and 4, the signal ratios (obtained in 1.6 and 1.9 V) are different. This might be explained when flow is insufficient to renew species over the work electrode. Thus, the amperometric response increases as the application time of the potential pulse decreases, as reported by dos Santos and associates.35
Furthermore, the amperometric response at 1.9 V is more sensitive, and this oxidation process depends on the first (1.6 V). Therefore, as the application times of the potential pulses are different in these studies (100 ms in Figure 3 and 30 ms in Figure 4, for both the potential pulses), there was a difference in the signal ratios obtained.
The flow rate and the sample loop volume were optimized in relation to SC analytical frequency and electrochemical response. The flow rate and sample loop which provided the best sensitivity, allied to a high analytical frequency (86 injections per h), were 2.0 mL min-1 and 100 µL, respectively.
Studied analytical parameters for SC determination
The working linear range was determined for the two potential pulses of detection: 2.0 × 10⁻⁶ to 1.0 × 10⁻⁴ for
1.6 V and 6.0 × 10⁻⁷ to 1.0 × 10⁻⁴ for 1.9 V. The linear
correlation coefficients for these curves were 0.995 and 0.999, respectively. The limits of detection (LD) for SC determination were obtained by multiplying the baseline noise SD by three and dividing this value by the sensitivity (angular coefficient) of each curve. The values obtained were 4.2 × 10⁻⁷ mol L-1 for 1.6 V and 3.8 × 10⁻⁸ mol L-1 for
1.9 V. As can be verified, the proposed method presents a wide working linear range and a low limit of detection, allowing for studies of highly diluted samples and a decrease in occasional interferences in the matrix. Furthermore, the repeatability studies showed relevant results, indicating that the BDD working electrode suffers no passivation and contamination, which have been recurrent problems in electroanalytical methods using other electrodes. Therefore, considering its high reproducibility, high analytical frequency, wide working linear range, and low LD, the MPA method coupled with FIA method proposed in this work demonstrates numerous advantages over existing methods of determining SC in pharmaceutical formulations.
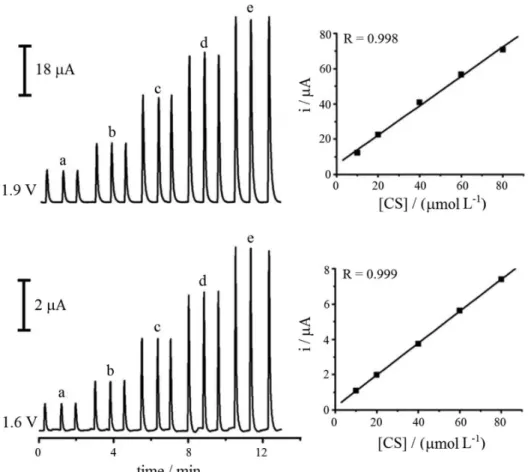
After all parameter optimizations, SC addition-recovery studies of pharmaceutical samples in different commercial forms of the drug were performed. The FIAgrams and the calibration curve obtained for this study are presented in Figure 5. The linear correlation coefficient obtained for both potential pulses are approximately 0.99. The equations of straight line 1 and 2 were obtained by a linear regression of calibration curves for the electrochemical response of applied potential pulses at 1.6 and 1.9 V, respectively. The addition-recovery studies performed in commercial samples using these calibration curves showed results of around 100%, indicating the absence of samples-matrix effect.
Ip (µA) = 0.0941 + 0.0994 [SC] (µmol L-1), for 1.6 V (1)
Ip (µA) = 1.2022 + 0.9484 [SC] (µmol L-1) , for 1.9 V (2)
Comparison with the chromatographic method (UFLC-UV)
The content assay results derived from commercial samples using the proposed method in comparison with UFLC-UV are presented in Table 1. The results obtained from the two methods were evaluated with the support of statistical tests (F and T) and may be considered similar for both methods with a confidence level of 95%. It may be noted that there was no difference among the different analyzed samples in relation to the labeled values of the product formulations, even in the case of manipulated samples.
Figure 4. Amperograms obtained by MPA detection in FIA of 10 consecutive injections of 4.5 × 10⁻⁵ mol L-1 SC; flow rate of 2.0 mL min-1,
Conclusions
This work presents for the first time a method of SC determination in different pharmaceutical formulations utilizing MPA detection coupled to an FIA system. This technique, associated with a BDD working electrode,
provided a sensitive, selective, fast and highly reproducible method. Furthermore, the proposed method presents numerous advantages when compared to chromatographic methods, including low analysis costs, simplicity of application with few sample preparation steps, and low waste generation. Thus, the proposed method may be an extremely attractive alternative for routine large and small-scale SC analysis.
Acknowledgements
The authors would like to acknowledge the financial support of Conselho Nacional de Desenvolvimento Científico e Tecnológico (CNPq), Coordenação de Aperfeiçoamento de Pessoal de Nível Superior (CAPES) and Fundação de Amparo à Pesquisa do Estado de Minas Gerais (FAPEMIG).
References
1. Weinert, P.; Pezza, L.; Pezza, H. R.; Quim. Nova2008, 31, 1112. 2. Aisho, K. S.; Cott, K. S. S.; Orimoto, S. M., Akahara, Y. N.;
Biol. Pharm. Bull.2001,24, 1384.
Table 1. SC determination results in reference, generic, similar and manipulated pharmaceutical formulations by the proposed method (MPA-FIA) and in comparison with the chromatographic method (UFLC-UV)
SC formulationsa Labeled / mg MPA-FIA / mg UFLC-UV / mg
Reference 25 31.2 ± 0.6 29.8 ± 0.8
Generic 50 62.4 ± 0.3 61.7 ± 1.7
Similar 100 117.2 ± 1.4 116.3 ± 4.3
Manipulated A 25 25.4 ± 0.6 25.7 ± 2.0
Manipulated B 50 51.7 ± 0.5 49.6 ± 0.6
Manipulated C 100 109.8 ± 2.7 106.2 ± 1.8
aReference sample: Viagra®, generic sample: pharmaceutical industry
(EMS), similar sample: Sollevare®, manipulated samples (A, B and C):
manipulation pharmacy (BSPharma); values after ±: standard deviation (n = 3).
Figure 5. SC FIAgrams obtained for MPA in FIA in standard concentrations of (a) 10, (b) 20, (c) 40, (d) 60 and (e) 80 µmol L-1; potential pulses:
1.6 V / 30 ms, 1.9 V / 30 ms and 1.0 V / 600 ms (not shown), flow rate of 2.0 mL min-1 and sample loop of 100 µL. The calibration curves are shown next
3. http://veja.abril.com.br/080709/chegou-hora-mais-vendidos-p-112.shtml accessed in September 2012.
4. http://www.alanac.org.br/index.php?option=com_content& view=article&id=6437&catid=:associados accessed in September 2012.
5. Ortiz, R. S.; Antunes, M. V.; Linden, R.; Quim. Nova2010, 33, 389.
6. Batista, E. F.; Sartori, E. R.; Medeiros, R. A.; Rocha-Filho, R. C.; Fatibello-Filho, O.; Anal. Lett.2010, 43, 1046. 7. Issa, Y. M.; El-Hawary, W. F.; Youssef, A. F. A.; Senosy, A. R.;
Spectrochim. Acta, Part A2010, 75, 1297.
8. Dinesh, N. D.; Vishukumar, B. K.; Nagaraja, P.; Made Gowda, N. M.; Rangappa, K. S.; J. Pharm. Biomed.2002, 29, 743. 9. Abd-Elbary, A.; Foda, N. H.; El-Gazayerly, O. N.;
Chromatographia2004, 59, 561
10. Aboul-Enein, H. Y.; Hefnawy, M. M.; J. Liq. Chromatogr. Related Technol.2003, 26, 2897.
11. El-Gindy, A. E.; Shokry, E.; Farouk, M.; El-Aziz, L. A.; J. Biomed. Sci. Res.2010, 2, 262.
12. Tacqui, A.; Ludes, B.; J.Anal. Toxicol.2003, 27, 88. 13. Tseng, M. C.; Lin, J. H.; J. Food Drug Anal.2002, 10, 112. 14. Berzas, J. J.; Rodríguez, J.; Villaseñor, M. J.; Contento, A. M.;
Cabello, M. R.; Chromatographia2002, 55, 601.
15. Berzas, J. J.; Flores, J. R.; Castañeda, G.; Fariñas, N. R.; J. Chromatogr., A2002, 953, 279.
16. Qin, W.; Li, S. F. Y.; Electrophoresis2002, 23, 4110. 17. Amin, A. S.; Moustafa, M. E.; El-Dosoky, R. M. S.; J. AOAC
Int. 2009, 92, 125.
18. Harikrishna, K.; Nagaralli, B. S.; Seetharamappa, J.; J. Food
Drug Anal.2008, 16, 11.
19. Altiokka, G.; Atkosar, Z.; Sener, E.; Tunçel, M.; J. Pharm.
Biomed. Anal.2001, 25, 339.
20. Wawer, I.; Pisklak, M.; Chilmonczyk, Z.; J. Pharm. Biomed
Anal.2005, 38, 865.
21. Maurin, J. K.; Plucínski, F.; Mazurek, A. P.; Fijalek, Z.;
J. Pharm. Biomed. Anal.2007, 43, 1514.
22. Liu, S. P.; Fan, L.; Hu, X. L.; Liu, Z. F.; Li, S.; Anal. Sci.2006,
22, 819.
23. Berzas, J. J.; Rodriguez, J.; Castañeda, G.; Villaseñor, M. J.;
Anal. Chim. Acta2000, 417, 143.
24. Rodríguez, J.; Berzas, J. J.; Castañeda, G.; Rodríguez, N.;
Talanta2004, 62, 427.
25. Tyszczuk, K.; Korolczuk, M.; Bioelectrochemistry2010, 78, 113.
26. Staden, R. S.; Staden, J. F.; Aboul-Enein, H. Y.; J Solid State
Electrochem. 2010, 14, 997.
27. Stradiotto, N. R.; Yamanaka, H.; Zanoni, M. V. B.; J. Braz.
Chem. Soc.2003, 14, 159.
28. Sartori, E. R.; Medeiros, R. A.; Rocha, R. C.; Fatibello, O.;
J. Braz. Chem. Soc.2009, 20, 360.
29. Ribeiro, F. W. P.; Cardoso, A. S.; Portela, R. R.; Lima, J. E. S.; Machado, S. A. S.; De Lima, P.; De Souza, D.; Correia, A. N.; Electroanalysis 2008, 20, 2031.
30. Garbellini, G. S.; Uliana, C. V.; Yamanaka, H.; J. Braz. Chem. Soc.2011, 22, 1241.
31. Pecková, K.; Barek, J.; Curr. Org. Chem. 2011, 15, 3014. 32. Pedrosa, V. A.; Codognoto, L.; Avaca, L. A.; J. Braz. Chem.
Soc.2003, 14, 530.
33. Othman, A. M.; Rizk, N. M. H.; El-Shahawi, M. S.; Anal. Chim.
Acta2004, 515, 303.
34. dos Santos, W. T. P.; Gimenes, D. T.; Almeida, E. G. N.; Eiras, S. P.; Albuquerque, Y. D. T; Richter, E. M.; J. Braz. Chem. Soc.
2009, 20, 1249.
35. dos Santos, W. T. P.; Gimenes, D. T.; Richter, E. M.; Angnes, L.; Quim. Nova2011, 34, 1753.
36. dos Santos, W. T. P.; Azevedo E. F.; Richter, E. M.; Albuquerque, Y. D. T.; Quim. Nova2009, 32, 2412.
37. Pedrotti, J. J.; Angnes, L.; Gutz, I. G. R.; Electroanalysis1996, 8, 673.
38. Gandini, D.; Michaud, P. A.; Duo, I.; Mahe, E.; Haenni, W.; Perret, A.; Comninellis, C.; New Diamond Front. Carbon
Technol.1999, 9, 303.
39. Salazar-Banda, G. R.; de Carvalho, A. E.; Andrade, L. S.; Rocha-Filho, R. C.; Avaca, L. A.; J. Appl. Electrochem.2010, 40, 1817.
40. dos Santos, W. T. P.; Ceolin, M. P.; de Albuquerque, Y. D. T.; Richter, E. M.; Quim. Nova 2007, 30, 1754.
41. Özkan, S. A.; Uslu, B.; Zuman, P.; Anal. Chim. Acta2004, 501, 227.
Submitted: June 19, 2012