0103 - 5053 $6.00+0.00
S
ho
rt
R
e
p
o
rt
* e-mail: [email protected]
New Spectral Data of Some Flavonoids from Deguelia hatschbachii A.M.G. Azevedo
Aderbal F. Magalhães*,a, Ana M. G. A. Tozzi b, Eva G. Magalhães a and Valéria R. de S. Moraes a
a
Instituto de Química, Universidade Estadual de Campinas, CP 6154, 13084-971 Campinas - SP, Brazil
b
Instituto de Biologia, Universidade Estadual de Campinas, CP 6109, 13083-970 Campinas - SP, Brazil
Entre os flavonóides isolados de Deguelia hatschbachii1 encontram-se escandenina (1), robustato
de metila (2) e 4’,5-diidroxi-6-(3,3-dimetilalila)-7-metoxiflavanona (3)que foram identificados pela comparação dos dados espectroscópicos previamente publicados. A obtenção de novos dados espectroscópicos (RMN, RMN-2D e EM/EM) permitiu a atribuição dos deslocamentos químicos de todos os hidrogênios e carbonos nos espectros de RMN 1H e 13C destas substâncias, assim como
a elucidação dos caminhos de fragmentação de 1-3 no espectrômetro de massas.
From the roots of Deguelia hatschbachii, the known flavonoids scandenin(1), methyl robustate (2)and 4’,5- dihydroxy-6-(3,3-dimethylalyll)-7-methoxy flavanone (3) were isolated and characterized by comparison of their spectroscopic data with those found in the literature. Now the inclusion of 1D- and 2D-NMR and MS/MS data has allowed the complete assignment of all hydrogen and carbon chemical shifts in their NMR spectra, as well as the elucidation of the fragmentation pathways of 1-3 in the mass spectrometer.
Keywords: Deguelia hatschbachii, Leguminosae, 4-hydroxy-3-phenylcoumarins, flavanone
Introduction
Deguelia hatschbachii A. M. G. Azevedo (Leguminosae-Fabaceae) is a new species native to Brazil. It is a medium sized tree, 3-6 m in height, with pink flowers and can be found in the East-south of Minas Gerais State and in the region of Mata Atlântica along the states of Espírito Santo, Rio de Janeiro and São Paulo.
In a previous report1 we described the structural
determination of five new compounds, which were isolated together with eight known ones from the roots of D. hatschbachii.
Since the 1H and 13C NMR literature data for
compounds 1-3 are incomplete (Figure 1), in this paper we report the complete assignment of 1H and 13C NMR spectral
data of 1-3 by using 1D- and 2D- NMR techniques as well as the fragmentation pathways of 1 and 3 in the mass spectrometer, based on MS/MS experiments.
Experimental
General experimental procedures
1H NMR (300 and 500 MHz), 13C NMR (75 MHz), 1 H-13C HETCOR J1
CH and
1H-13C COLOC Jn
CH (n=2 and 3)
spectra were recorded using BRUKER AC 300/P, GEMINI 2000 (VARIAN), GEMINI 300 BB (VARIAN) and INOVA 500 (VARIAN) spectrometers, with TMS as internal standard and CDCl3 as solvent. Chemical shifts (δ) are in
electron ionization technique at 70 eV (linked scan at 8KeV collisions with Helium).
Plant material, extraction and isolation1
4 , 4 ’ d i h y d ro x y 3 p h e n y l 5 m e t h o x y 6 ( 3 , 3 -dimethylallyl)-2”,2”-dimethylchromene (5”,6”:8,7)-coumarin (1, Scandenin). 1H NMR spectral data (300 MHz,
CDCl3/TMS): Table 1. 13C NMR spectral data (75 MHz,
CDCl3): Table 2. EIMS (probe) 70 eV, m/z (rel. int.): 434 [M]+ (100), 419 [M-Me]+ (70), 391 [M-Me-CO]+ (4), 379
[M-55]+ (3), 363 [M-Me-56]+ (3), 300 [M-134]+ (7), 285
[M-134-Me]+ (66), 245 [M-189]+ (12), 257
[M-134-Me-CO]+ (12).
4, 5, 4’-trimethoxy-3-phenyl-2”, 2”-dimethylchromene (5”, 6”: 6,7) coumarin (2, Methyl robustate). 1H NMR
spectral data (300 MHz, CDCl3/TMS): Table 1. 13C NMR
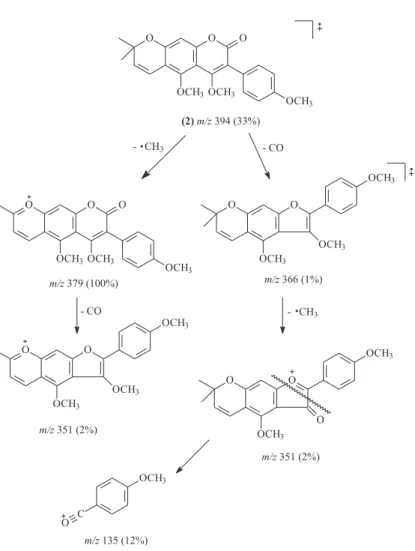
spectral data (75 MHz, CDCl3): Table 2. EIMS (probe) 70 eV, m/z (rel. int.):394 [M]+ (33), 379 [M-Me]+ (100), 366
[M-CO]+ (1), 351 [M-CO-Me]+ (2), 135 [M-CO-Me-216]+
(12).
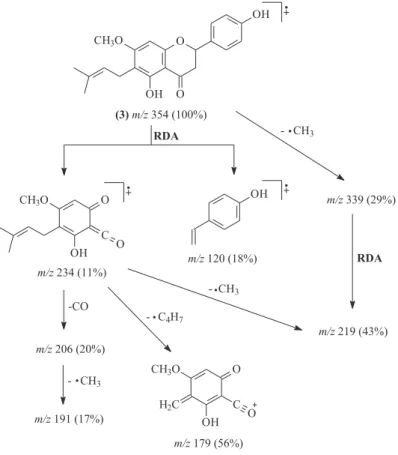
5, 4’-dihydroxy-6-(3,3-dimethylallyl)-7-methoxy-flavanone (3).1H NMR spectral data (500 MHz, CDCl
3/
TMS): Table 1. 13C NMR spectral data (75 MHz, CDCl 3):
Table 2. EIMS (probe) 70 eV, m/z (rel. int.): 354 [M]+ (100),
339 [M-Me]+ (29), 311 [M-Me-CO]+ (28), 299 [M-55]+
(27), 234 [M-120]+ (11), 219 [M-120-Me]+ (43), 206
[M-120-CO]+ (20), 191 [M-120-CO-Me]+ (17), 179 [M-175]
(56), 120 [M-234]+ (18), 119 [(M+H)- 234]+ (8), 91
[(M+H)-234-CO]+ (13).
Results and Discussion
Scandenin 1 was previously isolated from Derris
spruceana2 and Derris scandens.3 We now report, for the
first time, its 13C NMR spectral data (Table 2). The carbon
resonances were identified by extensive 2D- NMR correlation experiments [HETCOR and COLOC] (Table 3). Based on MS/MS experiments selecting the ions of m/z 419 [391 (6%), 285 (100%)], m/z 300 [285 (100%), 269 (22%), 257 (48%), 245 (65%), 229 (17%)] e m/z 134 [106 (100%)] we can confirm the fragmentation pathway4
for this compound (Figure 2).
Methyl robustate 2 was previously isolated from Derris robusta5 when only UV, IR and low resolution 1H NMR
(60 MHz) spectral data were reported. We now include 1H
(300 MHz), 13C NMR data (Tables 1 and 2) and the
fragmentation pathway for this compound (Figure 3).
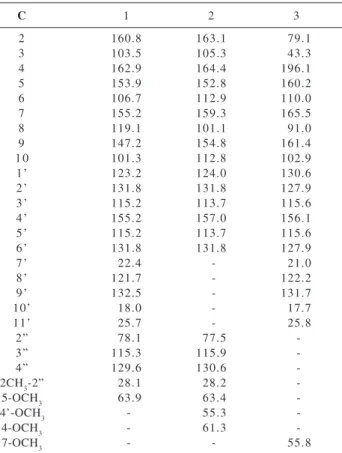
Table 2. 13C NMR values (75 MHz, CDCl
3) of
4-hydroxy-3-phenylcoumarins 1, 2 and flavanone 3
C 1 2 3
2 160.8 163.1 79.1
3 103.5 105.3 43.3
4 162.9 164.4 196.1
5 153.9 152.8 160.2
6 106.7 112.9 110.0
7 155.2 159.3 165.5
8 119.1 101.1 91.0
9 147.2 154.8 161.4
1 0 101.3 112.8 102.9
1 ’ 123.2 124.0 130.6
2 ’ 131.8 131.8 127.9
3 ’ 115.2 113.7 115.6
4 ’ 155.2 157.0 156.1
5 ’ 115.2 113.7 115.6
6 ’ 131.8 131.8 127.9
7 ’ 22.4 - 21.0
8 ’ 121.7 - 122.2
9 ’ 132.5 - 131.7
10’ 18.0 - 17.7
11’ 25.7 - 25.8
2” 78.1 77.5
-3” 115.3 115.9
-4” 129.6 130.6
-2CH3-2” 28.1 28.2
-5-OCH3 63.9 63.4
-4’-OCH3 - 55.3
-4-OCH3 - 61.3
-7-OCH3 - - 55.8
Table 1.1H NMR values of 4-hydroxy-3-phenylcoumarins 1,2 and flavanone 3
Scandenin 1a Methyl robustate 2a Flavanone 3b
H δ δ δ
2”-2CH3 1.47 (6H, s) 1.47 (6H, s)
-11’ 1.71 (3H, s) - 1.69 (3H, s)
10’ 1.79 (3H, s) - 1.78 (3H, s)
3 eq - 2.76 (1H, dd, J 17.1 and 2.2)
3 ax - - 3.08 (1H, dd, J 17.1 and 13.4)
7 ’ 3.33 (2H, d, J 6.7) - 3.27 (2H, d, J 6.3)
4-OCH3 - 3.56 (3H, s)
-5-OCH3 3.93 (3H, s) 3.82 (3H, s)
-7-OCH3 - 3.82 (3H, s)
2 - - 5.30 (1H, dd, J 13.4 and 2.2)
8 - 6.62 (1H, d, J 0.7) 6.07 (1H, s)
4’-OCH3 - 3.85 (3H, s)
-8 ’ 5.17 (1H, m) - 5.20 (1H, tl, J 6.3)
OH-4’ 5.17 (1H, sl) -
-3” 5.69 (1H, d, J 10.0) 5.71 (1H, d, J 10.2)
-4” 6.90 (1H, d, J 10.0) 6.65 (1H, dd, J 10.2 and 0.7)
-3’ and 5’ 6.89 (2H, d, J 8.6) 6.97 (2H, d, J 8.9) 6.88 (2H, d, J 8.2) 2’ and 6’ 7.42 (2H, d, J 8.6) 7.41 (2H, d, J 8.9) 7.29 (2H, d, J 8.2)
OH-4 10.21 (1H, s) -
-OH-5 - - 12.03 (1H, s)
a1H NMR values (300 MHz); b1H NMR values (500 MHz).
Table 3. Observed correlation in HETCOR (vicinal C-H) and in COLOC (long-range C-H) spectra (CDCl3, 7 Tesla) of 1
H (δ) C (δ,J1) C (δ,Jn)
HO-4 (10.21) - 3 (103.5)
2’ (7.42) 2’ (131.8) 4’(155.2) 3’ (6.89) 3’ (115.2) 1’(123.2) 5’ (6.89) 5’ (115.2) 1’(123.2) 6’ (7.42) 6’ (131.8) 4’(155.2)
4” (6.90) 4” (129.6)
-3” (5.69) 3” (115.3)
-7’ (3.33) 7’ (22.4) 7 (155.2); 5 (153.9); 8’(121.7); 8 (119.1)
8’ (5.17) 8’ (121.7)
-H3CO-5 (3.93) H3CO-5 (63.9) 5 (153.9) 10’ (1.79) 10’ (18.0) 9’(132.5); 8’(121.7);
11’(25.7) 11’ (1.71) 11’ (25.7) 9’(132.5); 8’(121.7);
10’(18.0) 2”-2CH3 (1.47) 2”-2CH3 (28.1) 2” (78.1); 4”(129.6)
The 1H NMR spectrum of compound 3 showed the same
absorptions found for the flavanone previously isolated from Lonchocarpus minimiflorus,6 when only MS and low
resolution 1H NMR (90 MHz) spectral data were reported.
Table 5. Observed correlation in HETCOR (vicinal C-H) and in COLOC (long-range C-H) spectra (CDCl3, 7 Tesla) of 3
H (δ) C (δ, J1) C (δ, Jn)
HO-5 (12.03) - 5 (160.2); 6 (110.0)
2 (5.30) 2 (79.1)
-3 (-3.08) 3 (43.3) 2(79.1); 4 (196.1)
3 (2.76) 3 (43.3) 4 (196.1)
8 (6.07) 8 (91.0) 10 (102.9); 9 (161.4) 2’ (7.29) 2’ (127.9) 4’(156.1)
3’ (6.88) 3’ (115.6) 1’(130.6) 5’ (6.88) 5’ (115.6) 1’(130.6)
6’ (7.29) 6’ (127.9) 4’(156.1) 7’ (3.27) 7’ (21.0) 5 (160.2); 6 (110.0)
8’ (5.20) 8’ (122.2)
-H3CO-7 (3.82) H3CO-7 (55.8) 7 (165.5)
10’ (1.78) 10’ (17.7) 8’(122.2); 9’(131.7)
11’ (1.69) 11’ (25.8) 8’(122.2); 9’(131.7)
Table 4. Observed correlation in COSY (H-H) spectra (CDCl3, 7 tesla) of 3
H (δ) H (δ, Jn)
2’ and 6’ (7.29) 3’ and 5’ (6.88) 2 (5.30) 3ax (3.08) and 3eq (2.76)
8’ (5.20) 7’ (3.27)
3ax (3.08) 3eq (2.76)
7’ (3.27) 10’ (1.78); 11’ (1.69)
Based on MS/MS experiments selecting the ions of m/z 339 [219 (26%)], m/z 206 [191 (27%)] and m/z 234 [219 (41%), 206 (11%), 191 (5%), 179 (24%)] we can suggest a fragmentation pathway for this compound (Figure 4).
Conclusions
The combination of 1D- and 2D-NMR techniques has allowed the complete assignment of the 1H and 13C spectral
Figure 4. Fragmentation pathway of flavanone 3, based on MS/MS experiment.
data of the known flavonoids 1-3, until now not found in the literature.
Our results will fill the gap in literature data for these compounds, which are rarely found in nature and can be used to facilitate further assignments of other analogous flavonoids.
Acknowledgments
The authors are grateful to Brazilian agencies CNPq and CAPES for scholarships awarded to Dr. V. R. S. M. and to FAPESP for financial support.
References
1. Magalhães, A. F.; Tozzi, A. M. G. A.; Magalhães, E. G.; Moraes, V. R. D.; Phytochemistry2001, 57, 77.
2. Garcia, M.; Kano, M. H. C.; Vieira, D. M.; do Nascimento, M. C.; Mors, W. B.; Phytochemistry 1986, 25, 2425.
3. Clark, E.P.; J. Org. Chem.1943, 8, 489.
4. Pelter, A.; Stainton, P.; Johnson, A. P.; Barber, M.; J. Heterocycl. Chem.21965, 256.
5. Johnson, A.P.; Pelter, A.; J. Chem. Soc. (C)1966, 606. 6. Mahmoud, E. N.; Waterman, P. G.; J. Nat. Prod. 1985, 48,
648.
Received: August 27, 2001
Published on the web: October 29, 2002

![Table 2. EIMS (probe) 70 eV, m/z (rel. int.): 354 [M] + (100), 339 [M-Me] + (29), 311 [M-Me-CO] + (28), 299 [M-55] + (27), 234 [M-120] + (11), 219 [M-120-Me] + (43), 206 [M-120-CO] + (20), 191 [M-120-CO-Me] + (17), 179 [M-175]](https://thumb-eu.123doks.com/thumbv2/123dok_br/18989801.460218/2.892.203.666.614.1053/table-eims-probe-ev-rel-int-m-m.webp)