Article
Printed in Brazil - ©2017 Sociedade Brasileira de Química0103 - 5053 $6.00+0.00*e-mail: [email protected]
Synthesis of TiO
2/SiO
2-B
2O
3Ternary Nanocomposites: Influence
of Interfacial Properties on their Photocatalytic Activities with
High Resolution Mass Spectrometry Monitoring
Susana F. Resende, Rafael L. Gouveia, Bernardo S. Oliveira, Wander L. Vasconcelos and Rodinei Augusti*
Universidade Federal de Minas Gerais, Av. Antônio Carlos, 6627, Pampulha, 31270-901 Belo Horizonte-MG, Brazil
An investigation on unusual interface properties of unprecedented ternary composites, formed by the inclusion of assorted proportions of B2O3 into TiO2/SiO2 structure, is conducted herein. The
influences of B2O3 content and calcination temperature were evaluated. The precursor TiO2/SiO2
material was synthesized via a simple sol-gel procedure that was followed by B2O3 inclusion
via maceration and calcination. The materials were fully characterized and their photocatalytic performance to degrade the Indigo Carmine dye investigated. The material prepared with a B/Ti molar ratio of 1 and at calcination temperature of 350 °C (B1-350) showed the best performance, with
a superior photocatalytic activity than that of commercial TiO2. The presence of B2O3-TiO2-SiO2
interfaces in the structure of such material was of critical importance in producing a material with these attractive features. Finally, high resolution mass spectrometry monitoring allowed for the characterization of the main degradation products formed under these conditions.
Keywords: B2O3-TiO2-SiO2 ternary nanocomposites, structural defects, photocatalytic activity,
degradation of Indigo Carmine, by-products characterization, high resolution mass spectrometry
Introduction
In recent years, several investigations1,2 have been
dedicated to the improvement of the photocatalytic performance of TiO2. This is due to its appealing properties,
such as strong oxidizing ability for the decomposition of organic pollutants, remarkable chemical stability and low cost/toxicity.3 However, some drawbacks, such as its
relatively large energy band gap (3.2 and 3.0 eV for anatase and rutile, respectively) and its low quantum yield, prevent its further application in photocatalytic processes.4 Hence,
a variety of strategies has been developed in an attempt to produce modified materials with a superior photocatalytic proficiency.5
In this context, the incorporation of other oxides, such as SiO2, ZrO2, WO3 and Al2O3, into the TiO2 structure has
been widely studied.6-10 It is well-known that the addition
of SiO2 to TiO2 improves the specific surface area (SSA)
of the modified material, thus, increasing the adsorption rate of organic pollutants.11 In our previous work,12 it
was shown that the presence of SiO2 inhibits the growth
of the anatase crystals during TiO2 calcination, retarding
the transformation of anatase to rutile phase. Guan et al.13
suggested that the addition of SiO2 can increase the
concentration of hydroxyl groups on the TiO2 surface,
resulting in samples with improved photocatalytic and hydrophilic properties. All of these factors can lead to an increase in the number of active sites, as well as a better efficiency for the separation of photogenerated charges, thus enhancing the photocatalytic activity, as proven by several studies.14,15
B2O3 is another oxide that has been incorporated into
the TiO2 structure to produce a material with superior
performance. This possibility has been reported, however, in just few studies.16-18 To the best of our knowledge, a
detailed study regarding the role of the B2O3-TiO2 interfaces
on the superior photocatalytic activity of this type of material is unprecedented.
Taking into account these remarks, the synthesis of TiO2/SiO2-B2O3 ternary nanocomposites is reported
hydrothermal and calcination treatments, and characterized by nitrogen sorption tests, X-ray diffraction (XRD), diffuse reflectance spectroscopy (DRS), Fourier transform infrared spectroscopy (FTIR) and scanning electron microscopy (SEM). The performance of all synthesized TiO2/SiO2-B2O3
nanocomposites towards the photodegradation of a prototype pollutant (Indigo Carmine dye) in an aqueous solution and under irradiation, provided by a commercial fluorescent lamp, was measured by UV-Vis spectrometry. Chemical structures of the by-products formed under these conditions were proposed based on the data obtained via a direct monitoring by electrospray ionization high-resolution mass spectrometry (ESI-HRMS). The mineralization rate was also estimated by measuring the oxygen consumption. Indigo Carmine was chosen as a prototype substrate because it is a synthetic dye widely used as a coloring agent or additive in industry. Moreover, it is quite harmful to aquatic life and often used as a model pollutant in photocatalytic studies due to its advantageous characteristics, such as ease of access, low cost and easy degradation monitoring by UV-Vis spectrophotometry. The photocatalytic activity of the best material was then compared with those provided by two types of commercially available TiO2: TiO2 (99%
anatase) and TiO2 P25 (80% anatase, 20% rutile).
Experimental
Synthesis
T h e P l u r o n i c® F 1 2 7 t r i b l o c k c o p o l y m e r
[(EO)106(PO)70(EO)106, M: 12600] was used as a structural
directing agent. Titanium(IV) isopropoxide (TIP), tetraethoxysilane (TEOS) and boric acid (H3BO3) were
used as precursors for TiO2, SiO2 and boron, respectively.
Sulfuric acid (H2SO4) and 2,4-pentanedione (acac)
were employed as acidifying and complexing agents, respectively. All reagents were purchased from Sigma-Aldrich and used as received without additional treatment. To conduct the comparative photocatalytic tests, the following commercial materials were evaluated: TiO2 (99%
anatase) from Sigma-Aldrich, and TiO2 P25 (80% anatase,
20% rutile) from Evonik.
Initially, 1.64 g of the F127 copolymer was dissolved in 100 mL of deionized water (at 40 °C) containing H2SO4
sufficient to maintain the pH value at approximately 0.65. After complete the copolymer dissolution, 4.1 mmol of TEOS were added to this solution, which was kept under constant stirring. To this solution, it was added a mixture of TIP (41.4 mmol) and acac (41.4 mmol) under vigorous stirring. The final solution was then maintained at 55 °C for 2 h without stirring. After several minutes, a light
yellow colloidal suspension was formed. The hydrothermal treatment was conducted by leaving the as-prepared suspension at 110 °C for 6 h. The resulting solid (consisting of TiO2/SiO2 nanocomposite particles) was filtered and
washed with water and then dried overnight in an oven at 60 °C.
To obtain the TiO2/SiO2-B2O3 nanocomposites, the
TiO2/SiO2 particles were ground with different amounts of
H3BO3 and calcined at different temperatures (350, 450 or
550 oC). The nomenclature for the synthesized materials
was Bx-y, where x is the molar ratio B/Ti (RB) and y is the
calcination temperature. Therefore, the calcined samples at 450 °C, B0-450, B0.125-450, B0.25-450, B0.5-450, B1-450, B2-450 and
B4-450, were prepared using RB of 0, 0.125, 0.25, 0.5, 1, 2
and 4, respectively. On the other hand, the B1-350, B1-450 and
B1-550 samples were prepared using RB = 1 and calcination
temperatures of 350, 450 and 550 °C, respectively. Commercial TiO2 were named anatase (TiO2
Sigma-Aldrich) and P25 (TiO2 Evonik). The SiO2/TiO2 molar ratio
was kept constant at 0.1 for each nanocomposite, whereas the B/Ti molar ratio (RB) was varied from 0 to 4.
Characterizations
Nitrogen sorption tests were performed in an Autosorb-1C apparatus. Samples used in these analyses were previously degassed at 130 °C for up to 48 h under vacuum. SSA and pore size distribution were assessed by the multipoint BET (Brunauer, Emmett and Teller) and NLDFT (non-local density functional theory) methods, respectively. XRD analysis was carried out in a Philips-PANalytical PW17-10 diffractometer using Cu Kα radiation and operating at 40 kV and 40 mA. XRD patterns were collected in the 2θ range of 10 to 90°, using a scan velocity of 0.06 degree min-1. The identification of
the crystalline phases was performed using the JCPDS (International Centre for Diffraction Data®) file numbers
21-1272 and 30-0199 for anatase and sassolite (H3BO3),
respectively. The TiO2 crystallite size was assessed using
the Scherrer equation and considering XRD peaks at 25.3° for anatase. Diffuse reflectance spectra were obtained in a UV-Vis-NIR instrument (Hitachi model U-3501) with the diffuse reflectance accessory equipped with an integrating sphere. BaSO4 was used as reference material
and for sample dilutions. The gap values were calculated using the Kubelka-Munk function. Samples for the FTIR spectra were prepared as pellets with KBr and examined in a FTIR/FIR spectrometer (PerkinElmer model Frontier). The spectra were recorded from 4000 to 350 cm-1, with
resolution of 4 cm-1 and acquisition of 128 scans. SEM
gun scanning electron microscope (FEG-SEM). Samples were sputtercoated with a carbon layer of about 5 nm thickness before the SEM analysis.
Photocatalytic tests
The photocatalytic activities of the TiO2/SiO2-B2O3
nanocomposites were estimated by measuring the rate of degradation of the Indigo Carmine dye in aqueous suspension. The degradation tests were preceded by adsorption tests in the absence of light. Photolysis, hydrolysis and tests with pure B2O3 were also performed
as controls. All photocatalytic tests were performed in triplicate in order to evaluate reproducibility. The reactor used for the photocatalytic tests consisted of a wooden box coated with aluminum foil. The dimensions of the reactor were 55 cm height, 85 cm length and 30 cm depth (Figure S1, in the Supplementary Information (SI) section, shows the design of the reactor). In a typical run, 30 mg of the ternary nanocomposite were added to 250 mL of Indigo Carmine solution (10 mg L-1). This
suspension was kept under constant magnetic stirring and submitted to irradiation by a commercial fluorescent lamp (power of 32 W, Taschibra model TKS 32-1 NJY). The emission spectrum of this lamp is provided in Figure S2 (in the SI section). Aliquots of 5 mL were collected at the following times: 0, 5, 15, 30, 45, 60, 90 and 120 min. The aliquots were centrifuged at 4000 rpm for 10 min in a model Centribio 80-2B centrifuge. The supernatant was collected and filtered through a disposable filter unit for syringes (Millex®, PVDF, Ø = 0.45 µm). The Indigo
Carmine concentration in each aliquot was estimated using a UV-Vis spectrophotometer (Varian, model Cary 50 Conc) working at 610 nm (λmax for Indigo Carmine). Full scan UV-Vis spectra (from 300 to 700 nm) were also recorded for some samples. The apparent reaction rate constant (kapp)
for each material was calculated during the first 60 min of reaction and by considering a pseudo-first order model. The pH value of the solution, monitored by a pHmeter (HANNA model HI98128), remained roughly constant (approximately 4.5) during the experiment. Chemical structures of the by-products were proposed based on the data obtained via direct infusion ESI-HRMS analyzes. The analyses were performed on a hybrid mass spectrometry system. The mass spectrometer (IT-TOF, Shimadzu Corporation, Kyoto, Japan) provides high sensitivity and accuracy with a resolving power over 10,000. The mass spectrometer was equipped with an electrospray ionization (ESI) source operating in the negative (–3.5 kV) mode and with a nebulizer gas (N2) at a flow rate of 1.5 L min-1. The
interface and CDL (curved dessolvation line) were operated
at constant temperature of 200 °C. A mass-to-charge (m/z) range of 100-500 was recorded for each aliquot. The samples (10 µL) were directly infused into the ESI source via an autosampler. Mineralization rates were estimated according to the oxygen consumption method that makes use of potassium permanganate to oxidize the organic material in solution. A detailed description about this procedure is provided in the directive NBR 10739/1989.19
Chemical oxygen demand (COD) and total organic carbon (TOC) methods could not be applied herein due to the low concentrations of Indigo Carmine employed.
Results and Discussion
B/Ti molar ratio (RB)
Figure 1 shows the XRD patterns obtained for the produced materials, i.e., B0-450, B0.125-450, B0.25-450, B0.5-450,
B1-450, B2-450 and B4-450. As noted, all samples showed anatase
as the crystal phase, whereas no peaks associated with the brookite or rutile phases were found. The peaks at 14.58 and 27.94° (2θ) confirm the formation of the boron trioxide (B2O3) crystalline phase.
Table 1 shows the physicochemical properties of the synthesized and commercial materials. Compared with B0-450, the TiO2/SiO2-B2O3 nanocomposites (B0.125-450,
B0.25-450, B0.5-450, B1-450, B2-450 and B4-450) display no significant
changes in the crystallite size, confirming the results presented in Figure 1. The presence of SiO2 and the
formation of B2O3 phase may obstruct the nucleation of
anatase nanoparticles, allowing only a slight increase in the average crystallite size. As seen in Table 1, the gap value oscillated between 3.32 and 3.29 eV for the B0-450 to B4-450
materials. This finding indicates that the B2O3 incorporation
has no significant influence on this parameter. The data displayed in Table 1 for the B0-450 to B4-450 materials also
indicate that an increase in RB causes a decrease in SSA and
in the average pore size. That is probably because the B2O3
phase deposited on the nanocomposite surface blocks the pores of the material leading to the reduction in the values of both parameters.
Figure 2 shows the FTIR analysis of the B0-450, B0.125-450,
B0.25-450, B1-450 and B4-450 materials. The bands at 3400 and
1630 cm-1 are attributed to vibrations of surface water and
O–H stretching.20 The band at approximately 3220 cm-1 can
be attributed to B–O bond vibrations.20 In fact, the intensity
of this band increases by increasing RB. The bands between
2260 and 2510 cm-1 are related to B–H vibrations.21 The
bands at 1440 and 1200 cm-1 are associated with the B–O
bond in boroxol rings.20,22,23 At 1125 and 1050 cm-1, a Si–O–Si
1200 cm-1), C–O vibrational modes may also appear due
to organic waste from the syntheses. The broad band between 900 and 400 cm-1 is associated with the vibrational
modes of Ti–O in TiO2.23,24 Finally, the increasing of RB
causes the appearance of bands at 810 and 540 cm-1 (B–O
deformation) and 644 cm-1 (stretching B–B).25 Note that
the appearance of these bands decreases the intensity of the TiO2 band, corroborating to the proposal of a thick B2O3
layer deposited on the TiO2/SiO2 nanocomposites particles.
SEM micrographs of B0-450, B1-450 and B4-450 are displayed
in Figure S3 (in the SI section). In these images, changes in the morphology of the particles are clearly observed.
Figure 3 shows the results of the tests dealing with the photocatalytic activities of the TiO2/SiO2-B2O3 materials.
The kapp and R2 (determination coefficient) values of each
material are shown in Table 1. The adsorption-desorption equilibrium was reached after 30 min. The activity increases with RB until it reaches a maximum in RB = 1 (B1-450).
Taking into account that this sample does not have the highest SSA (Table 1), these results therefore seem to indicate that the presence of an interfacial B2O3 phase is
essential to produce materials with enhanced photocatalytic activities. For the material B1-450, the B2O3 layer, which is
deposited on the surface of the nanoparticles and is part of
Table 1. Physicochemical properties of the synthesized (B0-450, B0.125-450, B0.25-450, B0.5-450, B1-450, B2-450, B4-450, B1-350 and B1-550) and commercial materials (TiO2-anatase and TiO2-P25)
Sample SSA /
(m2 g-1)
Pore size / nm
Pore volume / (cm3 g-1)
Crystallite size / nm
Gap / eV
kapp /
min-1 R2
B0-450 159.00 5.90 0.2065 14.46 3.32 0.0027 0.9934
B0.125-450 115.90 5.90 0.1736 14.46 3.31 0.0059 0.9998
B0.25-450 105.70 5.30 0.1642 14.14 3.30 0.0088 0.9859
B0.5-450 56.97 5.30 0.0984 14.26 3.32 0.0107 0.9900
B1-450 9.33 5.30 0.0182 14.60 3.31 0.0164 0.9901
B2-450 0.67 4.18 0.0020 14.66 3.31 0.0093 0.9898
B4-450 0.86 1.69 0.0012 17.88 3.29 0.0030 0.9863
B1-350 7.66 5.90 0.0105 12.05 3.30 0.0227 0.9916
B1-550 6.64 6.81 0.0158 24.09 3.29 0.0042 0.9935
Hydrolysis – – – – – 0.0000008 0.9949
Photolysis – – – – – 0.0003 0.9866
B2O3 – – – – – 0.00009 0.9898
TiO2-anatase 11a – – 68.08a 3.29 0.0049 0.9975
TiO2-P25 50 ± 15a – – 21a 3.29 0.0113 0.9929
aData provided by the manufacturer. Gap: energy band gap; R2: determination coefficient.
Figure 1. XRD patterns for the B0-450 to B4-450 materials. The letters ‘A’ and ‘B’ indicate peaks attributed to the anatase crystalline phase and sassolite (B2O3), respectively.
an interface with the other two oxides, helps to improve the degradation rate due to the formation of traps for the photogenerated charges.4 However, for the materials with
RB > 1 (B2-450 and B4-450), these traps drastically increase and
act as centers of charge recombination, which disfavors the photocatalytic process.22 Furthermore, for these materials
(B2-450 and B4-450), the thicker B2O3 layer probably hampers
the radiation to reach the TiO2 surface.16 The difference in
activity of these materials, as well as the results obtained by mass spectrometry (discussed following in this paper), confirms that the dye did not act as a sensitizer agent for the photocatalysts. The B1-450 sample was therefore chosen as
the prototype material to be further evaluated, as following described in this article.
Effect of calcination temperature
Figure 4 shows the XRD patterns recorded for the B1-350,
B1-450 and B1-550 samples. As the calcination temperature
increases, narrow peaks emerge indicating a higher crystallinity, which can be confirmed by the increase in the average crystallite size (Table 1). Moreover, the rutile phase is not detected, even at 550 °C, corroborating the previous assumption that SiO2 and B2O3 can suppress diffusion
between the anatase particles, thus, limiting anatase to rutile transformation. It was verified that the calcination temperature has no evident effect in the gap value. However, the B1-350 and B1-550 samples showed higher average pore size
and lower SSA than B1-450. Hence, the calcination at 350 °C
is probably not sufficient to remove the organic residues that can block the smaller pores and yields a material with a higher average pore size and a smaller SSA. At higher temperatures (550 °C), however, the formation of larger nanoparticles results in the closing of the smaller pores,
thus, leading to an increase of the average pore size and a reduction of SSA. The FTIR analysis of the B1-350, B1-450 and
B1-550 samples (not shown) presents the same profile as that
shown in Figure 2 for B1-450. The only exception was the
reduction in the intensities of the bands at approximately 3400 and 1630 cm-1 from B
1-350 to B1-550 that indicates the
loss of water at higher temperatures.20
The results for the photocatalytic activities of B1-350,
B1-450 and B1-550 samples is displayed in Table 1 (kapp and R2)
and Figure 3. These data indicate that higher calcination temperatures cause a decrease in the degradation rate. After 90 min, the B1-350 and B1-450 samples showed
degradation rates of almost 100%, while the B1-550
sample showed approximately 40% degradation. Higher temperatures improve the average crystallite size, which increases not only the distance that photogenerated charges must overcome to reach the surface but also the charge recombination rate.26 The reduction of SSA at
higher temperatures also minimizes the availability of active sites. Furthermore, full scan absorption spectra (not shown) of the reaction aliquots (from 300 to 700 nm) indicate no formation of by-products that absorb in the visible region. Therefore, the absorbance at 610 nm (the λ
max of Indigo Carmine) was a reliable measurement to
determine the concentration of the remaining dye in solution.
Analyzes by direct infusion electrospray ionization high resolution mass spectrometry (ESI-HRMS) was conducted aiming at detecting at least the most abundant by-products, probably formed under these conditions. ESI-HRMS is a key technique for the identification of by-products resulting from the degradation of water
Figure 3. Photocatalytic activities of the degradation of the Indigo Carmine dye in aqueous solution for the TiO2/SiO2-B2O3 materials.
contaminants, and therefore has played an important role in elucidating degradation pathways.27 Figure 5 shows
the mass spectra (negative mode) of aliquots collected at times 0 and 120 min for the three photocatalytic systems (B1-350, B1-450 and B1-550). Note that the mass spectra for such
photocatalytic systems showed the same profile, the only difference being the relative intensity of each ion. In the mass spectrum of the initial aliquots, the following ions that refer to Indigo Carmine are clearly noticed (Table 2 and Figure 5): m/z 209.9863 (doubly-deprotonated Indigo Carmine: [C16H8N2O8S2]2– or [IC]2–), and m/z 442.9626
(mono-deprotonated Indigo Carmine: [C16H9N2O8S2]– or
[IC + H]–).
Non-covalent species derived directly from Indigo Carmine are also detectable in this mass spectrum (Table 2 and Figure 5): [(IC)2 + H]3– of m/z 287.6452 and
[(IC)3 + 2H]4– of m/z 326.4745. After 120 min of exposure
to the photocatalytic systems, these anions are no longer detected only in the mass spectrum of the aliquot collected
from the B1-350 system. These results confirm therefore
that the B1-350 photocatalyst possesses indeed a superior
efficiency to degrade Indigo Carmine in comparison to the other systems (B1-450 and B1-550). The emergence of
extra anions (not detectable in the original solutions) in the mass spectra of the aliquots collected after an exposure time of 120 min is attributed to the formation of by-products (Figure 5). Table 2 displays a list of these anions and their respective molecular formula. The errors between the theoretical and experimental m/z values were smaller than 11.24 ppm and then support the proposed molecular formula. All these by-products originate from an initial oxidation of the Indigo Carmine molecule followed by successive oxidation/ring hydroxylations. Note, as expected, that the mass spectrum of the B1-350 aliquot
exhibit these by-products at higher intensities than in the mass spectra of the other systems. Finally, based on these experimental data as well as on previous studies reported in the literature, a route for the degradation of Indigo Carmine
in aqueous medium by the three photocatalytic systems could therefore be proposed, as displayed in Figure 6.27,28
Due to its superior photocatalytic efficiency, the B1-350
sample was selected to accomplish comparative tests with commercial TiO2.
Photocatalytic efficiency: comparative tests
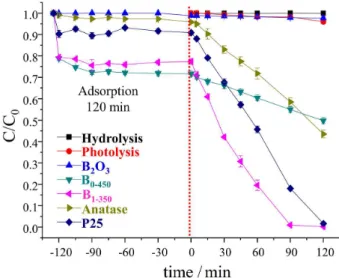
To conduct the comparative tests, the commercial materials (anatase and P25) were evaluated. Table 1 and Figure 7 summarize the results of the photocatalytic activities of these materials as well as B0-450, B1-350 and
controls tests. Note that the control experiments did not
produce any significant degradation of the Indigo Carmine dye. The B1-350 material proved to be more effective than
both commercial samples, with a kapp that is twice that of
P25. The B1-350 sample has a lower SSA than the other
materials, proving that the B2O3-TiO2-SiO2 interfaces (by
reasons previously stated) probably explains this superior photocatalytic activity.
Finally, data on oxygen consumption indicated that that only the B0.5-450, B1-450, B2-450, B1-350, anatase and P25
systems were able to cause mineralization, but at low rates. Moreover, the systems comprised by P25 (the most widely used photocatalyst) and B1-350 yielded the best results, i.e.,
rates of about 11.5%.
Table 2. High-resolution mass spectrometry data and molecular formula inferred for the by-products generated during the photodegradation of Indigo Carmine dye in water by the three photocatalytic systems: B1-350, B1-450 and B1-550
Anion Molecular formulae m/z (theoretical) m/z (experimental) Error / ppm DBE
Anions derived from Indigo Carmine dye (IC)
[IC]2– C
16H8N2O8S2 209.9867 209.9863 –1.90 13.0
[IC + H]– C
16H9N2O8S2 442.9625 442.9626 0.23 13.0
[(IC)2 + H]3– C32H17N4O16S4 287.6453 287.6452 –0.35 25.0
[(IC)3 + 2H]4– C48H26N6O24S6 326.4746 326.4745 –0.31 37.0
By-products (anionic form)
[1]– C
8H5NO5S 225.9816 225.9810 –2.66 7.0
[2]– C
8H5NO6S 241.9765 241.9773 3.31 7.0
[3]– C
7H6NO5S 215.9972 215.9979 3.24 5.0
[4]– C
8H4NO7S 257.9714 257.9743 11.24 7.0
[5]– C
6H3O6S 202.9656 202.9651 –2.46 5.0
DBE: double-bond equivalence.
Conclusions
TiO2/SiO2 nanocomposites were obtained in a single
step and at low temperature using a synthetic procedure that employs water as the solvent. B2O3 inclusion allowed
the attainment of materials with improved photocatalytic activities, as verified in degradation tests with a common organic pollutant (the Indigo Carmine dye). SiO2 and B2O3
contributed to stabilize the anatase phase, even when a calcination at 550 °C was applied. The optimized material was obtained with a B/Ti ratio (RB) of 1 and by employing
a calcination temperature of 350 °C. This material showed a performance superior to those of commercial TiO2 materials
in causing the depletion of Indigo Carmine. Although the surface area is of fundamental importance for photocatalytic processes, this work demonstrated that the interactions that occur at the material interfaces are also critical. Hence, the B2O3-TiO2-SiO2 interfaces seem to act as sites of charge
separation up to a maximum content of B2O3. After this
maximum, the B2O3 layer causes the opposite effect. The
reactions were monitored by direct infusion electrospray ionization high resolution mass spectrometry which revealed that Indigo Carmine is efficiently degraded and that the main by-products are continuously formed by successive oxidations/hydroxylations. It is noteworthy that in all of the degradation experiments a common fluorescent lamp was used as the light source. Fluorescent lamps are easily accessible, of low cost and consume less power than the lamps commonly used in similar photocatalytic experiments. These results therefore reveal that this TiO2/SiO2-B2O3
nanocomposite can be used without the need of high energy light sources and has clear potential to be employed for the treatment of real effluents contaminated with organic matter.
Figure 7. Photocatalytic activities of the degradation of the Indigo Carmine dye in aqueous solution for hydrolysis, photolysis, B2O3, B0-450, B1-350 and commercial TiO2 materials.
Supplementary Information
Supplementary data are available free of charge at http://jbcs.sbq.org.br as PDF file.
Acknowledgments
The authors thank the financial support from CAPES and CNPq/FAPEMIG (agreement recorded in SICONV: 793988/2013). We kindly acknowledge the Microscopy Center at the Universidade Federal de Minas Gerais for the execution of the SEM tests and Prof Vicente Buono for the attainment of the XRD data. R. L. G. and B. S. O. are also grateful to the sponsorship from the Pró-Reitoria de Pesquisa of Universidade Federal de Minas Gerais.
References
1. Fujishima, A.; Zhang, X.; Tryk, D.; Surf. Sci. Rep.2008, 63, 515.
2. Henderson, M. A.; Surf. Sci. Rep.2011, 66, 185.
3. Nakata, K.; Fujishima, A.; J. Photochem. Photobiol., C2012, 13, 169.
4. Dozzi, M. V.; Selli, E.; J. Photochem. Photobiol., C2013, 14, 13. 5. Kumar, S. G.; Devi, L. G.; J. Phys. Chem. A2011, 115, 1321. 6. Kim, J.; Song, K. C.; Foncillas, S.; Pratsinis, S. E.; J. Eur.
Ceram. Soc.2001, 21, 2863.
7. Calleja, G.; Serrano, D. P.; Sanz, R.; Pizarro, P.; Microporous Mesoporous Mater. 2008, 111, 429.
8. Bai, S.; Liu, H.; Sun, J.; Tian, Y.; Chen, S.; Song, J.; Luo, R.; Li, D.; Chen, A.; Liu, C.-C.; Appl. Surf. Sci. 2015, 338, 61. 9. Ide, Y.; Koike, Y.; Ogawa, M.; J. Colloid Interface Sci.2011,
358, 245.
10. He, C.; Tian, B.; Zhang, J.; J. Colloid Interface Sci.2010, 344, 382.
11. Gao, X.; Wachs, I. E.; Catal. Today1999, 51, 233.
12. Resende, S. F.; Nunes, E. H. M.; Houmard, M.; Vasconcelos, W. L.; J. Colloid Interface Sci.2014, 433, 211.
13. Guan, K.; Lu, B.; Yin, Y.; Surf. Coat. Technol.2003, 173, 219. 14. Anderson, C.; Bard, A. J.; J. Phys. Chem.1995, 99, 9882. 15. Vohra, M. S.; Lee, J.; Choi, W.; J. Appl. Electrochem.2005, 35,
757.
16. Jung, K. Y.; Park, S. B.; Ihm, S.-K.; Appl. Catal., B2004, 51, 239.
17. Moon, S. C.; Mametsuka, H.; Suzuki, E.; Nakahara, Y.; Catal. Today1998, 45, 79.
18. Zhu, L. Y.; Wang, X. Q.; Zhang, G. H.; Ren, Q.; Xu, D.; Appl. Catal., B 2011, 103, 428.
20. Wang, Y.; Xue, X.; Yang, H.; Ceram. Int. 2014, 40, 12533. 21. Moon, O. M.; Kang, B. C.; Lee, S. B.; Boo, J. H.; Thin Solid
Films 2004, 464-465, 164.
22. Chen, D.; Yang, D.; Wang, Q.; Jiang, Z.; Ind. Eng. Chem. Res.
2006, 45, 4110.
23. Jeong, J.-H.; Jung, D.-w.; Shin, E. W.; Oh, E.-S.; J. Alloys Compd.2014, 604, 226.
24. Arun Kumar, D.; Merline Shyla, J.; Xavier, F.; Appl. Nanosci.
2012, 2, 429.
25. Tsou, H. T.; Kowbel, W.; Surf. Coat. Technol.1996, 79, 139. 26. Ang, T. P.; Toh, C. S.; Han, Y.-F.; J. Phys. Chem. C2009, 113,
10560.
27. de Andrade, F. V.; de Lima, G. M.; Augusti, R.; Coelho, M. G.; Ardisson, J. D.; Romero, O. B.; Chem. Eng. J.2012, 180, 25. 28. Coelho, M. G.; de Lima, G. M.; Augusti, R.; Maria, D. A.;
Ardisson, J. D.; Appl. Catal., B2010, 96, 67.
Submitted: November 11, 2016