A
rti
g
o
*e-mail: [email protected]
Cr/S/TiO2-LOADED HOLLOW GLASS MICROSPHERES AS AN EFFICIENT AND RECYCLABLE CATALYST
FOR THE PHOTOCATALYTIC DEGRADATION OF INDIGO CARMINE UNDER VISIBLE LIGHT
Xiuli Zhanga, Yidong Yina,*, Zhibo Suna, Yingqiu Dub, Shichao Maa and Yan Wua
aSchool of Chemistry and Materials Science, Heilongjiang University, Harbin 150080, Nangang, P. R. China
bAgricultural Products Quality and Safety Research Institute, Heilongjiang Academy of Agricultural Sciences, Harbin 150086, Nangang, P. R. China
Recebido em 05/01/2016; aceito em 05/04/2016; publicado na web em 13/07/2016
Chromium and sulfur co-doped nanometer TiO2 hollow glass microspheres (Cr/S/TiO2-HGM) were synthesized by a sol-gel method. Characterization used X-ray diffraction (XRD), scanning electron microscopy (SEM), energy-dispersive X-ray spectroscopy (EDX), N2 adsorption-desorption (Brunauer-Emmett-Teller (BET) measurements) and UV-Vis diffuse reflectance spectroscopy. The photocatalytic activity was evaluated by photodegradation of indigo carmine in an aqueous solution under visible light irradiation. The results indicated that the Cr/S/TiO2 containing 0.60% (atomic ratio) chromium and 1.2% (atomic ratio) sulfur calcined at 500 °C for 2 h had high catalytic efficiency under visible light irradiation. The floating Cr/S/TiO2-HGM catalyst had greater photocatalytic activity than Cr/S/TiO2 powder. Therefore, Cr/S/TiO2-HGM is a promising, high-performing, visible-light-driven, and more reusable photocatalyst.
Keywords:hollow glass microspheres; visible light; indigo carmine; TiO2; photocatalytic degradation.
INTRODUCTION
Wastewater from textile industries frequently contains significant amounts of non-biodegradable dyes.1 Most of these dyes are toxic and potentially carcinogenic, and their removal from industrial effluents is a major environmental concern.2 One of the most widely used dyes in the textile industry is indigo carmine or acid blue 74. It is also an additive in pharmaceutical tablets and capsules and used in medical diagnostics.3 However, this highly toxic indigoid class of dye is carcinogenic, and can lead to reproductive, developmental, neuronal and acute toxicity as well as carcinogenesis.4 It can also cause mild to severe hypertension and have cardiovascular and respiratory effects in patients.5 Thus, the removal of indigo carmine from water and wastewater is very important.
TiO2 is one of the most promising photocatalysts. It is widely used in wastewater treatment and hydrogen generation.6 However, pure bulk TiO2 is active under ultraviolet light, which is a small part (3-5%) of the solar spectrum. Many different attempts have been made to modify TiO2 on the surface or in the bulk to make it active with visible light. This is primarily done via ionic doping. Many types of doped TiO2 materials show varying degrees of photocatalytic activities under visible light irradiation. In some cases, two types of doping ions were introduced simultaneously into TiO2 to pursue enhanced visible light responses.7-9 So far, there are few reports using Cr/S/TiO2 as a visible light-activated photocatalyst, which is surprising because Cr/S/TiO2 extends its absorption to the visible region yet.10,11 The Cr/S/TiO2 heterojunction has a high photocatalytic ability to degrade indigo carmine under visible light.12
TiO2 is an excellent photocatalyst for the removal of organic con-taminants from wastewater. However, separation of the TiO2 particles from the treated water is difficult because the particles are too small to be removed. Therefore, attempts have been made to separate TiO2 photocatalysts via a variety of supported materials including glass microspheres, graphene, zeolites, and concrete.13-16
Hollow glass microspheres (HGM) are widely used in various
fields.17-19 HGM-TiO
2 is an important composite material and beca-me combeca-mercially available. It is easy to separate and recover. Thus, HGM-TiO2 is promising for use in industrial wastewater treatment plants and the reduction of gaseous pollutants due to its unique pro-perties including low density, buoyancy, and transparency to visible light.11 However, detailed studies on the photocatalytic performance and applications of HGM-TiO2 have received limited attention.
In this study, a novel chromium and sulfur co-doped TiO2 pho-tocatalyst was synthesized via a sol–gel method. To improve the separation and adsorption capacity, the photocatalyst was loaded on hollow glass microspheres and can thus be recycled.
EXPERIMENTAL Materials
Tetrabutyl titanate, glacial acetic acid and absolute ethanol were purchased from Tianjin Kemiou Chemical Reagenty Co., Ltd., China. Potassium persulfate, chromium nitrate nonahydrate, and indigo carmine were purchased from Shanghai Aladdin Industry Co., Ltd., China. Commercial P25 (80% anatase and 20% rutile) was purchased from Degussa (China) Co., Ltd. Other chemicals of analytical grade were used without further purification. Deionized water was used in all experiments. Hollow glass microspheres (H60) were from Beijing Sinosteel Corporation, China.
Sample Preparation
vigorous stirring for 30 min. Hollow glass microspheres (1:1 weight ratio) were then added to the above solution, and the mixture was stirred for 30 min. The resulting homogeneous green solution was subsequently aged at room temperature for 2 h. The final solution was further dried at 80 °C until a dry Cr/S/TiO2-HGM was achieved. This
was then placed in a muffle furnace. The temperature increased to
300, 400, 500, 600, 700, and 800 °C (100 °C/h) and was held constant for 2 h. The substrates were then cooled (50 °C/h) to room tempe-rature and used for characterization. For comparison, pure TiO2 and Cr/S/TiO2 were similarly prepared.
Characterization
The X-ray diffraction (XRD) patterns were collected with a Bruker D8 X-ray Diffractometer using CuK� (� = 1.5406Å) at a step scan of 0.02° from 10° to 80°. The scanning electron microscopy (SEM) images were recorded with a Hitachi S-4800 field emission scanning electron microscope with primary electron energy of 15 kV. The energy-dispersive X-ray spectroscopy (EDX) attached to the SEM determined the surface elemental composition. The BET surface areas were obtained by N2 adsorption-desorption surface area (Micromeritics ASAP 2020). All samples were degassed in a vacuum at 473 K for 4 h before measurements. The surface area of the materials was calculated by the Brunauer–Emmett–Teller (BET) theory. The UV-Vis diffuse reflectance spectra were measured us-ing a UV-Vis diffuse reflectance spectrophotometer (UV-Vis DRS: TU-1901, China) equipped with an integrating sphere assembly and BaSO4 as the reflectance sample. The spectra were recorded at room temperature in air from 200 to 800 nm.
Photodegradation
Photocatalytic experiments used a homemade reactor that was surrounded with a cooling system to maintain room temperature. A 500 W halogen lamp assisted with Toshiba B-47 optical filter (λ > 410 nm) was used as the visible light source. The catalyst was suspended in 100 mL of an indigo carmine solution (20 mg L-1) un-der magnetic stirring. The mixture was kept in the dark for 40 min to establish an adsorption-desorption equilibrium before the visible light radiation. At given intervals, 4 mL of suspension was extracted and then centrifuged at 5000 rpm for 3 min to remove the catalysts from the supernatant. The absorbance was then measured at 610 nm using a 721 spectrophotometer. Catalyst was added to a working concentration of 6 g L-1.
RESULTS AND DISCUSSION
Indigo carmine (20 mg L-1) in aqueous solution was photoca-talytically degraded with chromium and sulfur co-coated TiO2 powder catalysts. The Cr/S/TiO2 photocatalyst contained 0.60% (atomic ratio) chromium and 1.2% (atomic ratio) sulfur; it was calcined at 500 °C for 2 h. More details of the properties of the photocatalysts are given below.
XRD analysis
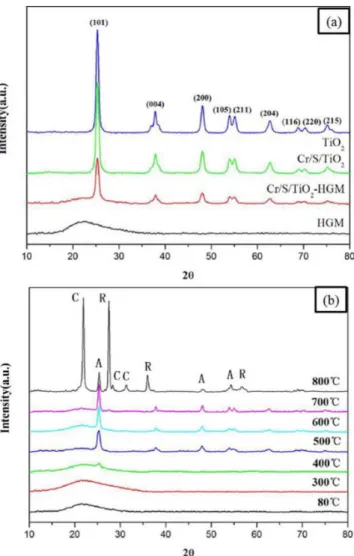
The XRD patterns of different materials are shown in Figure 1 (a). The patterns contain nine distinctive TiO2 peaks at 25, 37.80, 48.06, 53.90, 55, 62.7, 68.76, 70.17, and 75.37°. These correspond to the different anatase crystal planes (JCPDS 00-002-0387). This indicates that the synthesized powder is mainly anatase. A comparison of the patterns obtained from TiO2 and the Cr/S/TiO2 powders revealed that the diffraction peaks of TiO2 did not change. The Cr peaks were
not observed because Cr may be located in the interstice of the TiO2 or enters the crystal lattice instead of Ti. The S atoms may replace some of the oxygen atoms in the TiO2 crystal lattice. The absence of any sulfur peaks confirms a lack of residual sulfur on the nanocrys-tal. Figure 1 shows single broad peak of HGM around 22.4°. This indicates the presence of an amorphous nature. The crystal phase of Cr/S/TiO2 and Cr/S/TiO2-HGM are anatase TiO2 indicating that the right amount of loading does not change the crystal structure of the catalyst.
The HGM surface becomes a dry gel after calcination. It may contain hydrolyzed byproducts from tetrabutyl titanate, ethanol, and water as well as incompletely crystallized TiO2. Thus, a defined temperature is needed to obtain Cr/S/TiO2-HGM. The calcination temperature is one of the most important factors affecting Cr/S/ TiO2-HGM photocatalytic activity.
Figure 1 (b) shows the XRD patterns of Cr/S/TiO2-HGM cal-cined at different temperatures. The crystal phase was confirmed with JCPDS Card No. 01-078-1508 and 01-074-9378. The samples after calcination at 80 and 300 °C are amorphous TiO2 and HGM. At 400 °C, there is a small amount of anatase TiO2 in the sample. When the calcination temperature was between500-700 °C, the Cr/S/TiO2-HGM exists mainly as anatase TiO2 and amorphous HGM. The TiO2 crystal is stable after loading within this temperature range. Above 800 °C, the Cr/S/TiO2-HGM is a rutile TiO2 and cristobalite. Rutile TiO2 causes the catalyst surface to easily absorb water. This is not
Figure 1. (a) XRD patterns of different materials. (b) XRD patterns of Cr/S/
conducive to photocatalysis. The diffraction peaks becomes intense and narrow when the calcination temperature increased. A crystalline structure is gradually formed and crystallites gradually grow.
SEM analysis
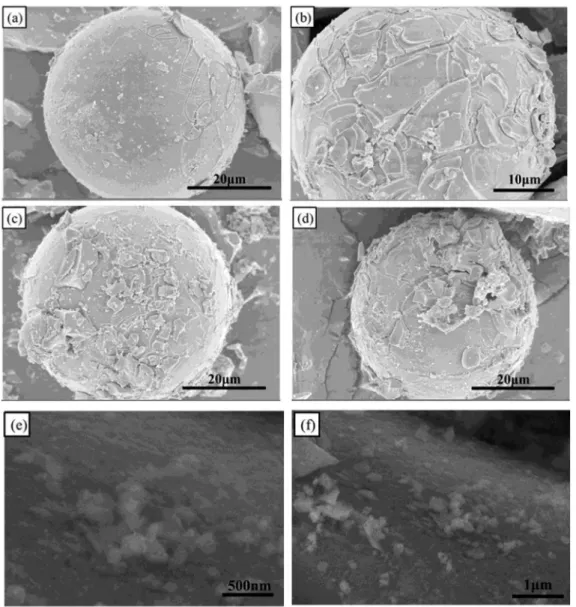
Figure 2 shows SEM images of Cr/S/TiO2-HGM for different loading times. The HGM particle size is in the range of 15-35 µm and can easily be separated from the treated wastewater. The surface
after one round of loading (HGM surface with a layer of Cr/S/TiO2)
was characterized (Figure 2 (a)); two rounds of loading are shown in
Figure 2 (b, e, f). The TiO2 film had many fractures on the surface of
the HGM. This is due to the gel coat. After drying and calcination, the thin film contracts to make these fractures. This increases the specific surface area of the catalyst and enhances the Cr/S/TiO2-HGM photocatalytic effect. Three and four rounds of loading are shown in Figures 2 (c) and 2 (d), all of the HGM have different loading
thicknesses. Loading too much Cr/S/TiO2 on the HGM will affect
the energy efficiency, and the Cr/S/TiO2 easily falls off. The optimum number of loading replicates is two.
EDX analysis
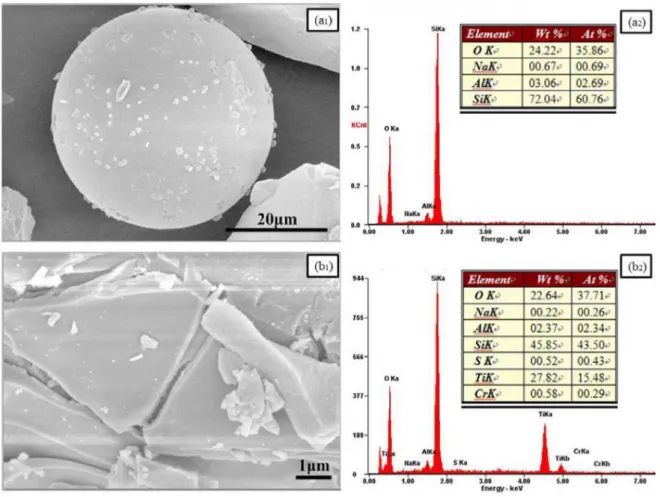
The elemental composition of the samples was estimated by EDX.
The SEM and EDX analyses of HGM before and after the loading
are shown in Figure 3. Figure 3 (a2) shows that the HGM are mainly
composed of Si and O. The HGM data after loading are shown in
Figure 3 (b2) - this confirms the presence of Ti, Cr, S, Si, and O. The
spectra indicate that the main components are Ti and O with low contents of Cr and S. The XRD and EDX data show that the HGM surface is loaded with Cr/S/TiO2.
UV-Vis DRS analysis
The light absorption characteristics of TiO2 usually change after
doping with nonmetal doping20-22 and metal/nonmetal co-doping.23-25
Figure 4 presents the UV–Vis diffuse reflection absorption spectra
of TiO2, Cr/S/TiO2, and Cr/S/TiO2-HGM. The absorption wavelength of pure TiO2 is less than 400 nm, and bulk TiO2 is a wide band gap semiconductor with a band gap of 3.2 eV (387 nm) for anatase.26 The absorption spectra of the Cr/S/TiO2 and Cr/S/TiO2-HGM samples obviously extend deeper into the visible light region relative to TiO2. Interestingly, the Cr/S/TiO2 shows significant absorption from 400 to 800 nm. The absorption of light increases dramatically in the visible region10 after S and Cr co-doping. There is an absorption peak of Cr/S/ TiO2 and Cr/S/TiO2-HGM around 400-450 nm corresponding to Cr.27 The absorption at 450 nm is assigned to the electron transition in the energy level of doping Cr3+. This transfers into the conduction band
(Cr3+→Ti4+) of TiO2.10 Additional absorption is due to the Cr3+ ion itself (4A2g→4T1g).
28-30 There is a wide absorption band in the 620-800
nm range that can be attributed to the d-d transitions (4A2g→4T2g) of
Cr3+.12 The Cr/S/TiO
2-HGM shows a broader absorption ranging from
UV light to visible light (200–800 nm). Thus, the Cr/S/TiO2 loaded on hollow glass microspheres enhances catalyst light absorption.
BET measurements
The BET surface area obtained from the N2
adsorption–desorp-tion isotherms are listed in Table 1. The BET surface area of the
Cr/S/TiO2 is higher than the TiO2. The BET surface area increased
to 176 m2 g-1 after loading. The Cr/S/TiO2-HGM sample has a high
surface area, and this could enhance the visible absorption and thus photocatalytic activity.
Photocatalytic activity
The photocatalytic activity of all samples is given below. This was evaluated by degradation of indigo carmine under irradiation with visible light. The initial concentration of indigo carmine is 20
mg L-1, and the degradation time is 80 min.
The effect of calcination temperature on the Cr/S/TiO2-HGM photocatalytic activity
Figure 5 shows the effect of the calcination temperature on
the photocatalytic activity. Samples of Cr/S/TiO2-HGM and their
photocatalytic performances are different. The samples calcined at 80, 300 and 400 °C have negligible photocatalytic activity. The photocatalytic activity of the 500 °C sample is the highest. From 600 to 800 °C, the photocatalytic activity of the samples decreased as a function of temperature. It is widely accepted that the high calcina-tion temperature usually results in larger particle sizes and smaller
specific surface areas.31 This is not in favor of the photocatalytic
Figure 3. SEM images and EDX spectra of the (a) HGM and (b) Cr/S/TiO2-HGM
Table 1. The BET surface area of samples
Sample BET surface
area (m2 g-1)
TiO2 47
Cr/S/TiO2 87
HGM 132
Cr/S/TiO2-HGM 176
activity. In summary, this study identified 500 °C as the optimal calcination temperature.
The cycle of the photocatalyst
Stability is a crucial factor in the assessment and application of photocatalysts. To gain insight into the stability of the composite catalysts, we performed five consecutive recycling photocatalytic degradation tests on Cr/S/TiO2-HGM samples under the same
condi-tions. Initially, 0.6 g of Cr/S/TiO2-HGM was dispersed in 100 mL
of indigo carmine solution (20 mg L-1). The mixture then underwent
five consecutive cycles - each lasting 80 min. After each cycle, the photocatalyst was filtered, washed thoroughly with deionized water,
and then added into fresh indigo carmine solution (20 mg L-1).
The degradation efficiency of five consecutive cycles is shown in Figure 6. As cycling time increases, the catalytic properties of the Cr/S/TiO2-HGM gradually decreased (Figure 6). The degradation rate
in the second round was 98.06% versus 100% at baseline, but the
efficiency was still 91.04% at cycle five. Therefore, the Cr/S/TiO2-HGM photocatalyst is functionally stable for at least five rounds of photodegradation. Thus, the Cr/S/TiO2-HGM has high cycle value. There is also a difference in the degradation rate of the indigo carmine solution by cycle 5. This is likely due to the Cr/S/TiO2 photocatalytic
degradation. Under visible irradiation, TiO2 plays a role in indigo
carmine degradation, the TiO2 particle reacts with O2, H2O and/or OH- to produced OH radicals, which degrade the indigo carmine. The reduced activity over time is due to Cr/S/TiO2 shedding from the HGM surface.
The comparison of different materials photocatalytic activity
Figure 7 shows the photocatalytic activity of P25-TiO2,
Cr/S/TiO2, Cr/S/TiO2-HGM, and HGM as a function of visible
light irradiation time. The HGM has negligible photocatalytic
activity. The photocatalytic activity of P25-TiO2 in visible light
is very low, and it is well known that P25-TiO2 does not absorb
visible light. The Cr/S/TiO2 and Cr/S/TiO2-HGM have high
pho-tocatalytic activity under visible light. Compared Cr/S/TiO2 with
Cr/S/TiO2-HGM, the Cr/S/TiO2-HGM increases the specific surface
area because of HGM. Thus, its photocatalytic activity is higher
than the Cr/S/TiO2. From a practical perspective, the powdered
Cr/S/TiO2 is not conducive to recycling, but the Cr/S/TiO2-HGM effectively solves the problem.
CONCLUSIONS
Hollow glass microspheres loaded with chromium and sulfur
co-doped TiO2 photocatalyst were synthesized by a sol–gel method.
The Cr/S/TiO2-HGM was evaluated in the degradation of indigo
carmine under visible light. The Cr/S/TiO2-HGM has superior
pho-tocatalytic performance under visible light irradiation. It can also be easily separated from the reaction system. This solves the problem of difficult recycling. Because of its enhanced visible light absorption, outstanding photocatalytic properties, and super recyclability, the Cr/S/TiO2-HGM is promising for applications in the field of water treatment. The results provide a new method to identify powder catalyst loading.
ACKNOWLEDGEMENTS
The authors are grateful to Science Foundation of Ministry of Education of Heilongjiang Province (12511380).
REFERENCES
1. Alahiane, S.; Qourzal, S.; Ouardi, M. E.; Belmouden, M.; Assabbane, A.; J. Mater. Environ. Sci. 2013, 4, 239.
Figure 5. Photocatalytic activity as a function of calcination temperature
of Cr/S/TiO2-HGM as used to eliminate indigo carmine under visible light irradiation (λ > 410 nm)
Figure 7. Photocatalytic activity of different materials used for the elimination of indigo carmine under irradiation with visible light (λ > 410 nm)
Figure 6. The degradation rate of indigo carmine by Cr/S/TiO2-HGM as a
2. Rauf, M. A.; Ashraf, S. S.; Chem. Eng. J. 2009, 151, 10.
3. Lakshmi, U. R.; Srivastava, V. C.; Mall, I. D.; Lataye, D. H.; J. Environ. Manage. 2009, 90, 710.
4. Jenkins, C. L.; Arch. Environ. Health 1978, 40, 7.
5. Jeffords, D. L.; Lance, P. H.; Dewolf, W. C.; Urology 1977, 9, 180. 6. Linsebigler, A. L.; Lu, G.; Yates, J. T.; Chem. Rev. 1995, 95, 735. 7. Zhang, X.; Liu, Q.; Appl. Surf. Sci. 2008, 254, 4780.
8. Lin, Y. H.; Tseng, T. K.; Chu, H.; Appl. Catal., A 2014, 469, 221. 9. Liu, S.; Feng, Q.; Tang, W.; Chin. J. Inorg. Chem. 2011, 27, 673. 10. Liu, S.; Tang, Q.; Feng, Q.; Appl. Surf. Sci. 2011, 257, 5544. 11. Chen, H.; Jin, H.; Dong, B.; Res. Chem. Intermed. 2012, 38, 2335. 12. Lu, Y.; Ni, L.; Yang, P.; Cao, Y.; Chin. J. Catal. 2007, 28, 987. 13. Jiang, W.; Joens, J. A.; Dionysiou, D. D.; J. Photochem. Photobiol. A
2013, 262, 7.
14. Merg, J. C.; Rossett, F.; Penha, F. G.; Quim. Nova 2010, 33, 1525. 15. Han, W.; Ren, L.; Zhang, Z.; Ceram. Int. 2015, 41, 7471. 16. Dos Santos, V. C.; Kondo, M. M.; Quim. Nova 2006, 29, 251. 17. Doumbia, A. S.; Bourmaud, A.; Jouannet, D.; Polym. Degrad. Stab.
2015, 114, 146.
18. Dalai, S.; Savithri, V.; Shrivastava, P.; Int. J. Energ. Res. 2015, 39, 717. 19. Ahn, K.; Kim, M.; Kim, K.; J. Power Sources 2015, 276, 309. 20. Ohno, T.; Akiyoshi, M.; Umebayashi, T.; Asai, K. T.; Matsumura, M.;
Appl. Catal., A 2004, 265, 115.
21. Cong, Y.; Zhang, J.; Chen, F.; Anpo, M.; J. Phys. Chem. C 2007, 111, 6976.
22. Ren, W.; Ai, Z.; Jia, F.; Zhang, L.; Fan, X.; Zou, Z.; Appl. Catal., B
2007, 69, 138.
23. Sakatani, Y.; Ando, H.; Okusako, K.; J. Mater. Res. 2004, 19, 2100. 24. Sakatani, Y.; Nunoshige, J.; Ando, H.; Chem. Lett. 2003, 32, 1156. 25. Zhao, W.; Ma, W.; Chen, C.; Zhao, J.; Shuai, Z.; J. Am. Chem. Soc.
2004, 126, 4782.
26. Bonato, M. M.; Bragança, M. O. G. P.; Portella, K. F.; Quim. Nova 2014,
37, 1063.
27. Sun, B.; Reddy, E. P.; Smirniotis, P. G.; Appl. Catal., B 2005, 57, 139. 28. Dvoranova, D.; Brezova, V.; Mazur, M.; Appl. Catal., B 2002, 37, 91. 29. Liu, Z. L.; Cui, Z. L.; Zhang, Z. K.; Funct. Mater. 2005, 36, 1404. 30. Kato, H.; Kudo, A.; J. Phys. Chem. B 2002, 106, 5029.