Article
J. Braz. Chem. Soc., Vol. 28, No. 12, 2301-2312, 2017. Printed in Brazil - ©2017 Sociedade Brasileira de Química 0103 - 5053 $6.00+0.00
*e-mail: [email protected]
Synthesis, Characterization and Enhanced Photocatalytic Activity of
Iron Oxide/Carbon Nanotube/Ag-doped TiO
2Nanocomposites
José O. Marques Neto,a Carlos R. Bellato,*,a Carlos H. F. de Souza,a
Renê C. da Silvab and Pablo A. Rochac
aDepartamento de Química, bDepartamento de Física and cDepartamento de Solos,
Universidade Federal de Viçosa (UFV), 36570-900 Viçosa-MG, Brazil
A novel magnetically recoverable catalyst (Fe/MWCNT/TiO2-Ag) was prepared in this study by a process that involves few steps. Titanium dioxide doped with silver and iron oxide was deposited on support of multi-walled carbon nanotubes (MWCNT). The synthesized catalysts were characterized by inductively coupled plasma mass spectrometry (ICP-MS), N2 adsorption/desorption, X-ray diffraction (XRD), scanning electron microscopy (SEM), energy dispersive spectrometry (EDS), infrared spectroscopy (IR) and UV-Vis diffuse relectance spectra (DRS). Phenol in aqueous solution (50 mg L-1) was used as a model compound for evaluation of UV-Vis (ilter cut off for λ > 300 nm) photocatalytic activity. The composite catalyst has a high
photocatalytic activity, destroying ca. 100% of phenol and removing 85% of total organic carbon in an aqueous solution after 180 min. The Fe/MWCNT/TiO2-Ag catalyst remained stable, presenting an 8% decrease in phenol degradation eficiency after ten consecutive photocatalytic cycles.
Keywords: visible light, photocatalysis, titanium dioxide, magnetic separation, phenol
Introduction
Among the semiconductors used in heterogeneous photocatalysis, titanium dioxide is that most used due to specific properties, including high photosensitivity, non-toxic nature, chemical stability and relatively low cost.1,2 One inherent problem to the use of this catalyst is
the electron-hole recombination and its high band-gap value of 3.2 eV, limiting its photoactivity at low wavelengths and preventing the use of TiO2 in applications with visible light.3,4
Doping of TiO2 with metals such as gold, platinum,
rhodium and silver increases the spectrum of radiation absorption by TiO2, allowing for its use with visible light.5
Silver has a low cost when compared to other noble metals and has electronic properties that make it a good option for use as a dopant on the surface of TiO2. The working function
of silver (4.26 eV) lies below the conduction band (CB) of TiO2 (4.20 eV), Au (4.8 eV) and Pt (5.3 eV), and therefore
silver can capture the photogenerated electrons of TiO2,
acting as electron traps and avoiding the recombination of the hole-electron pairs.6-8
The use of carbon nanotubes as support materials can provide functional properties, such as increase of the
speciic surface area, high mechanic strength and high conductivity due to their remarkable electrochemical properties.9 Carbon nanotubes have high electron storage
capacity and may thereby receive the photogenerated electrons from the TiO2 CB.10 The carbon nanotubes
when in contact with TiO2 alter its absorption of radiation
to longer wavelength light (visible light) due to π→π*
transitions of the nanotubes and n → π* between the
n orbitals of the oxygen of TiO2 and π* of the nanotubes.11
These unique characteristics of multi-walled carbon nanotubes (MWCNT) have attracted the attention of many researchers in the preparation of nanocomposites with TiO2.
The MWCNT properties contribute to facilitate the load transfer, functioning as electron acceptors. 12
The incorporation of magnetic properties of iron oxides such as magnetite or maghemite in TiO2-based
catalysts facilitates its removal from the aqueous solution by application of an appropriate magnetic ield, reducing costs and time spent in the extraction of the catalyst to permit its recycling.13,14
In addition to its magnetic properties, the iron oxide creates additional energy levels to capture electrons from the conduction band and holes from the valence band of TiO2, promoting a more effective separation
Several studies have been performed using TiO2 based
catalysts with magnetic properties. Zhou et al.14 prepared
MWCNT/Fe3O4/TiO2 photocatalyst by in situ polymerization
with polyacrylic acid and applied it in the phenol photodegradation with UV-Vis light. Luo et al.16 fabricated
a TiO2/Fe3O4/MWCNT magnetic catalyst by polymerization
method using pyrrole as a support. Zhang et al.17 synthesized
the TiO2/Fe3O4/MWNTs catalyst by in situ hydrolysis
method and applied for degradation of methylene blue under UV light. Aguilar et al.18 prepared TiO
2-Fe3O4-Ag catalyst
doped with silver or gold and evaluated the effectiveness for phenol degradation with UV light and visible light.
There are no reports in the literature on the photocatalytic properties of Fe/MWCNT/TiO2-Ag composites. In this
work, we evaluated the effect of the interaction between iron oxide, silver and MWCNT with regards to the increase of the TiO2 photocatalytic activity, allowing its application with
UV-Vis light (cut off ilter for λ > 300 nm). In this study, a
new magnetically recoverable composite of TiO2 doped with
silver and iron oxide and impregnated on multi-walled carbon nanotubes (10-Fe/MWCNT/TiO2-Ag-9) was synthesized by
a facile method that involves only a few steps. Furthermore, silver, iron oxide and MWCNT interact with TiO2, thus
improving its eficiency for photodegradation of organic compounds. The effect of varying wt.% of Ag and Fe and MWCNT:TiO2-Ag wt. ratio on the Fe/MWCNT/TiO2-Ag
composite was evaluated with regards to phenol photodegradation. Phenol is a common organic pollutant in the environment with high toxicity and carcinogenicity, structural stability and resistance to biodegradation.19
Experimental
Materials
MWCNT were used as received with purity > 93%, outer diameter between 10 and 50 nm and estimated length of 5 to 30 µm, produced in the Laboratory of Nanomaterials, Physics Department, at Universidade Federal de Minas Gerais (UFMG), Brazil. The TiO2 used was P25, acquired
from Degussa, consisting of 80% anatase and 20% rutile. The commercial reagents silver nitrate, ethylene glycol, isopropyl alcohol and phenol were obtained from Sigma-Aldrich. All solutions were prepared with analytical grade reagents and high purity deionized water produced by a Milli-Q® system (Millipore, Bedford, MA, USA).
Preparation of iron oxide
A solution containing 1.6 L of water, 2.0 g of FeCl3.6H2O and 4.8 g of FeSO4.7H2O was heated to 70 ºC.
Next, 120 mL of a solution of 5 mol L-1 NaOH were added
to the solution containing Fe salts, causing iron oxide precipitation. The obtained solid was washed with water to pH 7.0 and then dried at 70 °C for 18 h.20
Preparation of the Fe/MWCNT/TiO2-Ag catalyst
The silver nanoparticles (Ag NPs) were deposited on the surface of the commercial TiO2 (Degussa P25) according
to the photodeposition method, in which Ag+ ions were
converted to Ag NPs in the presence of oxalic acid and UV-Vis irradiation.21 The products were designated as
TiO2-Ag-X, in which X indicates the contents of Ag. The
X values in our experiments were 1.0, 2.0, 4.0, 6.0, 9.0, 15.0 and 20.0 wt.%.
Samples consisting of 20 mg of TiO2-Ag-X were
added to 100 mL of water and stirred for 20 min. Next, 10 mg of MWCNT were added and stirring continued for 30 min. Isopropyl alcohol was then added in the concentration of 50 mL per 30 mg of MWCNT followed
by stirring for 30 min, and ethylene glycol was dispersed at the concentration of 15 mL per 30 mg of MWCNT.22,23
The resulting suspension remained under agitation for 6 h and was then iltered, washed with distilled water and the obtained solid (MWCNT/TiO2-Ag-X) was dried
in an oven at 70 °C. The TiO2-Ag in the catalyst was
studied varying their quantity per g of MWCNT. The
weight ratio of MWCNT:TiO2-Ag was varied to 1:1,
1:1.5, 1:2, 1:3 and 1:4, and Ag wt.% was maintained fixed at 9%. The obtained catalysts were labeled as Y-MWCNT/TiO2-Ag, where Y = 11, 11.5, 12, 13 and
14 wt. ratio MWCNT:TiO2-Ag.
The Fe/MWCNT/TiO2-Ag composite was obtained by
adding 1 g of 12-MWCNT/TiO2-Ag-9 to 500 mL of water.
To this suspension, different amounts of iron oxide were added. The suspension was maintained under stirring for 2 h, iltered, washed with distilled water and dried in an oven at 70 °C. The magnetically recoverable catalysts were labeled as Z-Fe/MWCNT/TiO2-Ag-9, where Z = 5.0, 10.0,
15.0, 20.0 and 25.0 wt.% of Fe.
Photocatalyst characterization
The determination of the inal photocatalyst chemical compositions was made by mixing 0.100 g of each sample with 3 mL of HNO3 (65%), 4 mL of H2SO4 (96%), 4 mL of
coupled plasma mass spectrometry (ICP-MS), PerkinElmer model NexION 300D.
The textural properties of the samples were analyzed by their N2 adsorption-desorption isotherms using a
surface area and pore size analyzer (NOVA 2200e Quanta Chrome Instruments, Boynton Beach, FL, USA). Prior to measurement, the samples were degassed at 110 oC for 4 h.
Speciic surface areas were estimated by the Brunauer-Emmett-Teller (BET) method and pore volumes were determined by the Horváth-Kawasoe (HK) method applied to the desorption branch.
X-ray diffraction (XRD) was measured by 2θ scans
utilizing a Bruker model D8 Discover diffractometer using Cu Kα radiation (λ = 0.1541 nm) with an angular variation
of 5-80º (2θ) and scan rate of 0.05 degree s-1. The Powder
Diffraction File (PDF) database (JCPDS, International Centre for Diffraction Data) was used to identify crystalline phases. Network parameters (dhkl) of the composites were
calculated according to the Bragg equation, λ = 2d sen θ,
where λ is the wavelength of X-rays (λ = 0.1541 nm) and θ is the diffraction angle.24
Scanning electron microscopy (SEM) images were obtained using a JEOL JSM-6010/LA microscope. The SEM equipment was equipped with an energy dispersive spectrometry system (EDS) for analysis of the sample chemical composition.
Infrared spectra (IR) were obtained using a VARIAN 660-IR spectrophotometer equipped with an attenuated relectance accessory PIKE Gladi ATR in the region of 400 to 4000 cm-1.
Diffuse relectance spectra (DRS) were acquired on a dual-beam 20 GBC, Cintra model spectrophotometer, in the region of 350-700 nm. Calcium carbonate was used as a non-absorbing standard.
Total organic carbon (TOC) was measured using a Shimadzu-5000A TOC analyzer.
In order to detect the presence of TiO2 and iron
oxide in the catalysts, analyses were also conducted by Raman scattering, using a Renishaw Raman Invia micro spectrometer equipped with an argon laser (514.5 nm) with a 50 × objective (NA = 0.75, corresponding to a spot of ca. 1 µm in diameter) and spectral resolution of 1 cm-1.
The zeta potential of adsorbents was measured using the Zetasizer Nano ZS instrument at pH values from 2 to 8.
Photocatalytic activity
The photocatalytic activity of the Fe/MWCNT/TiO2-Ag
composites was assessed by photodegradation of a phenol solution in an annular photoreactor (Figure S1 in the Supplementary Information (SI) section). The composites
and phenol solution were stirred for 15 min in the dark and then irradiated by UV-Vis light (ilter cut off for
λ > 300 nm) for 180 min. At established time intervals,
aliquots were taken from samples, and iltered through a 0.45 µM membrane (Millipore) for phenol and total organic carbon (TOC) quantiication. The monitoring of the remaining phenol concentrations was carried out by high performance liquid chromatography (HPLC) using a 1260 Ininity system with a linear photodiode array detector (DAD) (Agilent Technologies). The chromatographic conditions used for quantiication of phenol by HPLC-DAD are described by Almeida et al.25
Photolysis was evaluated under the same conditions without the presence of the catalyst and only UV-Vis light. All studies were performed in triplicate.
Reuse assays
Photocatalysts were washed with deionized water and dried before reuse. The photocatalysts were characterized by X-ray diffraction techniques and infrared spectroscopy before and after each photodegradation cycle to verify its stability.
Results and Discussion
Scanning electron microscopy, energy dispersive spectroscopy and chemical composition
Surface analysis of the materials by SEM is shown in Figure S2 (in the SI section). Figure S2a shows the carbon nanotubes. In Figures S2b and S2c, the presence of dispersed granules of TiO2-Ag and/or iron oxide along the
surface of the carbon nanotubes is observed.26,27 The image
of the material after ten consecutive reutilization cycles (Figure S2d) presents morphology similar to that of the unused material, thus conirming maintenance of the material structure. Figure S3 (in the SI section) shows the elemental analysis results of EDS spectra. The presences of Ti, Ag and Fe peaks are observed in the spectra. The spectrum of Figure S3d is similar to that of Figure S3c, indicating that the structure of the catalyst was not altered after ten reuse cycles.
Table 1 shows the quantities determined by ICP-MS of the Ti, Ag and Fe metals in the composites making up the catalysts. It can be observed that the quantities of each metal in the catalyst were close to the values initially calculated.
Specific surface area
catalysts are greater than those of TiO2 and TiO2-Ag-9. The
introduction of MWCNT in the catalysts prevents the TiO2
particle agglomerations, increasing the surface area.28 The
SEM images reinforce this fact, showing that the TiO2-Ag
and/or iron oxide particles were dispersed on the surface of MWCNTs.
X-ray diffraction
The diffractograms obtained for the X-ray diffraction patterns of the samples are shown in Figure 1. The peaks corresponding to the carbon nanotubes (Figure 1a) appear at 26.10° and 44.70°, and correspond to the diffraction planes (002) and (100).28,29Regarding the diffractogram of iron
oxide (Figure 1b), characteristic peaks of magnetite and maghemite are observed, being indistinguishable by XRD.30
The main peaks of magnetite-maghemite were observed at 30.10°, 35.50°, 43.10°, 53.40°, 57.04° and 62.88°, representing the diffraction planes (220), (311), (400), (422), (511) and (440), respectively.31-33 The diffractogram
in Figure 1c shows the main peaks for TiO2. The peaks are
labeled A (hkl) or R (hkl) related to the anatase (JCPDS ile No. 21-1272) or rutile (JCPDS ile No. 21-1276) phases, respectively, and agree with the crystallographic standards found in the literature.34-36 The X-ray diffraction
patterns of TiO2-Ag (Figure 1d) exhibit characteristic peaks
of metallic silver (Ag0). However, the largest peak that
reveals the crystalline structure of silver appears at 38.20° referring to the plane (111) superimposed on the peak 37.80° (004) of the TiO2 anatase phase.37 Silver (Ag+) has
an ionic ratio of 0.126 nm, greater than Ti4+ (0.068 nm),
making impossible its substitution in the crystalline structure of TiO2, but permitting only the impregnation on
the TiO2 surface.38
The diffractogram of 10-Fe/MWCNT/TiO2-Ag-9 is not
altered when compared to the precursors, MWCNT, iron oxide and nano-TiO2. There was only the overlapping of
the peaks, and this demonstrates that the combination of iron oxide, TiO2 and MWCNT is likely a physical process.
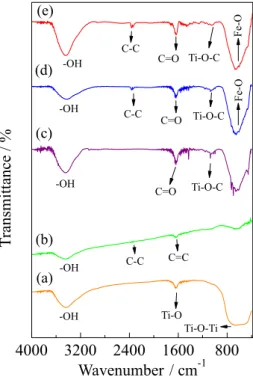
Infrared spectroscopy analysis
Figure 2a shows the obtained spectrum for TiO2
nanoparticles, in which there is an absorption band in the Table 1. Initial and inal chemical compositions, inal mass ratios, band-gap values and textural analysis of the synthesized photocatalysts
Sample
Ratio (wt.) Metal loading / wt.%
Band gap / eV
SBETa /
(m2 g-1)
Pore volume / (cm3 g-1)
Initial Final Initial Final
Ag:Ti Fe:Ti Fe:Ag:Ti Ag:Ti Fe:Ti Fe:Ag:Ti Ag Fe Ag Fe
MWCNT – – – – – – – – – – – 95.5 0.0344
TiO2 – – – – – – – – – – 3.20 48.0 0.0178
TiO2-Ag-9 1:7 – – 1:6.9 – – 9.0 – 8.4 – 3.05 55.7 0.0203
MWCNT/TiO2-Ag-9 1:7 – – 1:6.8 – – 9.0 – 8.2 – 2.84 64.7 0.0235
10-Fe/MWCNT/TiO2 1:7 1:6 – – 1:6 – – 10 – 9.5 2.52 60.7 0.0223
10-Fe/MWCNT/TiO2-Ag-9 1:7 1:6 1:1.2:7 1:6.9 1:5.8 1:1.1:6.9 9.0 10 8.6 9.8 2.24 68.8 0.0253 aS
BET: speciic surface area.
Figure 1. X-ray diffraction patterns of (a) MWCNT, (b) magnetic iron oxide, (c) TiO2, (d) TiO2-Ag-9, (e) 10-Fe/MWCNT/TiO2-Ag-9 and (f)
low frequency region (400-800 cm-1), which is associated
to the Ti–O vibration mode from the structure of Ti–O–Ti bonds. The spectrum obtained for the carbon nanotubes (Figure 2b) shows the presence of C=C stretching bands at 1580 cm-1 and C–C at 2340 cm-1.39,40
The spectra of Figures 2d and 2e show the presence of bands at 572 and 628 cm-1 characteristic of the Fe–O bond
of the magnetic iron oxide.41 In the spectra of Figures 2c-2e,
a stretching of the Ti–O–C bond at 1065 cm-1 is observed,
confirming the bond of TiO2 to the carbon nanotube
structures.42
Raman spectroscopy
Figure 3 shows the Raman spectrum of the synthesized catalysts. The Raman spectrum of iron oxide (Figure 3a) shows a broad band from 670-720 cm-1 associated to
magnetite and maghemite phases.43 The bands in the range
of 1370-1580 cm-1 are related to the magnetic properties of
the iron oxide crystals, which may indicate the presence of maghemite since they are not encountered in the pure magnetite samples.43,44 The spectrum of the carbon
nanotubes (Figure 3b) shows two characteristic bands, the G band located at 1580 cm-1 corresponding to the sp2 bonds of
the crystalline graphitic sheets, and the D band at 1354 cm-1
corresponding to defects of sp3 bonds in the pentagonal and
heptagonal carbon structures of the nanotubes.45 The TiO 2
spectrum (Figure 3c) shows four characteristic bands of the anatase and rutile phases of TiO2. The bands at 137, 387,
513 and 638 cm-1 correspond to the anatase phase and at
440 cm-1 to the rutile phase.45,46 The TiO
2-Ag-9 composite
(Figure 3d) presented a new band at 90 cm-1 corresponding
to the vibration mode of the Ag structure, moreover the band of TiO2 at 137 cm-1 was shifted to 145 cm-1 due
to the resonant Raman effect caused by deposition of Ag NPs on the TiO2.47 The phonon coninement can cause
these changes to the Raman vibration mode and peak intensities.37 Spectra of the MWCNT/TiO
2-Ag-9 and
10-Fe/MWCNT/TiO2-Ag-9 composites are shown in
Figures 3e and 3f. These spectra indicated the shift in wavenumbers and intensities of the D and G bands of the MWCNT from interaction with TiO2-Ag and the iron oxide.
The G band of carbon nanotubes showed a shift of 6 cm-1 to blue and the D band of 9 cm-1 to red due to
adhesion of the TiO2-Ag on the surface of the carbon
nanotubes.37 The intensity ratio of the D and G bands of
carbon nanotubes was ID/IG = 0.4251, for the composite Figure 2. Infrared spectra of (a) TiO2, (b) MWCNT, (c) MWCNT/TiO2-Ag-9,
(d) 10-Fe/MWCNT/TiO2-Ag-9 and (e) 10-Fe/MWCNT/TiO2-Ag-9
(reused).
Figure 3. Raman spectra of (a) iron oxide, (b) MWCNT, (c) TiO2, (c1) expanded spectrum for TiO2 range 300-750 cm-1
(*rutile phase of TiO2), (d) TiO2-Ag-9, (e) MWCNT/TiO2-Ag-9 and
MWCNT/TiO2-Ag-9 ID/IG = 0.7283 and for the composite
10-Fe/MWCNT/TiO2-Ag-9 ID/IG = 0.6989. The increase
of the intensity ratio is due to disturbances in the structure of the nanotubes by interaction with the TiO2-Ag and iron
oxide nanoparticles.48 The presence of the TiO
2-Ag bands
of the magnetite-maghemite and the shifts of the D and G bands of the carbon nanotubes (Figure 3f) indicated that there was a strong interaction between the catalyst components.
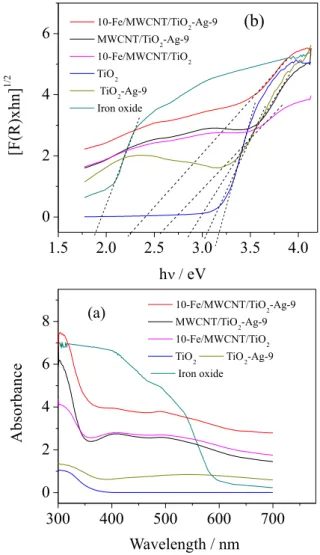
Determination of band-gap values
Figures 4a and 4b show the UV-Vis spectra of diffuse reflectance. The Kubelka-Munk function F(R) = (1 − R)2 / 2R (R is the relectance) was used to
calculate the band-gap energy of the catalysts.49 The
calculation of the band-gap energy (Figure 4b) was performed by extrapolating the line obtained in the regression of the linear portion of [F(R)hʋ]n (n = 1/2
for indirect gap) vs. energy (hʋ), where h is Planck’s
constant and ʋ the frequency of light.50 The band-gap
values for TiO2, TiO2-Ag-9, MWCNT/TiO2-Ag-9,
10-Fe/MWCNT/TiO2, 10-Fe/MWCN/TiO2-Ag-9 and
iron oxide are 3.20, 3.05, 2.84, 2.52, 2.24 and 1.97 eV, respectively. The 10-Fe/MWCNT/TiO2-Ag-9 catalyst
showed light absorption shifted to the visible region. This shift is due to the electronic interaction of molecular orbitals between iron oxide (presenting a narrow band gap, 0.1 eV for magnetite and 2.2 eV for maghemite) and TiO2
(3.2-3.3 eV), constructing a new molecular orbital and reducing the band difference. Similar phenomena were observed between graphene and TiO2,51 carbon nanotubes
and TiO2,52 and TiO2 and iron oxide.53 The displacement
of radiation absorption to the visible region is also due to MWCNTs which act as photogenerated electron acceptors and to the surface plasmon resonance of electrons present in the Ag0 nanoparticles.37,54
Thus, the combination of iron oxide, Ag0 and MWCNT
in the catalyst composition contributed to increase the absorption of the visible light by TiO2. The photogenerated
electrons in the conduction band and the valence band gaps of the TiO2 may be trapped by the iron oxide, maintaining
the electron-hole separation.55 In the charge transfer process,
the Fe3+ of iron oxide is reduced to Fe2+ by the electrons
of the TiO2 conduction band, the Fe2+ can be oxidized to
Fe3+ and the generated electrons react with O
2 to produce
the superoxide ion (O2•–).55-58 The Fe3+ of iron oxide can
be oxidized by the TiO2 valence band gap to form Fe4+
which reacts with –OH ions to form •OH radicals.56 Electron
transfer may also occur directly from the TiO2 conduction
band to the Ag NPs. The Ag0 which has a higher working
function (4.26 eV) than that of TiO2 (4.20 eV) can capture
photogenerated electrons on TiO2 and transfer them to
MWCNTs, and these electrons can react with O2 to form the
radical O2•–.58,59 Thus, the effect of the interaction between
the components of the catalyst increases the transport of electrons, prevents the recombination of charges and allows the use of visible radiation in the photodegradation of phenol.
Photocatalytic activity and kinetics
Figure 5 shows the results obtained in the phenol oxidation by varying the amounts of Ti, Ag and Fe added to the catalyst. In Figure 5a, it was veriied that the photocatalyst which promoted the highest removal of phenol was that with a MWCNT:TiO2-Ag ratio of
1:2 (12-MWCNT/TiO2-Ag). Figure 5b shows that the
maximum photodegradation eficiency was obtained by the catalyst with 9 wt.% Ag (0.000834 mol g-1). The increase
occurred. The Ag nanoparticles increase the probability of electron capture by the valence band of TiO2, reducing
the charge separation time and hence the photocatalytic efficiency.7 In Figure 5c, the highest photocatalytic
eficiency was obtained by the catalyst with 10 wt.% Fe (0.0018 mol g-1). For larger amounts of Fe, the eficiency
decreases. Larger quantities of Fe3+ decrease the surface
area of the catalyst to prevent light penetration.60,61
Figure 6 shows the influence of pH on phenol photodegradation by 10-Fe/MWCNT/TiO2-Ag-9 and
determination of the point of zero charge (ZPC) for the catalysts. The ZPC values determined for TiO2 and
MWCNT were 6.10 and 4.00, respectively, and are in agreement with values reported in the literature.4,62 The
ZPC value of the 10-Fe/MWCNT/TiO2-Ag-9 catalyst was
5.49 (Figure 6a), being that at values of pH < pHZPC, the
catalyst surface is positively charged, and at pH > pHZPC,
it is negatively charged. Figure 6b shows that the removal of phenol by the catalyst was highest in the pH range of 3.0 to 5.20 (pH < pHZPC), and at pH > pHZPC, there was a
decrease in the removal of phenol.
At pH of 3.0 to 5.20 (pH < pHZPC), the catalyst surface
is positively charged and the electron recombination rate with hVB+ holes is minimized by providing a greater
photocatalytic activity. The presence of negative charges on the catalyst surface (pH > pHZPC) inhibits the adsorption
of –OH ions and water molecules, and consequently
decreases the amount of •OH radicals formed, in addition to increasing the recombination rate of the electrons generated in the conduction band with valence band of TiO2.18 At
pH above 9, carbonate is found in solution (formed by the absorption of CO2 from the air), and reacts with –OH ions
to diminish the production of •OH radicals, reducing the Figure 5. Photocatalytic activity of the catalysts: (a) with different amounts
of TiO2-Ag, (b) with different amounts of Ag and (c) with different
amounts of iron oxide for phenol degradation. Reaction conditions: initial phenol concentration of 50 mg L-1, 300 mg of photocatalyst, reaction
temperature 30 ± 2 oC and initial pH 5.2.
Figure 6. (a) Zeta potential measurements, (b) inluence of pH on the removal of phenol by the catalyst 10-Fe/MWCNT-TiO2-Ag-9. Reaction
conditions: initial phenol concentration of 50 mg L-1, 300 mg of
removal of phenol.63 Phenol (pKa = 9.95) at pH 9-10 is
found in the form of phenoxide ion, which is repelled by the negative loads on the surface of the catalyst (pH > pHZPC),
contributing to the decrease of the phenol removal rate.64
A comparison of the various synthesized catalysts (Figure 7) shows a high efficiency for phenol photodegradation by 10-Fe/MWCNT/TiO2-Ag-9
(ca. 100%). In studies on the absence of radiation, the phenol removal was assessed by adsorption.
In Figure 7a, it is observed that 10-Fe/MWCNT/TiO2-Ag-9
adsorbed 7% of phenol after 180 min in the absence of UV-Vis radiation. The TOC removal was also quantiied (Figure 7b) to measure the degree of phenol mineralization.
The catalyst 10-Fe/MWCNT/TiO2-Ag-9, which
resulted in the highest phenol removal (Figure 7a), also generated a greater reduction in TOC, reaching approximately 85% after 180 min. The TiO2 catalyst
when compared to TiO2-Ag-9 generated an increase in the
phenol photodegradation by 28 to 68%. The incorporation of Ag NPs in the 10-Fe/MWCNT-TiO2 forming the
10-Fe/MWCNT/TiO2-Ag-9 catalyst had an additive effect,
increasing the amount of phenol removed from 79 to ca. 100%, respectively.
The schemes of photoactivation of the catalyst and phenol degradation are shown in Figure 8. One photon (hʋ) with energy greater than the band-gap energy of TiO2
promotes the valence band electrons (VB) to the conduction band.65 Ag NPs in contact with TiO
2 captured the
photogenerated electrons (e−
CB), increasing the electron-hole
separation and preventing recombination.55
The process of transferring electrons (e−
CB) from TiO2 to
Ag NPs (equations 1 and 2) occurs spontaneously due to its Fermi level being greater than that of Ag NPs.66 Electrons
stored in Ag NPs are transferred to MWCNT, which acts as donors of these electrons to dissolved oxygen to form the radical ion superoxide (O2•–) (equation 3). This transforms
into reactive oxygen species, such as •OH, HO
2• and H2O2.58
(1) (2) (3)
Figure 7. (a) Comparison of the photocatalytic activity of the catalysts for the removal of phenol, (b) variation in the total organic carbon content (TOC) of the solution during the phenol photodegradation. Reaction conditions: initial phenol concentration of 50 mg L-1, 300 mg of
photocatalyst, reaction temperature 30 ± 2 oC and initial pH 5.2.
The iron oxide present in the catalyst can act as a temporary site for capture of electrons (e−
CB) and holes
(h+
VB) photogenerated on TiO2.55,67 Thus, the Fe3+ from iron
oxide may act as a temporary photogenerator of electrons (equation 4) or in the capture of photogenerated electrons (equation 5), inhibiting the charge recombination of the TiO2.67
(4) (5)
Because Fe2+ and Fe4+ are more unstable than Fe3+, there
is a strong tendency for charge transfer of the TiO2 surface
to the iron oxide, forming the hydroxyl and superoxide radicals (equations 6 and 7).55,62,68
(6) (7)
The hydroxyl radicals and the superoxide anion produced in this process have suficient oxidative potential to degrade phenol molecules (equations 8 and 9).
(8) (9)
Table S1 (in the SI section) presents a summary of photocatalytic phenol degradation studies published in the literature. It can be observed that phenol degradation by 10-Fe/MWCNT/TiO2-Ag-9 showed satisfactory performance
compared to other catalysts previously reported.
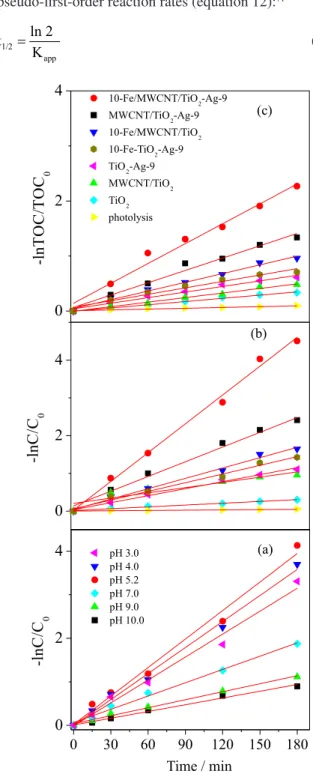
Kinetics of phenol photodegradation
The photocatalytic reactions by degradation of organic pollutants follow pseudo-irst-order model of Langmuir-Hinshelwood shown in equation 10.69,70
(10)
where r is degradation rate (mg L-1 min-1), t the reaction
time (min), C the concentration of the organic compound (mg L-1), k
r the intrinsic rate constant and Kad the adsorption
equilibrium constant. At low initial organic compound concentrations and when adsorption is small, Kad C is
negligible and the model is reduced to equation 11, where Kapp = kr Kad is the apparent rate constant.25
(11)
In this model, the slope of the ln (C0/C) vs. time (t)
plot is the apparent rate constant (Kapp). Figure 9 presents
results of phenol photodegradation kinetic studies that were used to determine apparent rate constants (Kapp) and phenol
half-lives (t1/2). The half-life time (t1/2) (the time at which
C = 0.5 C0) is one of the most useful values to compare
pseudo-irst-order reaction rates (equation 12):71
(12)
Figure 9. Pseudo-irst-order degradation kinetics for phenol used to estimate Langmuir-Hinshelwood coeficients. Phenol removals: (a) with the catalyst 10-Fe/MWCNT/TiO2-Ag-9 at various pH levels, (b) with
different photocatalysts by HPLC-DAD and (c) TOC. Reaction conditions: initial phenol concentration of 50 mg L-1, 300 mg of photocatalyst and
The kinetic data for pH variation (Figure 9a), phenol photodegradation by HPLC-DAD (Figure 9b) and TOC photodegradation (Figure 9c) results adjusted well to the pseudo-irst-order kinetic model, with coeficients of determination (R2) higher than 0.97.
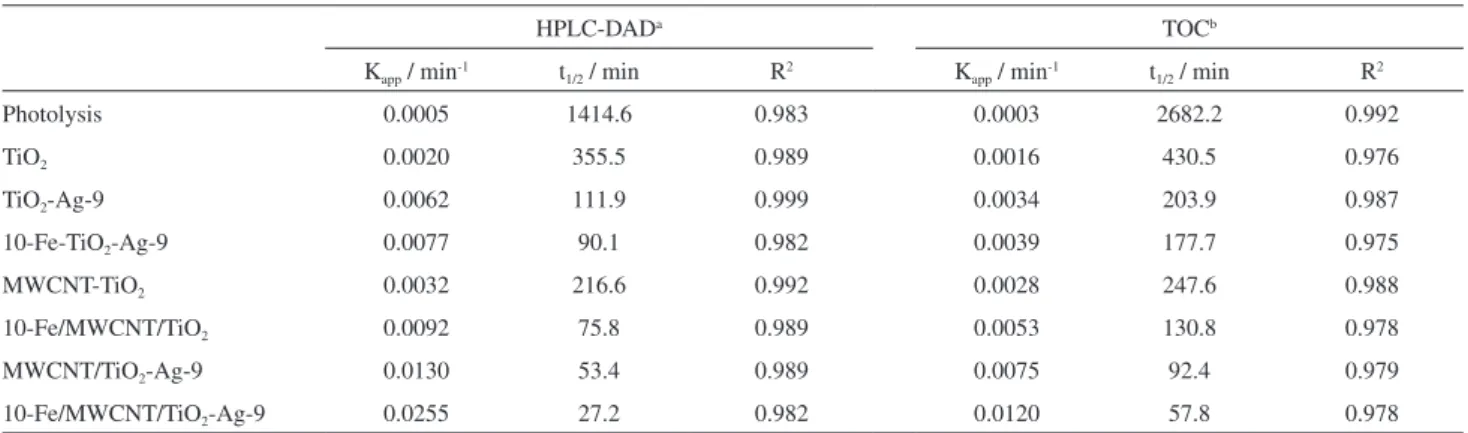
Apparent rate constants (Kapp), half-life times (t1/2) and
the coeficients of determination (R2) are summarized in
Tables 2 and S2 (in the SI section).
Figure 9a and Table S2 show that the highest phenol photodegradation rate is between pH 3.00-5.20 (Kapp = 0.018 to 0.025 min-1 and t1/2 = 38.5 to 27.7 min),
and the smallest photodegradation rates occur at pH levels exceeding 5.2. The values obtained for pH 7 and 10 are Kapp = 0.012 and 0.006 min-1, and t1/2 = 57.8 and 115.5 min,
respectively. The degradation rate is inluenced by the solution pH, where the lowest rates are at pH > pHZPC
(pHZPC > 5.49) for the catalyst.
In Figures 9b and 9c, when comparing the TiO2 reaction
rates with other catalysts, it is clear that the incorporation of MWCNT, Fe and TiO2-Ag in preparation of the catalyst
10-Fe/MWCNT/TiO2-Ag-9 promoted an improvement in
the kinetics of phenol photodegradation.
There was an increase in the reaction speed of 12.5 times with Kapp (TiO2) = 0.0020 min-1 to Kapp
(10-Fe/MWCNT/TiO2-Ag-9) = 0.0255 min-1. Half-lives
of 216.6 min (phenol by HPLC-DAD) and 247.6 min (TOC) were found for the photodegradation with the MWCNT-TiO2 composite. The incorporation of Fe or Ag on
MWCNT/TiO2 increased the reaction rate, with half-life
for 10-Fe/MWCNT/TiO2 and MWCNT/TiO2-Ag-9 of
75.8 and 53.4 min (phenol by HPLC-DAD), and 130.8 and 92.4 min (TOC), respectively. The simultaneous incorporation of Fe and Ag on MWCNT-TiO2 forming
the composite 10-Fe/MWCNT/TiO2-Ag-9 reduces the
half-lives to 27.2 min (phenol by HPLC-DAD) and
57.8 min (TOC), corresponding to Kapp = 0.0255 min-1
(phenol by HPLC-DAD) and 0.0120 min-1 (TOC).
Wang et al.27 reported phenol photodegradation by
20-MWCNT-TiO2 of 96% (initial concentration of
50 mg L-1) after 5 h with K
app = 0.0074 min-1 and
t1/2 = 93 min. Almeida et al.25 evaluated phenol degradation
(initial concentration of 50 mg L-1) by TiO
2/MgZnAl-5
after 6 h, with Kapp = 0.0114 min-1 and t1/2 = 60.8 min.
In the study by Chiou et al.70 using TiO2 P-25, a phenol
degradation of 84% was reported (initial concentration of 50 mg L-1) in 3 h with K
app = 0.014 min-1 and
t1/2 = 49.3 min using a 400 W UV lamp and addition of
H2O2 (0.05 mg L-1). Therefore, one can conclude that the
10-Fe/MWCNT/TiO2-Ag-9 composite photocatalyst
showed satisfactory kinetic performance with the potential to eliminate phenolic compounds in an aqueous medium.
Reuse
For the purpose of practical application, it is necessary to evaluate the reuse and stability of the catalyst. The reuse studies were performed with recovery of the material (300 mg), maintaining constant all other parameters. Thus, the eficiency of 10-Fe/MWCNT/TiO2-Ag-9 was
evaluated by 10 reuse tests lasting 3 h each, totaling 30 h of study. The results showed that the catalyst presented good photocatalytic activity even after ten consecutive cycles. The yield for degradation of phenol was 100% in the irst test and decreased to 92% in the tenth test (inal test). Thus, the 10-Fe/MWCNT/TiO2-Ag-9 catalyst remained stable,
presenting an 8% decrease in phenol degradation eficiency after ten consecutive photocatalytic cycles.
Electron microscopy (Figure S2d), energy dispersive spectroscopy (Figure S3d), X-ray diffraction (Figure 1f) and infrared spectroscopy (Figure 2e) were used to evaluate Table 2. Langmuir-Hinshelwood apparent rate constants (Kapp), half-life (t1/2) and coeficients of determination (R2) for the photodegradation of phenol
measured by HPLC-DAD and TOC
HPLC-DADa TOCb
Kapp / min-1 t1/2 / min R2 Kapp / min-1 t1/2 / min R2
Photolysis 0.0005 1414.6 0.983 0.0003 2682.2 0.992
TiO2 0.0020 355.5 0.989 0.0016 430.5 0.976
TiO2-Ag-9 0.0062 111.9 0.999 0.0034 203.9 0.987
10-Fe-TiO2-Ag-9 0.0077 90.1 0.982 0.0039 177.7 0.975
MWCNT-TiO2 0.0032 216.6 0.992 0.0028 247.6 0.988
10-Fe/MWCNT/TiO2 0.0092 75.8 0.989 0.0053 130.8 0.978
MWCNT/TiO2-Ag-9 0.0130 53.4 0.989 0.0075 92.4 0.979
10-Fe/MWCNT/TiO2-Ag-9 0.0255 27.2 0.982 0.0120 57.8 0.978
the stability of the catalyst. The results showed that there was no change in the chemical/physical characteristics of the 10-Fe/MWCNT/TiO2-Ag-9 catalyst after ten
consecutive photocatalytic cycles.
Conclusions
A m a g n e t i c a l l y r e c o v e r a b l e c a t a l y s t , 10-Fe/MWCNT/TiO2-Ag-9, was successfully synthesized
in this work. The photocatalysts were used in UV-Vis (cut off ilter > 300 nm) photodegradation of phenol in aqueous solution and presented high photocatalytic activity. The 10-Fe/MWCNT/TiO2-Ag-9 composite photocatalyst
resulted in approximately 100% phenol and 85% TOC removal from an aqueous phenol solution of initial concentration equal to 50 mg L-1, after 180 min.
The 10-Fe/MWCNT/TiO2-Ag-9 catalyst showed good
stability after 10 cycles, thus showing promising potential for practical applications. Phenol removal with the novel catalyst was greater than that obtained with commercial TiO2 (Degussa P25) because of its smaller band-gap
energy (2.24 eV vs. 3.20 eV) and lower electron-hole
pair recombination rate due to the presence of silver, iron oxide and MWCNT. Since the 10-Fe/MWCNT/ TiO2-Ag-9 photocatalyst shifted light absorption to a higher
wavelength, less energy was required for photocatalytic activity and the phenol removal efficiency increased. Moreover, iron oxide makes the catalyst magnetic, so that, it is easily separated from the solution by applying an external magnetic ield. The new photocatalysts showed a combined effect of the MWCNT support, the presence of iron oxide associated to the TiO2-Ag photoactivity, resulting in
formation of a composite with high photocatalytic capacity.
Supplementary Information
Supplementary data (annular photoreactor, SEM, EDS, photodegradation of phenol by catalysts with supported TiO2 and Langmuir-Hinshelwood apparent rate constants)
are available free of charge at http://jbcs.sbq.org.br as PDF ile.
Acknowledgments
The authors acknowledge the financial support of the Fundação de Amparo à Pesquisa do Estado de Minas Gerais (FAPEMIG, Universal Demand, process No. APQ-00445-14) and the Conselho Nacional de Desenvolvimento Cientíico e Tecnológico (CNPq). We also thank the Laboratory of Nanomaterials of the DF/ UFMG for providing the multi-walled carbon nanotubes.
References
1. Fox, M. A.; Dulay, M. T.; Chem. Rev. 1993, 93, 341.
2. Liu, J.; Bai, H.; Wang, Y.; Liu, Z.; Zhang, X.; Sun, D. D.;
Adv. Funct. Mater. 2010, 20, 4175.
3. Almeida, L. C.; Zanoni, M. V. B.; J. Braz. Chem. Soc. 2014, 25, 579.
4. Ouyang, K.; Xie, S.; Ma, X.; Ceram. Int. 2013, 39, 7531.
5. Gui, M. M.; Wong, W. M. P.; Chai, S.-P.; Mohamed, A. R.;
Chem. Eng. J. 2015, 278, 272.
6. Devi, L. G.; Nagaraj, B.; Rajashekhar, K. E.; Chem. Eng. J.
2012, 181-182, 259.
7. Sobana, N.; Selvam, K.; Swaminathan, M.; Sep. Purif. Technol.
2008, 62, 648.
8. Stropa, J. M.; Herrero, A. S.; Oliveira, S. C.; Cavalheiro, A. A.; Dantas, F.; Oliveira, S. L.; Oliveira, L. C. S.; J. Braz. Chem. Soc. 2016, 27, 575.
9. Luo, Y.; Lu, Z.; Jiang, Y.; Wang, D.; Yang, L.; Huo, P.; Da, Z.; Bai, X.; Xie, X.; Yang, P.; Chem. Eng. J. 2014, 240, 244. 10. Woan, B. K.; Pyrgiotakis, G.; Sigmund, W.; Adv. Mater. 2009,
21, 2233.
11. Ou, Y.; Lin, J.; Fang, S.; Liao, D.; Chem. Phys. Lett. 2006, 429,
199.
12. Gui, M. M.; Chai, S. P.; Xu, B. Q.; Mohamed, A. R.; Sol. Energy Mater. Sol. Cells 2014, 122, 183.
13. Xin, T.; Ma, M.; Zhang, H.; Gu, J.; Wang, S.; Liu, M.; Zhang, Q.; Appl. Surf. Sci. 2014, 288, 51.
14. Zhou, H.; Zhang, C.; Wang, X.; Li, H.; Du, Z.; Synth. Met. 2011, 161, 2199.
15. Etacheri, V.; Di Valentin, C.; Schneider, J.; Bahnemann, D.; Pillai, S. C.; J. Photochem. Photobiol., C 2015, 25, 1. 16. Luo, Y.; Lu, Z.; Yinhua, J.; Wang, D.; Yang, L.; Huo, P.; Da, Z.;
Bai, X.; Xie, X.; Yang, P.; Chem. Eng. J. 2014, 240, 244. 17. Zhang, P.; Mo, Z.; Han, L.; Wang, Y.; Zhao, G.; Zhang, C.;
J. Mol. Catal. A: Chem. 2015, 402, 17.
18. Aguilar, C. A. H.; Pandiyan, T.; Arenas-Alatorre, J. A.; Singh, N.; Sep. Purif. Technol. 2015, 149, 265.
19. Yin, H.; Dai, X.; Zhu, M.; Li, F.; Feng, X.; Liu, F.; J. Hazard. Mater. 2015, 296, 221.
20. Toledo, T. V.; Bellato, C. R.; do Rosário, R. H.; Marques Neto, J. O.; Quim. Nova 2011, 34, 561.
21. Devi, L. G.; Reddy, K. M.; Appl. Surf. Sci. 2011, 257, 6821.
22. Lin, K. N.; Liou, W. J.; Yang, T. Y.; Lin, H. M.; Lin, C. K.; Chien, S. H.; Chen, W. C.; Wu, S. H.; Diamond Relat. Mater.
2009, 18, 312.
23. Zhou, D.; Ding, L.; Cui, H.; An, H.; Zhai, J.; Li, Q.; J. Power Sources 2013, 222, 510.
24. Wang, X.; Wu, P.; Lu, Y.; Huang, Z.; Zhu, N.; Lin, C.; Dang, Z.; Sep. Purif. Technol. 2014, 132, 195.
26. Li, H.; Ma, Y.; Niu, R.; Sep. Purif. Technol. 2016, 171, 93. 27. Wang, W.; Serp, P.; Kalck, P.; Lu, J.; J. Mol. Catal. A: Chem.
2005, 235, 194.
28. Rather, S.; Mehrajuddin, N.; Zacharia, R.; Hwang, S. W.; Kim, A. R.; Nahm, K. S.; Int. J. Hydrogen Energy 2009, 34, 961. 29. Ai, L.; Jiang, J.; Chem. Eng. J. 2012, 192, 156.
30. Quiñones, D. H.; Rey, A.; Álvarez, P. M.; Beltrán, F. J.; Plucinski, P. K.; Appl. Catal., B 2014, 144, 96.
31. Kim, C.; J. Ind. Eng. Chem. (Amsterdam, Neth.)2015, 31, 43. 32. Wang, H.; Cao, L.; Yan, S.; Huang, N.; Xiao, Z.; Mater. Sci.
Eng., B 2009, 164, 191.
33. Miranda, L. D. L.; Bellato, C. R.; Milagres, J. L.; Moura, L. G.; Mounteer, A. H.; de Almeida, M. F.; J. Environ. Manage. 2015,
156, 225.
34. Aysin, B.; Ozturk, A.; Park, J.; Ceram. Int. 2013, 39, 7119. 35. Yang, Y.; Liu, E.; Dai, H.; Kang, L.; Wu, H.; Int. J. Hydrogen
Energy 2013, 39, 7664.
36. Pugazhenthiran, N.; Murugesan, S.; Anandan, S.; J. Hazard. Mater. 2013, 263, 541.
37. Koo, Y.; Littlejohn, G.; Collins, B.; Yun, Y.; Shanov, V. N.; Schulz, M.; Pai, D.; Sankar, J.; Composites Part B 2014, 57, 105.
38. Aazam, E. S.; Ceram. Int. 2014, 40, 6705.
39. Stéfani, D.; Paula, A. J.; Vaz, B. G.; Silva, R. A.; Andrade, N. F.; Justo, G. Z.; Ferreira, C. V.; Filho, A. G. S.; Eberlin, M. N.; Alves, O. L.; J. Hazard. Mater. 2011, 189, 391.
40. Saleh, T. A.; Gupta, V. K.; J. Colloid Interface Sci. 2011, 362, 337.
41. Anbarasu, M.; Anandan, M.; Chinnasamy, E.; Gopinath, V.; Balamurugan, K.; Spectrochim. Acta, Part A 2015, 135, 536.
42. Zhang, X.; Lei, L.; J. Hazard. Mater. 2008, 153, 827. 43. Froment, F.; Tournié, A.; Colomban, P.; J. Raman Spectrosc.
2008, 39, 560.
44. Neff, D.; Ludovic, B.-G.; Philippe, D.; Solen, R.; Ludovic, L.;
J. Raman Spectrosc. 2007, 38, 1538.
45. Ma, L.; Chen, A.; Lu, J.; Zhang, Z.; He, H.; Li, C.; Particuology
2014, 14, 24.
46. Nossol, A. B. S.; Suzamar, M. C. R. S.; Nossol, E.; Zarbin, A. J. G.; Peralta-Zamora, P.; Quim. Nova 2016, 10, 1. 47. Jaafar, N. F.; Jalil, A. A.; Triwahyono, S.; Efendi, J.; Mukti,
R. R.; Jusoh, R.; Jusoh, N. W. C.; Karim, A. H.; Salleh, N. F. M.; Suendo, V.; Appl. Surf. Sci. 2015, 338, 75.
48. Gao, B.; Jiang, Z.; Zhao, C.; Gomaa, H.; Pan, F.; J. Membr. Sci.
2015, 492, 230.
49. Choudhury, B.; Choudhury, A.; Mater. Chem. Phys. 2012, 132, 1112.
50. Calandra, P.; Lombardo, D.; Pistone, A.; Liveri, V. T.; Trusso, S.; J. Nanopart. Res. 2011, 13, 5833.
51. Liu, S. S.; Sun, H.; Liu, S. S.; Wang, S.; Chem. Eng. J. 2013,
214, 298.
52. Sampaio, M. J.; Silva, C. G.; Marques, R. R. N.; Silva, A. M. T.; Faria, J. L.; Catal. Today 2011, 161, 91.
53. Tang, Y.; Zhang, G.; Liu, C.; Luo, S.; Xu, X.; Chen, L.; Wang, B.; J. Hazard. Mater. 2013, 252-253, 115.
54. He, J.; Ichinose, I.; Kunitake, T.; Nakao, A.; Langmuir 2002,
18, 10005.
55. Harii, T.; Montazer, M.; Ultrason. Sonochem. 2015, 27, 543. 56. Harii, T.; Montazer, M.; Appl. Catal., A 2014, 473, 104.
57. Jia, X.; Dai, R.; Lian, D.; Han, S.; Wu, X.; Song, H.; Appl. Surf. Sci. 2017, 392, 268.
58. Ghavami, M.; Mohammadi, R.; Koohi, M.; Kassaee, M. Z.;
Mater. Sci. Semicond. Process. 2014, 26, 69.
59. Tang, Y.; Luo, S.; Teng, Y.; Liu, C.; Xu, X.; Zhang, X.; Chen, L.; J. Hazard. Mater. 2012, 241-242, 323.
60. Yeh, N.; Lee, Y. C.; Chang, C. Y.; Cheng, T. C.; Thin Solid Films
2013, 549, 93.
61. Lu, Z.; Chen, F.; He, M.; Song, M.; Ma, Z.; Shi, W.; Yan, Y.; Lan, J.; Li, F.; Xiao, P.; Chem. Eng. J. 2014, 249, 15.
62. Yu, J.; Yu, H.; Ao, C. H.; Lee, S. C.; Yu, J. C.; Ho, W.; Thin Solid Films 2006, 496, 273.
63. McManamon, C.; Holmes, J. D.; Morris, M.; J. Hazard. Mater.
2011, 193, 120.
64. Khraisheh, M.; Wu, L.; Al-Muhtaseb, A. H.; Albadarin, A. B.; Walker, G. M.; Chem. Eng. J. 2012, 213, 125.
65. Nogueira, R. F. P.; Jardim, W. F.; Quim. Nova 1998, 2, 69. 66. Sclafani, A.; Herrmann, J.-M.; J. Photochem. Photobiol., A
1998, 113, 181.
67. Zhao, W.; Zhang, J.; Zhu, X.; Zhang, M.; Tang, J.; Tan, M.; Wang, Y.; Appl. Catal., B 2014, 144, 468.
68. Liu, W.; Zhao, X.; Borthwick, A. G. L.; Wang, Y.; Ni, J.; ACS Appl. Mater. Interfaces 2015, 17,19726.
69. Liu, W.; Ni, J.; Yin, X.; Water Res. 2014, 53, 12.
70. Chiou, C.; Wu, C.; Juang, R.; Chem. Eng. J. 2008, 139, 322. 71. Shaban, Y. A.; El Sayed, M. A.; El Maradny, A. A.; Al Farawati,
R. Kh.; Al Zobidi, M. I.; Chemosphere 2013, 91, 307. 72. Grabowska, E.; Sobczak, J. W.; Gazda, M.; Zaleska, A.; Appl.
Catal., B: Environ. 2012, 117-118, 351.
73. Ling, H.; Kim, K.; Liu, Z.; Shi, J.; Zhu, X.; Huang, J.; Catal. Today 2015, 258, 96.
74. Mohamed, M. A.; Salleh, W. N. W.; Jaafar, J.; Ismail, A. F.; Nor, N. A. M.; Mater. Chem. Phys. 2015, 162, 113.
75. Murcia, J. J.; Hidalgo, M. C.; Navío, J. A.; Araña, J.; Doña-Rodríguez, J. M.; Appl. Catal., B: Environ. 2015, 179, 305.
76. Qiu, R.; Zhang, D.; Diao, Z.; Huang, X.; He, C.; Morel, J.-L.; Xiong, Y.; Water Res. 2012, 46, 2299.
77. Andrade, M. A.; Carmona, R. J.; Mestre, A. S.; Matos, J.; Carvalho, A. P.; Ania, C. O.; Carbon 2014, 76, 183.
Submitted: March 3, 2017