Liver markers, prevalence of the metabolic syndrome
abnormalities and effect of Roux-en-Y gastric bypass in
morbidly obese subjects
Marcadores hepáticos, prevalência de alterações da síndrome metabólica e efeito do
bypass
gástrico com reconstrução em Y-de-Roux em pacientes obesos mórbidos
Ary Serpa Neto1, Felipe Martin Bianco Rossi1, Rodrigo Dal Moro Amarante1, Marçal Rossi1
ABSTRACT
Objectives: To evaluate the relations between liver markers (GGT, ALT and AST) and the metabolic syndrome (and its components) in morbidly obese subjects, and to determine the response of these metabolic factors and hepatic enzymes after weight loss induced by Roux-en-Y gastric bypass. Methods: This study was carried out at a university hospital, in Santo André (SP), Brazil. We evaluated 140 morbidly obese subjects aged from 18 to 60 years submitted to a Roux-en-Y gastric bypass, who were followed for a mean period of 8 months. Patients with a history of heavy drinking, type 1 diabetes, and/or liver disease were excluded.Results: Liver markers, most notably GGT, were strongly associated with metabolic abnormalities, mainly hyperglycemia. The prevalence of type 2 diabetes significantly increased with increasing levels of GGT (highest versus lowest quartile GGT: odds ratio 3.89 [95%CI: 1.07-14.17]). Liver markers significantly decreased 8 months after the Roux-en-Y gastric bypass and the reduction of GGT levels were associated with the reduction of glucose levels (Pearson r = 0.286; p = 0.001). Conclusions: Elevated levels of liver markers, principally GGT, in morbidly obese subjects are associated with metabolic abnormalities. In addition to the well-known benefits of bariatric surgery, Roux-en-Y gastric bypass, reduced the levels of liver markers to the normal range.
Keywords: Obesity, morbid; Biological markers; Metabolic syndrome; Anastomosis, Roux-en-Y
RESUMO
Objetivos: Avaliar as relações entre os marcadores hepáticos (GGT, ALT e TGO) e a síndrome metabólica (e seus componentes) em indivíduos com obesidade mórbida, e determinar a resposta desses fatores metabólicos e enzimas hepáticas após a perda de peso induzida pelo bypass gástrico em Y-de-Roux. Métodos: Estudo
realizado em um hospital universitário, localizado em Santo André (SP). Foram avaliados 140 indivíduos com obesidade mórbida, entre 18 e 60 anos de idade, submetidos ao bypass gástrico em Y-de-Roux, acompanhados por um período médio de 8 meses. Pacientes com história de alcoolismo pesado, diabetes tipo 1 e/ou doença hepática foram excluídos. Resultados: Os marcadores hepáticos, principalmente GGT, foram fortemente associados a alterações metabólicas, principalmente hiperglicemia. A prevalência de diabetes tipo 2 aumentou significativamente com a elevação dos níveis de GGT [quartil superior versus inferior: odds ratio 3,89 (IC95%: 1,07-14,17)]. Os marcadores hepáticos diminuíram significativamente 8 meses após o bypass em Y-de-Roux e a redução dos níveis de GGT estava associada à redução dos níveis de glicose (Pearson r = 0,286; p = 0,001). Conclusões: Níveis elevados de marcadores hepáticos, principalmente GGT, em pacientes com obesidade mórbida, estavam associados a alterações metabólicas. Além dos já conhecidos benefícios da cirurgia bariátrica, o bypass gástrico em Y-de-Roux reduziu os níveis dos marcadores hepáticos a valores normais.
Descritores: Obesidade mórbida; Marcadores biológicos; Síndrome metabólica; Anastomose em-Y de Roux
INTRODUCTION
Metabolic syndrome (MS), characterized by a core set of disorders, including abdominal obesity, dyslipidemia, hypertension, and hyperglycemia, has been shown to
be an important predictor of type 2 diabetes mellitus
(DM2) and of cardiovascular disease(1). Recent research
has provided evidence that a wider constellation of disorders may be part of the MS cluster. These proposed nontraditional components of MS include
Study carried out at Faculdade de Medicina do ABC – FMABC, Santo André (SP), Brazil.
1 Faculdade de Medicina do ABC – FMABC, Santo André (SP), Brazil.
Corresponding author: Ary Serpa Neto – Avenida Lauro Gomes, 2.000 – Sacadura Cabral – CEP 09060-6300 – Santo André (SP), Brazil – Tel.: 11 4993-5400 – E-mail: [email protected]
Received on: Apr 11, 2011 – Accepted on: Oct 25, 2011
microalbuminuria, subclinical inflammation, and
nonalcoholic fatty liver disease (NAFLD)(2,3).
Subjects with NAFLD, which is the most common
cause of chronically elevated transaminase levels(4),
have been reported to have high prevalence rates of MS
and associated disorders(5). Alanine aminotransferase
(ALT) is the most specific marker of hepatic dysfunction resulting from the insulin resistance syndrome. Gamma-glutamyltransferase (GGT) is considered a sensitive
indicator of liver damage, but is not specific(6).
A number of cross-sectional studies showed relation between GGT and ALT and the MS and insulin resistance, suggesting that GGT/ALT may serve as a
marker for insulin resistance(7,8). Furthermore, liver
markers have been shown to be associated with MS variables in large representative samples of the general
population(4,9).
OBJECTIVES
To examine the cross-sectional relationships between liver markers (GGT, ALT and AST) and the MS (and its components) in morbidly obese subjects; to determine the response of these metabolic factors and hepatic enzymes after weight loss induced by Roux-en-Y gastric bypass (RYGBP); and to evaluate whether liver markers provide useful supplementary markers identifying subjects at a high risk of DM2 and in particular whether they provide further prognostic information in patients with MS.
METHODS
Institution
This study was carried out at a University Hospital, in
Santo André (SP), Brazil.
Study population
A total of 140 morbidly obese patients were considered eligible to participate in this study according to the
inclusion criteria: body mass index (BMI) ≥ 40 kg/
m², age between 18 and 60 years, and no history of liver disease. Patients with a history of heavy drinking
(three or more drinks per day) or with type 1 diabetes
mellitus (DM1) were excluded. Most patients (68.5%)
were women and the mean BMI was 46.1 ± 5.4 kg/m²
(40.0 - 65.6 kg/m²).
Study protocol and follow-up
Pre and postoperative (at 8 months after bariatric surgery) blood samples were taken after a minimum
fasting period of 8 hours. BMI is defined as the individual’s body weight divided by the square of his/her height. To define MS, we used the International Diabetes
Federation (IDF) criteria: waist circumference ≥ 94 cm in
men, ≥ 80 cm in women or BMI ≥ 30 kg/m²; triglycerides
levels ≥ 150 mg/dL (1.7 mmol/L) and/or specific
treatment; HDL-C levels < 40 mg/dL (1 mmol/L) in men, < 50 mg/dL (1.3 mmol/L) in women and/or specific
treatment; fasting glucose ≥ 100 mg/dL (5.6 mmol/L) and/
or DM2 patient; systolic blood pressure ≥ 130 mmHg,
diastolic blood pressure ≥ 85 mmHg and/or specific
treatment. The individual must present at least three of the five risk factors to be diagnosed with MS.
The obese patients underwent laparoscopic RYGBP and after 8 months all tests were repeated. RYGBP is a mixed technique that is more restrictive and less malabsorptive. Its main characteristics are
the formation of gastric “pouch” (15 ± 5 mL), an
alimentary loop of 100 cm, a biliopancreatic loop of 60 cm, and a common loop.
Statistical methods
Data were first tested for normal distribution with the Kolmogorov-Smirnoff test. For cross-section comparisons, concentration of liver markers between those with and without baseline MS and its components were compared using ANCOVA adjusted for age, sex, and ethnicity. The patients were divided into four equal quartiles on the basis of ALT, AST, AST-to-ALT ratio, and GGT distributions, and linear regression analysis was used to test for trends across the four groups fitting quantitative variables for the four groups.
For prospective analyses, baseline means (with standard deviation – SD) were calculated for subjects
by follow-up with t tests, Wilcoxon tests, or χ2 tests. The
association between liver markers with anthropometric and metabolic variables was evaluated using Pearson’s correlation analysis controlled for age, ethnicity, and sex. Multivariate logistic regression models were used to assess associations of liver markers with the risk of prevalent MS and with its improvement after weight loss, taking into account potential confounders. Each liver marker was modeled as either a continuous variable (with risk expressed per SD increase in the natural log of the marker) or as a categorical variable,
comparing risk among those in the fourth quartile versus
those in the first quartile. Two models were constructed for each liver marker: in model A, adjustments were made only for age; and in model B, for age, sex and ethnicity. It has been pointed out that the AST-to-ALT ratio may be informative in differentiating alcoholic
was considered an additional exposure variable(10). We
evaluated the degree to which liver markers predicted improvement of MS after RYGBP using logistic regression.
All statistical analyses were made with the statistical
software package Statistical Package for the Social Science
(SPSS), version 16.0 (Chicago, IL) and MedCalc software. Statistical significance was considered at p < 0.05.
RESULTS
Table 1 shows the baseline characteristics by quartiles of the GGT, ALT, and AST distributions. With the exception of the white cell count, all the metabolic risk factors significantly increased with increasing GGT levels, whereas HDL levels decreased with it. The prevalence of diabetes and hypertension also increased with increasing levels of GGT. ALT was
significantly associated with glucose levels and with diabetes prevalence, but showed a significant inverse relationship with the white cell count. AST was associated only with glucose levels. The prevalence of MS did not correlate with increasing levels of GGT, ALT, or AST. However, GGT and AST increased significantly with the increasing number of metabolic abnormalities (p = 0.003 and p = 0.048, respectively). Mean GGT values for those with 1, 2, 3, 4, and 5 abnormalities were 31.8, 33.7, 38.0, 64.0, and 51.8 units/L, respectively, and for AST the corresponding means were 23.9, 27.4, 27.4, 29.6, and 32.4 units/L, respectively (Table 2).
MS disorders, when assessed individually, were characterized by significant differences only in GGT, before bariatric surgery (Table 2). After surgery no liver marker differed in subjects with MS or metabolic disorders assessed individually. Some situations approached significance, however, due to the median
Table 1. GGT, AST, ALT and metabolic and cardiovascular risk factors
GGT (IU/L) Quartiles p value
≤ 27 28 – 35.9 36 – 42.9 ≥ 43
Age (years) 35.4 ± 10.2 37.2 ± 9.9 37.3 ± 10.0 39.3 ± 10.1 0.120
BMI (kg/m2) 44.3 ± 4.5 43.0 ± 3.1 43.7 ± 3.7 45.3 ± 5.6 0.287
Diabetes mellitus (%) 8.3 15.6 11.1 33.3 0.012
Hypertension (%) 36.1 37.5 41.7 72.2 0.002
Metabolic markers HDL (mg/dL) Triglycerides (mg/dL) Glucose (mg/dL) White cell count (109/L)
49.1 ± 11.8 139.8 ± 73.1
91.5 ± 17.6 7.7 ± 1.8
49.8 ± 10.2 137.4 ± 74.2
95.8 ± 21.9 7.6 ± 2.0
46.0 ± 9.8 166.1 ± 95.2
98.6 ± 21.2 6.9 ± 1.4
44.6 ± 11.4 180.3 ± 95.5 109.6 ± 30.0 7.2 ± 2.2
0.037 0.021 0.001 0.143
Metabolic syndrome (%) 66.7 53.1 50.0 47.2 0.098
ALT (IU/L) ≤ 22 23 – 29.9 30 – 39.6 ≥ 39.7
Age (years) 35.5 ± 10.3 38.3 ± 9.5 36.9 ± 9.9 38.7 ± 10.4 0.265
BMI (kg/m2) 43.3 ± 3.4 44.1 ± 3.5 43.9 ± 4.0 45.2 ± 6.1 0.104
Diabetes mellitus (%) 10.8 9.1 22.9 25.7 0.041
Hypertension (%) 43.2 51.5 37.1 57.1 0.463
Metabolic markers HDL (mg/dL) Triglycerides (mg/dL) Glucose (mg/dL) White cell count (109/L)
47.3 ± 11.5 136.1 ± 66.0
91.8 ± 18.4 8.1 ± 1.8
46.8 ± 9.6 163.0 ± 80.7
97.4 ± 25.8 7.2 ± 2.0
49.5 ± 12.2 154.6 ± 101.2
100.5 ± 22.9 7.3 ± 1.6
45.7 ± 10.3 173.5 ± 93.8 106.4 ± 26.8 6.8 ± 2.0
0.793 0.105 0.009 0.008
Metabolic syndrome (%) 64.9 57.6 40.0 54.3 0.184
AST (IU/L) ≤ 20 21 – 24.9 25 – 33.9 ≥ 34
Age (years) 36.5 ± 8.8 37.1 ± 10.5 36.3 ± 10.8 39.2 ± 9.8 0.336
BMI (kg/m2) 43.8 ± 4.4 43.6 ± 3.6 43.9 ± 3.4 45.2 ± 5.8 0.163
Diabetes mellitus (%) 13.3 8.6 20.5 25.0 0.096
Hypertension (%) 53.3 34.3 46.2 55.6 0.557
Metabolic markers HDL (mg/dL) Triglycerides (mg/dL) Glucose (mg/dL) White cell count (109/L)
47.8 ± 12.8 143.0 ± 85.3
97.1 ± 20.0 8.0 ± 1.7
48.1 ± 10.7 165.3 ± 81.5
93.2 ± 18.0 7.3 ± 1.7
47.9 ± 10.8 142.7 ± 76.9
95.7 ± 21.7 7.1 ± 2.0
45.5 ± 9.8 173.9 ± 100.2
109.5 ± 30.8 7.1 ± 2.0
0.406 0.313 0.023 0.068
Metabolic syndrome (%) 60.0 60.0 48.7 50.0 0.281
Table 2. Concentrations of liver markers in morbidly obese subjects with and without IDF-defined metabolic syndrome and its components at baseline and after 8 months of Roux-en-Y gastric bypass
Liver markers Yes/No AST (IU/L) ALT (IU/L) GGT (IU/L) AST-to-ALT ratio (IU/L)
Before Roux-en-Y gastric bypass
IDF metabolic syndrome No
Yes
28.1 ± 10.6 27.5 ± 12.4
33.6 ± 11.6 34.3 ± 21.2
41.0 ± 22.1 41.2 ± 35.2
0.86 ± 0.22 0.90 ± 0.33
Fasting hyperglycemia No
Yes
27.0 ± 11.8 29.3 ± 11.2
32.5 ± 18.6 36.6 ± 14.9
35.8 ± 19.1 50.6 ± 41.6
0.91 ± 0.30 0.84 ± 0.24
Elevated triglyceride No
Yes
27.0 ± 12.3 28.6 ± 10.9
31.8 ± 18.2 36.1 ± 16.5
38.9 ± 35.0 43.3 ± 23.8
0.92 ± 0.31 0.85 ± 0.25
Reduced HDL No
Yes
27.3 ± 9.2 28.2 ± 13.2
34.6 ± 15.1 33.5 ± 19.0
37.2 ± 21.3 44.0 ± 34.6
0.87 ± 0.33 0.89 ± 0.24
Hypertension No
Yes
27.4 ± 12.0 28.3 ± 11.2
33.1 ± 18.9 34.9 ± 15.7
35.3 ± 17.6 47.7 ± 38.5
0.89 ± 0.25 0.87 ± 0.31 After Roux-en-Y gastric bypass
IDF metabolic syndrome No
Yes
21.2 ± 8.4 26.8 ± 9.9
21.6 ± 12.0 24.4 ± 12.7
21.5 ± 16.2 35.3 ± 25.4
1.08 ± 0.42 1.29 ± 0.67
Fasting hyperglycemia No
Yes
21.8 ± 8.8 22.8 ± 8.0
22.0 ± 12.0 21.6 ± 13.9
22.5 ± 17.8 37.6 ± 18.6
1.09 ± 0.42 1.51 ± 1.11
Elevated triglyceride No
Yes
21.7 ± 8.5 25.6 ± 12.6
21.9 ± 11.8 23.6 ± 17.0
23.0 ± 17.3 24.8 ± 29.6
1.09 ± 0.45 1.33 ± 0.63
Reduced HDL No
Yes
21.3 ± 7.6 22.2 ± 9.2
23.9 ± 15.4 20.9 ± 9.8
22.1 ± 15.3 23.6 ± 19.2
0.99 ± 0.29 1.17 ± 0.52
Hypertension No
Yes
21.6 ± 8.9 23.7 ± 7.4
22.0 ± 12.5 21.7 ± 9.33
21.9 ± 17.8 29.4 ± 18.1
1.08 ± 0.44 1.23 ± 0.58 Adjusted for age, sex and ethnicity. p < 0.05. IDF: International Diabetes Federation.
number of patients and the restrictive effect of the model (sex, age, and ethnicity), significance was not reached.
Associations of liver markers with anthropometric and metabolic variables in morbidly obese patients before and after RYGBP are analyzed. Before surgery AST, ALT, and GGT levels showed positive correlations with fasting glucose, GGT showed an inverse correlation with HDL, ALT showed and inverse correlation with the white cell count, and the AST-to-ALT ratio showed a positive correlation with the white cell count. The magnitude of these associations was strongest for GGT, especially for fasting glucose and HDL. After surgery, only age correlated with liver markers.
Prevalence rates and odds ratio of DM2 by the four groups of ALT, GGT, and AST, using those in the lowest quartile as the reference group, are analyzed. Only GGT values, when adjusted for age, were significantly predictive of DM2. We further examined the relation, adjusting for sex, ethnicity, and age. Such adjustment, as shown in table 2 column B, reduced the risk to levels below statistical significance. On a receiver operating characteristic curve (ROC curve), GGT showed the larger area when compared with AST and ALT (0.670, 0.627, and 0.639, respectively) (Figure 1).
In the analysis of liver markers and prediction of individual MS components, only GGT values were
significantly associated with prevalent hypertension. These associations were significant regardless of whether the exposures were modeled as continuous (risk per SD increase: 1.23 [1.02 – 1.33]) or categorical variables
(quartile 4 versus quartile 1: 3.95 [1.33 – 11.69]).
Table 4. Sensitivity and specificity for selected thresholds of GGT, ALT and AST for predicting metabolic syndrome improvement
Markers Sensitivity (95%CI) Specificity (95%CI) AUC (95%CI)*
GGT (IU/L) 0.56 (0.47 - 0.64)
Threshold 27 31.4 (20.9 - 43.6) 80.0 (68.7 - 88.6)
Threshold 35 50.0 (37.8 - 62.2) 52.8 (40.6 - 64.9)
Threshold 43 77.1 (65.6 - 86.3) 28.5 (18.4 - 40.6)
Threshold 54 84.2 (73.6 - 91.9) 18.5 (10.3 - 29.7)
Threshold 31¶ 44.2 (32.4 - 56.7) 70.0 (57.9 - 80.4)
ALT (IU/L) 0.57 (0.48 - 0.65)
Threshold 22 32.8 (22.1 - 45.1) 80.0 (68.7 - 88.6)
Threshold 30 58.5 (46.2 - 70.2) 58.5 (46.2 - 70.2)
Threshold 40 75.7 (64.0 - 85.2) 21.4 (12.5 - 32.9)
Threshold 52 87.1 (77.0 - 93.9) 8.5 (3.2 - 17.7)
Threshold 33¶ 64.2 (51.9 - 75.4) 52.8 (40.6 - 64.9)
AST (IU/L) 0.55 (0.46 - 0.63)
Threshold 20 31.4 (20.9 - 43.6) 78.5 (67.1 - 87.5)
Threshold 25 55.7 (43.3 - 67.6) 54.2 (41.9 - 66.3)
Threshold 35 78.5 (67.1 - 87.5) 18.5 (10.3 - 29.7)
Threshold 40 90.0 (80.5 - 95.9) 12.8 (6.1 - 23.0)
Threshold 23¶ 51.4 (39.2 - 63.6) 64.2 (51.9 - 75.4)
* Area under the curve derived from receiver-operating characteristic analyses. ¶ Threshold maximizing the sum of sensitivity and specificity.
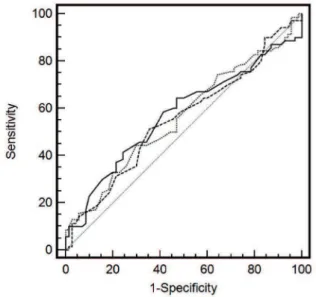
Table 4 and figure 2 show sensitivity and specificity for selected threshold values of ALT, GGT, and AST predicting improvement of the MS 8 months after the RYGBP in morbidly obese subjects. The receiver operating characteristic analyses suggested AST, ALT, and GGT cut-off values of 23, 33, and 31 IU/L with corresponding sensitivities of 51.4, 64.2, and 44.2%. The area under the curve for the three markers was similar.
Table 3. Liver markers before and eight months after Roux-en-Y gastric bypass
Markers Before RYGB After RYGB p value*
ALT (IU/L) 33.99 ± 17.47 22.00 ± 12.09 < 0.0001
AST (IU/L) 27.85 ± 11.65 21.92 ± 8.75 < 0.0001
GGT (IU/L) 41.15 ± 29.9 23.10 ± 17.99 < 0.0001
AST-to-ALT ratio 0.88 ± 0.28 1.11 ± 0.46 < 0.0001
Bilirubin (mg/dL) 0.61 ± 0.52 0.62 ± 0.41 0.870
* Paired-samples t Test. RYGBP: Roux-en-Y gastric bypass.
DISCUSSION
In the present study we documented, among morbidly obese subjects, significant cross-sectional associations of liver markers, primarily GGT, with metabolic abnormalities, most notably fasting hyperglycemia. Furthermore, at baseline, GGT and ALT levels increased significantly with the increase in number of metabolic abnormalities. Also, we demonstrated that concentrations of GGT were associated with an almost fourfold increased in DM2 prevalence and threefold increase in hypertension prevalence after adjustment for age. In contrast, significant associations with ALT/ AST and metabolic abnormalities were not seen in the multivariate analysis. Finally, liver markers significantly decreased 8 months after the RYGBP, and the reduction of GGT levels was associated with the reduction of glucose levels.
In earlier results, our group showed the beneficial
effects of RYGBP in MS(11,12) and renal function of
morbidly obese subjects(13). However, as demonstrated
by prior studies, we showed that RYGBP can reduce
liver markers to normal levels(14-16). Obesity is a major
risk factor for the development of fatty liver disease, and several studies have associated elevated liver enzymes,
obesity, and DM2(17). A growing body of evidence also
supports the notion that NAFLD is a feature of the MS and that the elevations of liver markers found in this situation, particularly of ALT, are prospectively associated
with incident DM2, an important sequel of the MS(9,18-21).
There are a number of possible mechanisms to explain the associations of liver markers with MS and its factors. First, these markers are known to be significantly correlated with increased hepatic fat content, a disorder Eight months after surgery, all liver markers
(with the exception of bilirubin) showed a significant decrease, as shown in table 3. The drop was more accentuated in GGT, followed by ALT. The AST-to-ALT ratio showed an inverse ratio before surgery
(0.88 versus 1.11). After surgery, the ΔBMI correlated
with ΔMSFactors (Pearson r = 0.195; p = 0.021) and
the ΔGGT correlated with ΔGlucose (Pearson r =
0.286; p = 0.001).
that has detrimental effects on components of the MS(22).
It has been demonstrated that hepatic fat content, directly measured using proton spectroscopy, is associated with several features of insulin resistance independent of body weight. In particular, hepatic fat was associated with defects in the suppression by insulin of endogenous
glucose production(23), which is noteworthy in the context
of our results showing that all livers markers were related to fasting hyperglycemia. It is also possible that these associations reflect more generalized insulin resistance.
Fat accumulation in the liver can stimulate cytokine production, and it was found that inflammatory cytokines,
such as tumor necrosis factor-alpha (TNF-α) and
interleukin-6 (IL-6) can influence fatty acid metabolism in
the liver and predispose to the formation of fatty liver(24).
Thus, another possible mechanism is that elevated liver enzymes may reflect inflammation, which in turn impairs insulin signaling in both the liver and other organs. Inflammation has been associated with the development
of diabetes(25). It has also been suggested that GGT might
be an early marker of oxidative stress(26,27). Inflammation
is one manifestation of oxidative stress, and the pathways that generate the mediators of inflammation, such as adhesion molecules and interleukins, are all induced
by oxidative stress(28). This may explain the association
between inflammation, which might reveal nonalcoholic steatohepatitis, and GGT.
The contribution of the present study is the demonstration that liver markers, mainly GGT, are significantly associated with metabolic abnormalities and that GGT also correlates with DM2 and hypertension prevalence in a well-characterized multiethnic cohort of morbidly obese subjects. The weight loss induced by RYGBP can reduce liver markers to levels in the normal range and this decline, in GGT, is associated with an improvement in glucose metabolism. The main limitation of our study is the number of patients, which hinders the finding of a statistically significant result in a very restricted logistic regression model.
CONCLUSIONS
Elevated levels of liver markers, principally GGT, in morbidly obese subjects are associated with metabolic abnormalities. In addition to the well-known benefits of bariatric surgery, Roux-en-Y gastric bypass, reduced the levels of liver markers to the normal range.
REFERENCES
1. Sattar N, Gaw A, Scherbakova O, Ford I, O’Reilly DS, Haffner SM, et al. Metabolic syndrome with and without C-reactive protein as a predictor of coronary heart disease and diabetes in the West of Scotland Coronary Prevention Study. Circulation. 2003;108(4):414-9.
2. Mulhall BP, Ong JP, Younossi ZM. Non-alcoholic fatty liver disease: an overview. J Gastroenterol Hepatol. 2002;17(11):1136-43.
3. Serpa Neto A, Rossi FM, Amarante RD, Buriti NA, Rossi M. Impact of plasmatic lipids in glycemic control and its influence in the cardiometabolic risk in morbidly obese subjects. Arq Bras Endocrinol Metabol. 2009;53(6):747-54.
4. Clark JM, Diehl AM. Nonalcoholic fatty liver disease: an underrecognized cause of cryptogenic cirrhosis. JAMA. 2003;289(22):3000-4.
5. Marchesini G, Brizi M, Bianchi G, Tomassetti S, Bugianesi E, Lenzi M, et al. Nonalcoholic fatty liver disease: a feature of the metabolic syndrome. Diabetes. 2001;50(8):1844-50.
6. Penn R, Worthington DJ. Is serum gamma-glutamyltransferase a misleading test? Br Med J (Clin Res Ed). 1983;286(6364):531-5.
7. Rantala AO, Lilja M, Kauma H, Savolainen MJ, Reunanen A, Kesäniemi YA. Gamma-glutamyl transpeptidase and the metabolic syndrome. J Intern Med. 2000;248(3):230-8.
8. Jeong SK, Nam HS, Rhee JA, Shin JH, Kim JM, Cho KH. Metabolic syndrome and ALT: a community study in adult Koreans. Int J Obes Relat Metab Disord. 2004;28(8):1033-8.
9. Liangpunsakul S, Chalasani N. Unexplained elevations in alanine aminotransferase in individuals with the metabolic syndrome: results from the third National Health and Nutrition Survey (NHANES III). Am J Med Sci. 2005;329(3):111-6.
10. Hunt KJ, Resendez RG, Williams K, Haffner SM, Stern MP; San Antonio Heart Study. National Cholesterol Education Program versus World Health Organization metabolic syndrome in relation to all-cause and cardiovascular mortality in the San Antonio Heart Study. Circulation. 2004;110(10):1251-7. 11. Rossi M, Barretto Fereira da Silva R, Chaves Alcântara G Jr, Regina PF, Martin
Bianco Rossi F, Serpa Neto A, et al. Remission of metabolic syndrome: a study of 140 patients six months after Roux-en-Y gastric bypass. Obes Surg. 2008;18(5):601-6.
12. Rossi M, Serpa Neto A, Rossi FM, Amarante RD, Alcântara GC Jr, Silva RB, et al. Percentage of excess BMI lost correlates better with improvement of metabolic syndrome after Roux-en-Y gastric bypass in morbidly obese subjects: anthropometric indexes and gastric bypass. Surg Obes Relat Dis. 2009;5(1):11-8.
13. Serpa Neto A, Bianco Rossi FM, Dal Moro Amarante R, Alves Buriti N, Cunha Barbosa Saheb G, Rossi M. Effect of weight loss after Roux-en-Y gastric bypass, on renal function and blood pressure in morbidly obese patients. J Nephrol. 2009;22(5):637-46.
14. Kral JG, Thung SN, Biron S, Hould FS, Lebel S, Marceau S, et al. Effects of surgical treatment of the metabolic syndrome on liver fibrosis and cirrhosis. Surgery. 2004;135(1):48-58.
15. Dixon JB, Bhathal PS, Hughes NR, O’Brien PE. Nonalcoholic fatty liver disease: improvement in liver histological analysis with weight loss. Hepatology. 2004;39(6):1647-54.
16. Andrade AR, Cotrim HP, Alves E, Soares D, Rocha R, Almeida A, et al. Nonalcoholic fatty liver disease in severely obese individuals: the influence of bariatric surgery. Ann Hepatol. 2008;7(4):364-8.
17. Nannipieri M, Gonzales C, Baldi S, Posadas R, Williams K, Haffner SM, et al. Liver enzymes, the metabolic syndrome, and incident diabetes: the Mexico City diabetes study. Diabetes Care. 2005;28(7):1757-62.
18. Clark JM, Brancati FL, Diehl AM. The prevalence and etiology of elevated aminotransferase levels in the United States. Am J Gastroenterol. 2003;98(5):960-7.
19. Perry IJ, Wannamethee SG, Shaper AG. Prospective study of serum gamma-glutamyltransferase and risk of NIDDM. Diabetes Care. 1998;21(5):732-7. 20. Nakanishi N, Nishina K, Li W, Sato M, Suzuki K, Tatara K. Serum
21. Lee DH, Jacobs DR Jr, Gross M, Kiefe CI, Roseman J, Lewis CE, et al. Gamma-glutamyltransferase is a predictor of incident diabetes and hypertension: the Coronary Artery Risk Development in Young Adults (CARDIA) Study. Clin Chem. 2003;49(8):1358-66.
22. Browning JD, Szczepaniak LS, Dobbins R, Nuremberg P, Horton JD, Cohen JC, et al. Prevalence of hepatic steatosis in an urban population in the United States: impact of ethnicity. Hepatology. 2004;40(6):1387-95.
23. Seppälä-Lindroos A, Vehkavaara S, Häkkinen AM, Goto T, Westerbacka J, Sovijärvi A, et al. Fat accumulation in the liver is associated with defects in insulin suppression of glucose production and serum free fatty acids independent of obesity in normal men. J Clin Endocrinol Metab. 2002;87(7):3023-8.
24. Day CP, Saksena S. Non-alcoholic steatohepatitis: definitions and pathogenesis. J Gastroenterol Hepatol. 2002;17(Suppl 3)S377-84.
25. Pradhan AD, Manson JE, Rifai N, Buring JE, Ridker PM. C-reactive protein, interleukin 6, and risk of developing type 2 diabetes mellitus. JAMA. 2001;286(3):327-34.
26. Lee DH, Jacobs DR Jr. Association between serum gamma-glutamyltransferase and C-reactive protein. Atherosclerosis. 2005;178(2):327-30.
27. Lee DH, Ha MH, Kim JH, Christiani DC, Gross MD, Steffes M, et al. Gamma-glutamyltransferase and diabetes--a 4 year follow-up study. Diabetologia. 2003;46(3):359-64.