www.nat-hazards-earth-syst-sci.net/14/53/2014/ doi:10.5194/nhess-14-53-2014
© Author(s) 2014. CC Attribution 3.0 License.
Natural Hazards
and Earth System
Sciences
Assessing the predictability of fire occurrence and area burned
across phytoclimatic regions in Spain
J. Bedia1, S. Herrera1, and J. M. Gutiérrez2
1Grupo de Meteorología, Dpto. Matemática Aplicada y Ciencias de la Computación, Universidad de Cantabria, Avda. Los
Castros s/n, 39005 Santander, Spain
2Grupo de Meteorología, Instituto de Física de Cantabria, CSIC-Universidad de Cantabria, 39005 Santander, Spain
Correspondence to:J. Bedia ([email protected])
Received: 9 July 2013 – Published in Nat. Hazards Earth Syst. Sci. Discuss.: 9 July 2013 Revised: – – Accepted: 21 November 2013 – Published: 7 January 2014
Abstract.Most fire protection agencies throughout the world have developed forest fire risk forecast systems, usually building upon existing fire danger indices and meteorolog-ical forecast data. In this context, the daily predictability of wildfires is of utmost importance in order to allow the fire protection agencies to issue timely fire hazard alerts. In this study, we address the predictability of daily fire occur-rence using the components of the Canadian Fire Weather Index (FWI) System and related variables calculated from the latest ECMWF (European Centre for Medium Range Weather Forecasts) reanalysis, ERA-Interim. We develop daily fire occurrence models in peninsular Spain for the pe-riod 1990–2008 and, considering different minimum burned area thresholds for fire definition, assess their ability to repro-duce the inter-annual fire frequency variability. We based the analysis on a phytoclimatic classification aiming the strati-fication of the territory into homogeneous units in terms of climatic and fuel type characteristics, allowing to test model performance under different climate/fuel conditions. We then extend the analysis in order to assess the predictability of monthly burned areas. The sensitivity of the models to the level of spatial aggregation of the data is also evaluated. Additionally, we investigate the gain in model performance with the inclusion of socioeconomic and land use/land cover (LULC) covariates in model formulation.
Fire occurrence models have attained good performance in most of the phytoclimatic zones considered, being able to faithfully reproduce the inter-annual variability of fire fre-quency. Total area burned has exhibited some dependence on the meteorological drivers, although model performance was poor in most cases. We identified temperature and some FWI
system components as the most important explanatory vari-ables, highlighting the adequacy of the FWI system for fire occurrence prediction in the study area. The results were im-proved when using aggregated data across regions compared to when data were sampled at the grid-box level. The in-clusion of socioeconomic and LULC covariates contributed marginally to the improvement of the models, and in most cases attained no relevant contribution to total explained vari-ance – excepting northern Spain, where anthropogenic fac-tors are known to be the major driver of fires. Models of monthly fire counts performed better in the case of fires larger than 0.1 ha, and for the rest of the thresholds (1, 10 and 100 ha) the daily occurrence models improved the pre-dicted inter-annual variability, indicating the added value of daily models.
Fire frequency predictions may provide a preferable ba-sis for past fire history reconstruction, long-term monitoring and the assessment of future climate impacts on fire regimes across regions, posing several advantages over burned area as a response variable. Our results leave the door open to the development a more complex modelling framework based on daily data from numerical climate model outputs based on the FWI system.
1 Introduction
the same time, wildfires are also the cause of important dam-ages and economic losses in many fire-prone regions of the world, arising public concerns and requiring important eco-nomic efforts towards fire prevention, protection, suppres-sion and restoration (Hardy, 2005; Barbati et al., 2010).
It is widely accepted that fire activity is strongly influ-enced by climate, although human activities and land uses are also important factors in determining fire regimes (Mar-lon et al., 2008; de Torres Curth et al., 2012), particu-larly in the Mediterranean areas (Catry et al., 2010). More-over, this relationship is not constant across landscapes, and tends to weaken in resource-limited ecosystems, in which fuel availability becomes the major constraint to fire activ-ity (Krawchuk and Moritz, 2010; Pausas and Paula, 2012).
Even though predicting daily fire occurrence is more challenging than considering other time aggregations (e.g. weekly, monthly) that tend to reduce data variability improv-ing model fits, from an operational point of view the daily predictability of wildfires is crucial in order to issue timely forecasts to the fire protection agencies. For instance, the European Forest Fire Information System (EFFIS) produces and publishes on the web daily maps of fire danger in Eu-rope based on the FWI system (Camia et al., 2006; Camia and Amatulli, 2009) as the method to assess the fire dan-ger level in a harmonized way throughout Europe. These fire danger forecasts are fed with meteorological forecasted data of similar characteristics to reanalysis outputs, although the evaluation of the FWI system for the prediction of actual fire occurrence using numerical model outputs at an operational timescale remains unexplored in many fire-prone regions of the Mediterranean (see, e.g. Viegas et al., 1999, based on me-teorological records).
On the other hand, model validation is sensitive to the spa-tial extent on which the modelling is undertaken. The possi-bilities range from different levels of administrative bound-aries like countries (e.g. Amatulli et al., 2013) and the EU-ROSTAT Nomenclature of Territorial Units for Statistics (NUTS3) (e.g. Carvalho et al., 2010) to other features such as ecozones (e.g. Littell et al., 2009), potential vegetation ar-eas (Vázquez et al., 2002), hydrological basins (Pausas and Paula, 2012), etc., and largely depend on the aims and scope of each particular study. In this context, phytoclimatology is a scientific discipline focused on the establishment of links between natural vegetation and climatic types. As a result, the phytoclimatic classification provides a potentially use-ful spatial framework for the characterization and analysis of wildfires, identifying regions with homogeneous charac-teristics in terms of fuel types and climatic conditions.
In this study, we investigate the adequacy of the FWI sys-tem for the prediction of fire occurrence at a daily timescale and monthly burned area, as well as the practical applica-bility of numerical model output – ERA Interim (European reanalysis) – to this aim, following a previous study show-ing that this reanalysis product is adequate for the charac-terization of fire danger conditions in Iberia as compared to
weather observations (Bedia et al., 2012). We also analyse the contribution of socioeconomic and land use / land cover variables in order to assess model performance and assist in the interpretation of model results.
In addition, we also analyse the suitability of monthly burned area models, potentially useful for the reconstruction of past fire history from climate records and often used for the assessment of future fire danger impacts (e.g. Amatulli et al., 2013; Balshi et al., 2009; Flannigan et al., 2005; Car-valho et al., 2010).
Furthermore, we analyse whether the phytoclimatic re-gions can be used as convenient generalization units for the development of accurate models of fire occurrence and burned area, by means of a spatial aggregation experiment. We determine the predictive ability of the models by apply-ing cross-validation procedures, and calculate the contribu-tion of the different explanatory variables to the total ex-plained variance in order to ascertain which are the most important climatic controls of fires across phytoclimatic re-gions.
2 Data and methods
2.1 Fire data
We extracted fire data from the National Wildfire Database of the Spanish Environmental Agency (Mérida et al., 2007), stored at a 10 km resolution grid-cell size. We selected all fires since 1990, the year when a rigorous fire reporting pro-tocol with a normalized form started to be applied at a na-tional level, thus ensuring the maximum homogeneity of the fire database across Spain.
2.2 Phytoclimatic regions
2-3 4 5 6 7-8 9 10-11-12 13-14-15
20°W 0° 20°E 40°E 60°E
30
°
N
40
°
N
50
°
N
6
0
°
N
Grid-box size (25km)
Phytoclimatic zones
36 38 40 42
-5 0
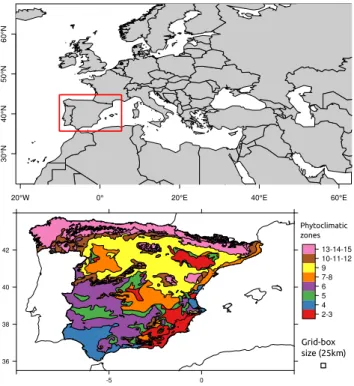
Fig. 1.Location of the study area. Colour divisions correspond to the different phytoclimatic areas used for the analysis after aggre-gation (see details in Sect. 2.2 and Table 1). The grid of analysis is also indicated.
a result, phytoclimatic types 2–3, 7–8 and 10–11–12 were merged together for the analyses. In addition, due to the very low fire numbers in the oro-boreal phytoclimatic region, the corresponding types were merged together with class 13– 14–15 (Fig. 1). Similarly, type 1 was restricted to a very small coastal Mediterranean area, falling out from the 25 km-resolution land mask applied, and therefore it was discarded from the analysis.
2.3 Climate data
We obtained climate data from the ERA-Interim reanaly-sis, produced by the European Centre for Medium-Range Weather Forecasts in collaboration with many institu-tions (Dee et al., 2011).
Reanalysis products are generated from the assimilation of observational data from various sources (satellite, ships, buoys, radiosonde, surface meteorological records) through numerical simulation models in order to reproduce the state of the atmosphere with variable vertical and horizontal spa-tial resolution and spanning an extended historical period that covers several decades or more. The performance of differ-ent reanalysis products for FWI represdiffer-entation in the Iberian Peninsula and further details on their use for fire danger esti-mation are described in Bedia et al. (2012). The main advan-tages of reanalysis data are the wide geographical coverage and the homogeneity of the time series provided. In the
con-text of this study, reanalysis data are an adequate surrogate for weather forecast models as they yield similar variables at a sub-daily time resolution, with the additional advantage of providing homogeneous long time series for the develop-ment and validation of daily models for an extended period for which fire records are available (1990–2008).
2.4 Socioeconomic and LULC data
Socioeconomic and LULC data were retrieved from the “EUMED FireDrivers” database (Vilar et al., 2014), devel-oped within the EU-funded FP7 Project FUME (Forest fire under climate, social and economic changes). It contains socioeconomic data from EUROSTAT (http://epp.eurostat. ec.europa.eu/portal/page/portal/eurostat/home/) and LULC drivers from the CORINE (coordination of information on the environment) Land Cover programme (http://www.eea. europa.eu/publications/COR0-landcover), as well as fire oc-currence derived products and LULC changes data, all re-ferred to a 10 km grid layer. The database covers the fol-lowing countries of the EU-Mediterranean region: Portugal, Spain, (southern) France, Italy and Greece. The selection of the variables has been performed on the basis of their rele-vance for forest fire risk. An analysis of fire occurrence in 6066 municipalities in Spain of the Spanish peninsular ter-ritory and Balearic Islands revealed the strong links of agri-cultural landscape fragmentation, agriagri-cultural abandonment and development processes as the main anthropogenic fac-tors (Martínez et al., 2009). Details on the variables consid-ered in this study are provided in Table 2.
2.5 The Canadian Forest Fire Weather Index System
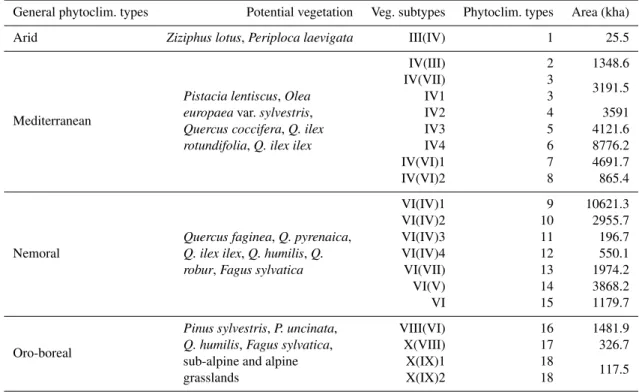
Table 1.Summary of the phytoclimatic regions considered for spatial aggregation in this study. The spatial distribution of the phytoclimatic types is displayed in Fig. 1. The area occupied by each phytoclimatic type is also indicated.
General phytoclim. types Potential vegetation Veg. subtypes Phytoclim. types Area (kha)
Arid Ziziphus lotus,Periploca laevigata III(IV) 1 25.5
Mediterranean
Pistacia lentiscus,Olea europaeavar.sylvestris, Quercus coccifera,Q. ilex rotundifolia,Q. ilex ilex
IV(III) 2 1348.6
IV(VII) 3
3191.5
IV1 3
IV2 4 3591
IV3 5 4121.6
IV4 6 8776.2
IV(VI)1 7 4691.7
IV(VI)2 8 865.4
Nemoral
Quercus faginea,Q. pyrenaica, Q. ilex ilex,Q. humilis,Q. robur,Fagus sylvatica
VI(IV)1 9 10621.3
VI(IV)2 10 2955.7
VI(IV)3 11 196.7
VI(IV)4 12 550.1
VI(VII) 13 1974.2
VI(V) 14 3868.2
VI 15 1179.7
Oro-boreal
Pinus sylvestris,P. uncinata, Q. humilis,Fagus sylvatica, sub-alpine and alpine grasslands
VIII(VI) 16 1481.9
X(VIII) 17 326.7
X(IX)1 18
117.5
X(IX)2 18
outputs are described in Bedia et al. (2012). A schematic di-agram is also presented in the Supplement.
2.6 Drought indices
Drought is an important factor related to wildfire occurrence and magnitude (see, e.g. Pereira et al., 2005; Littell et al., 2009; Meyn et al., 2010). Unlike the previous daily fire dan-ger indices, droughts are climatic phenomena difficult to quantify in terms of intensity, magnitude, duration and spatial extent, partly because there is no a straightforward manner to identify their onset, duration and end (Vicente-Serrano et al., 2010). A number of specific indices have been developed in order to quantify and properly describe drought episodes, and in this study we have included two of them: The standard-ized precipitation index (SPI) and the standardstandard-ized precipi-tation evapotranspiration index (SPEI). Unlike other popular drought indices, both SPI and SPEI account for the widely accepted multi-scalar nature of droughts (see, e.g. McKee et al., 1993). Both indices are calculated on a monthly ba-sis, and therefore they have been only tested as predictors in the burned area models.
SPI is an index based on the probability of recording a given amount of precipitation at a specific point and can represent precipitation dynamics over user-selected time frames (McKee et al., 1993). However, SPI does not take into account temperature, and thus may present important
devi-ations from the true water deficits derived from evapotran-spiration. As a result, the recently developed SPEI (Vicente-Serrano et al., 2010) was also introduced. In practice, both indices were highly correlated and therefore only SPEI was used for burned area model building (Table 2).
2.7 Data analysis
Climate and fire data were interpolated to a regular grid of 25 km resolution, representing a compromise between the 10 km resolution of the fire and socioeconomic/LULC in-formation and the ≃ 70 km horizontal resolution of ERA-Interim data. For each pixel, we computed daily time se-ries of climate predictors (except SPEI and SPI, which are monthly, Table 2), fire occurrence and burned area. For the burned area models, the total monthly burned areas were calculated for each pixel and the climatic predictors were monthly averaged.
month
Area
Burned
(ha
)
2000 4000 6000 8000 10000 12000
2-3
Jan Feb Mar Apr May Jun Jul Aug Sep Oct Nov Dec
4 5
Jan Feb Mar Apr May Jun Jul Aug Sep Oct Nov Dec
6
Jan Feb Mar Apr May Jun Jul Aug Sep Oct Nov Dec
7-8 9
Jan Feb Mar Apr May Jun Jul Aug Sep Oct Nov Dec
10-11-12
500 1000 1500 13-14-15
N
r
fires
Area burned
Nr Þres
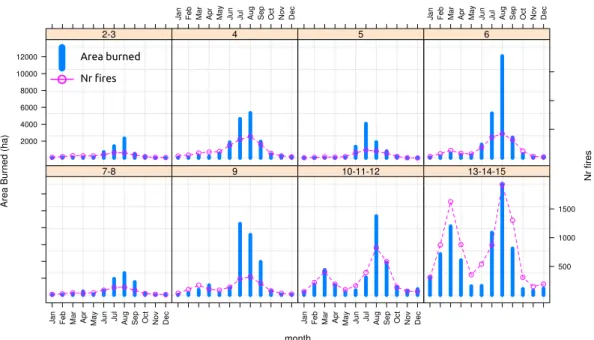
Fig. 2.Mean monthly area burned (vertical bars, mainyaxis) and mean number of fires (lines and dots, secondaryyaxis) recorded for the period 1990–2008 in Spain, at the different phytoclimatic regions.
Table 2.Summary of predictors tested in this study for fire model building. After checking for redundancy, a final subset of weakly-correlated variables was used for model building, marked with an asterisk (Note that SPEI is a monthly indicator, and therefore it was only used as a predictor for the burned area models). In the case of the socioeconomic and LULC variables, data correspond to three periods: 1990–1999, 2000–2005 and 2006–2012. Note that the relative areas occupied by communication networks have been rejected because of the coarse spatial resolution of the original data (NUTS2 level). ET0 = potential evapotranspiration.
Variable Code Input vars. T. aggreg Reference
*Temperature (12UTC) T12 – instantaneous
Dee et al. (2011)
Climatic Rel. humidity (12UTC) H12 Specific H12,T12 instantaneous
variables *Precipitation P – 24 h accum.
*Wind velocity (12UTC) W12 – instantaneous
*Fine fuel moisture code FFMC T12,H12,P,W12
daily van Wagner (1987)
Duff moisture code DMC T12,H12,P
FWI system *Drought code DC T12,P
components Initial spread index ISI FFMC,W12
Buildup index BUI DMC,DC
*Fire weather index FWI ISI,BUI
Daily severity rating DSR FWI
Drought Std. precip. index SPI P
monthly McKee et al. (1993)
indices *Std. precip. evap. index SPEI P, ET0 Vicente-Serrano et al. (2010)
*Population density POP –
1990–2000–2006 Vilar et al. (2014)
*Relative area of cultivated/forest interface FAI –
Socioeconomic *Relative area of forest/urban interface FUI –
and LULC *Relative area of pasture/forest interface FGI –
variables Relative area occupied by railway network RAIL –
Relative area occupied by road network ROAD –
Relative area occupied by forest ways network WAYS –
linear regressions known as basis functions of the form:
y=αo+ K X
k=1
αkbk(x), (1)
where the slope of each piecewise can change in a set of points called knots. The popularity of this technique is due to the efficient optimization procedure used for the iterative search for basis functions and knots.
A comparative study of both MARS and GLM in the con-text of binary response predictions is done in Bedia et al. (2011, 2013). In both types of models, the presence of re-dundant (highly correlated) predictors may introduce incon-sistencies in variable importance estimates (see Sects. 2.7.1 and 2.7.2). Thus, we first computed the pairwise-correlation matrix with all candidate explanatory variables averaged at the country level, and eliminated one of each pair attaining correlation coefficients (Spearman’sρ) greater than 0.7. We decided to preserve variable pairs below this threshold in or-der to avoid the loss of useful information. The resulting sub-set of explanatory variables is indicated by the asterisks in Table 2.
2.7.1 Fire occurrence models
We used generalized linear models (GLM) for fire occur-rence model development, considering the logit link func-tion for the binary response variable (fire/no fire), at a daily resolution. We selected GLMs after finding that model per-formance was similar than with the use of the more sophisti-cated MARS approach.
In order to analyse the effect of spatial aggregation of data in the models, we tested two different approaches:
– Grid-box models: a full matrix of occurrence/absence of fires was constructed for each phytoclimatic zone, considering all the grid-boxes encompassed within the zone and the full daily time series. This will be referred to as the grid-box approach hereafter.
– Areal models: occurrence/absence data were aggre-gated at the phytoclimatic zone level, considering as occurrences all days in which at least one fire at one grid box took place, and absences those days in which no fire took place at any of the grid boxes. This will be referred to as the areal approach hereafter.
In order to test the sensitivity of the models to fire size, we set different burned area thresholds for occurrence definition: 0.1, 1, 10 and 100 ha. As a result, only fires above the corre-sponding area thresholds were computed as occurrences.
Fire occurrence models were trained using all occurrence samples and fire absences randomly chosen in an equal number to the fire occurrences, thus using balanced data sets for model training to avoid an artificial inflation of model skill (see, e.g.: Manel et al., 2001; McPherson et al.,
2004). For the grid-box model training, fire absences were sampled only from those days in which no fires occurred in any of the grid-boxes of the phytoclimatic zone and this process was repeated 100 times in order to get a confidence interval of the sampling error. We then tested the resulting models using a random sample containing all possible cases. We undertook a one-year out cross-validation procedure, using 18 yr for training and the remaining one for testing, repeating this process 19 times, exactly one per year. In the case of socioeconomic/LULC variables, we performed a 3-fold cross-validation, each fold corresponding to the periods at which these statistics are given (Table 2), in order to avoid model overfits due to the repeated values.
From the resulting probabilistic predictions we computed the area under the receiver-operating characteristic curve (ROC score area, RSA hereafter), which provides a quan-titative measure of model performance (Swets, 1988). The possible range of RSA is (0,1). A null performance is indi-cated by RSA = 0.5, when the ROC lies along the positive diagonal, whereas RSA = 1.0 corresponds to a perfect per-formance. A RSA value below 0.5 corresponds to a ROC curve below the diagonal, indicating the same level of dis-crimination capacity as if it were reflected about the diago-nal, but wrongly calibrated (Jolliffe and Stephenson, 2003). In order to compute the predicted fire frequencies, the prob-abilistic model predictions were converted into a binary pre-diction using two different approaches for decision threshold determination. Further details on the modelling approach are provided in the Supplement.
– A global fixed probability threshold was determined by calculating the likelihood ratio of fire occurrence as given by the observations, and then applied to the full vector of predictions. This approach will be termed as global threshold hereafter.
– A monthly-varying threshold, corresponding to the likelihood ratio of fire occurrence as given by the ob-servation, conditioned to the month. As a result, 12 different decision thresholds were obtained for each month of the year, which were applied to the predic-tions of the corresponding months to obtain the binary prediction. This threshold is referred to as monthly threshold in the following.
variable (Chevan and Sutherland, 1991). For instance, for variableX1, its importanceIwould be calculated as follows:
Ix1=
k−1
X
i=0
P (ry,X2
1Xh−r 2
y,Xh)/
k
−1
i
k (2)
whereXh is any subset of i predictors from whichX1 is
excluded. As a result, the variance shared by two or more correlated predictors can be partitioned into the variance at-tributable to each predictor. This method provides a robust assessment of variable importance and has been shown to outperform other methods used for variable importance es-timation in the context of regression analysis (Murray and Conner, 2009).
Finally, we also fitted multiple linear regression models to the monthly fire counts in order to test whether the daily oc-currence models do provide or not an added value to the pre-dictability of the inter-annual fire frequency variability with respect to the monthly ones.
2.7.2 Burned area models
For the burned area models, we aggregated both fire and cli-mate data in a monthly basis (1990–2008,N= 228 months). We used MARS as the modelling algorithm because it per-forms well in the presence of outlying observations, as is the case with large, infrequent fires. For this reason, it has been used in previous studies for modelling burned area (see, e.g. Balshi et al., 2009; Amatulli et al., 2013).
In order to obtain robust estimates of model performance, we carried out a leave-one-out cross-validation procedure (LOOCV) to compute the error (Michaelsen, 1987). LOOCV is a resampling technique in which n−1 instances out of the total ofn are used as the training data set and the re-maining one is used for testing. The procedure is repeated
ntimes, one per observed instance, producing a more pre-cise estimation of the classification accuracy. The method assumes that each sample is independent, so prior to its ap-plication we constructed autocorrelation plots of the monthly burned areas. We found a slight autocorrelation (maximum of 0.26) at some phytoclimatic types that were significant at the
α=0.05 level. However, time series with autocorrelation of 0.25 or less will have an effective sample size at least of 90 % of the original sample size (Michaelsen, 1987), and thus it can be considered that this does not produce any measurable effect on the LOOCV estimates.
For variable importance estimation in the context of MARS, we looked at the reductions in the generalized cross-validation estimate of error (GCV) in the selection routine performed by the MARS algorithm (Milborrow, 2013b). The GCV is reduced each time a new variable is entered into the model. The accumulated reductions in GCV can be used as an estimate of variable importance, a value that is scaled to have a maximum of 100 and a minimum of zero (this
mini-mum is reached when the variable is not used at all, or pro-duces positive changes in GCV).
All the analyses were conducted in the R language and environment for statistical computing (R Core Team, 2013). The hierarchical partitioning was undertaken using the R package hier.part (Walsh and Mac Nally, 2013). For the MARS models, we used the implementation of the algorithm included in the R earth package (Milborrow, 2013a). The drought indices SPI and SPEI were computed using the SPEI R package (Beguería and Vicente-Serrano, 2013).
3 Results and discussion
3.1 Fire regimes of the different phytoclimatic regions
We found two contrasting fire regimes in terms of area burned and number of fires across phytoclimatic zones: one characterized by a bimodal annual pattern, and another one exhibiting an unimodal annual cycle, with the fire season concentrated in the summer months (Fig. 3). The first case corresponds to the phytoclimatic types under the Atlantic in-fluence (10–11–12 and 13–14–15), with two marked peaks of fire activity in March and August. These regions are char-acterized by temperate and wet conditions during most of the year, and also by relatively low fire danger conditions. In spite of the less suitable conditions for fire activity of these regions, there is a high number of fire records and also large burned areas. In this regard, previous studies have highlighted the strong influence that humans exert on fire regimes, and how fire incidence can be greatly enhanced for this reason even when climate conditions are not the most favourable (Vázquez et al., 2002). On the other hand, in the remaining phytoclimatic zones, which belong to the Mediter-ranean climate, fire activity is concentrated in the summer months and exhibits a marked unimodal annual cycle, coin-cident with the most favourable climatological conditions for fire.
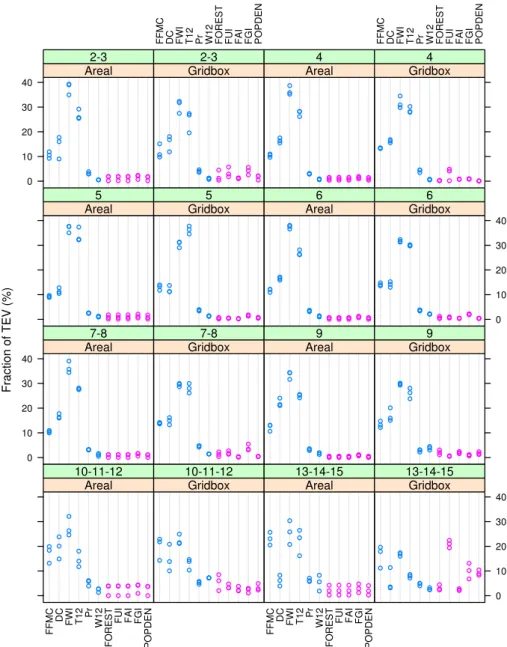
components of the FWI system (DC, FFMC). For the sake of conciseness, the results for the occurrence models are illus-trated for the 10 ha burned area threshold models, although very similar results were obtained for the remaining burned area thresholds. Due to the marginal contribution of socioe-conomic/LULC variables to model performance, in the fol-lowing the results presented correspond to the climate-only models.
3.2 Fire occurrence models
Most phytoclimatic zones attained moderate to good model performance, and only zones 2–3, 10–11–12 and 13–14–15 yielded RSA values below 0.70 in the case of the grid-box models, whereas the areal models yielded higher RSA val-ues in most cases for the larger area thresholds (Table 3). The inclusion of socioeconomic/LULC variables in the mod-els did not contribute at all to model performance in the case of areal models, and only marginally in the case of the grid-box models, even in the case of phytoclimatic zone 13– 14–15, in which these variables attained higher importance than the climatic ones. In consequence, for brevity the corre-sponding RSA values using socioeconomic/LULC variables are not shown. In general, all models attained higher skills with increasing burned area thresholds, showing that the fire weather predictors used are more sensitive to the detection of larger fires than to smaller ones, being the latter not so closely dependent on favourable climate conditions for their occur-rence. For the climate-only models, the RSA scores attained were similar when considering the 3-fold and the leave-one-year-out procedures.
The sampling error related to the random selection of days without fires was very low, and increased slightly for higher area thresholds, although they were always in the range of hundredths of RSA (not shown).
In order to obtain the deterministic binary predictions of occurrence/absence of fires from the probabilistic output of the models, we applied both the global and monthly probabil-ity thresholds as cutoff value. We did not find a clear advan-tage of using the monthly probability threshold as compared to the global one in terms of correlations between observed and predicted series, and therefore in the following the results from the global threshold are presented (see the Supplement for extended information).
We found that the good model skills are not directly linked to a good reproducibility of observed inter-annual fire fre-quencies when working at the grid-box scale. In this regard, all models tended to a large overestimation of fire occurrence at this spatial scale because all events of high danger poten-tial are given a high probability of occurrence, in close rela-tionship with the annual cycle of fire weather danger. How-ever, this effect is overridden when considering a larger spa-tial aggregation unit because the probability of having at least one fire in a larger region when the conditions are favourable is much higher (this is illustrated in more detail in the
Sup-plement). Thus, the use of the grid-box approach provides an adequate basis for model assessment, as the good perfor-mance of the models at the grid-box scale translates into a good reproducibility inter-annual of fire frequencies across most phytoclimatic zones within the areal context (Table 4). The results of the areal models will be presented in the fol-lowing (Fig. 4).
In spite of the higher RSA attained by the models for the 100 ha area threshold, their ability to reproduce the inter-annual fire frequencies was poor, contrasting with the good reproducibility of fire frequencies for lower area thresholds. In this sense, there are two different issues jointly affecting the reproducibility of inter-annual fire frequencies: on the one hand, this is affected by model performance (RSA). Ob-viously, those models with low RSA have less ability to ade-quately reproduce the inter-annual fire frequencies. This can be seen in the examples of zones attaining low RSA values (e.g. 13–14–15), especially with the area threshold of 0.1 ha (Table 3). However, it is also important to take into account the inter-annual variability of fire occurrence, which in turn is related with the prevalence of the phenomenon. For instance, most models attain relatively high RSA values for the 100 ha area threshold, but the inter-annual variability of these large fires is lower because there are few fires larger than 100 ha every year (even zero some years at some regions; see Fig. 4 and also the Supplement for fire count data). As a result, the estimated inter-annual frequencies are more drastically af-fected by false negatives/positives in the case of large fires than in the case of small ones, even though in both cases RSA values are good. In Fig. 4 it can be seen how the best inter-annual correlations correspond to those zones where the inter-annual variability is higher. This variability tends to re-duce as the fire area threshold increases, leading to worse results.
Besides, in general the monthly fire count models captured better the inter-annual variability of fire frequency when con-sidering the 0.1 ha burned area threshold (with the notable exception of the phytoclimatic zone 13–14–15, Table 4), al-though daily models improved this correlation for higher area thresholds, suggesting that the loss of information when con-sidering monthly aggregated statistics may be harmful for an optimal reproducibility of this events due to their dependence on very particular weather conditions that require a finer tem-poral scale to be represented.
3.2.1 Burned area models
F
raction of T
EV (%) 0 10 20 30 40 Areal 2-3 F F M C D C F W I T 12
Pr W12 FO
R E ST F U I F AI F GI PO PD EN Gridbox 2-3 Areal 4 F F M C D C F W I T 12
Pr W12 FO
R E ST F U I F AI F GI PO PD EN Gridbox 4 Areal 5 Gridbox 5 Areal 6 0 10 20 30 40 Gridbox 6 0 10 20 30 40 Areal 7-8 Gridbox 7-8 Areal 9 Gridbox 9 F F M C D C F W I T 12 Pr W 12 F O R E
ST FU
I F AI F GI PO PD EN Areal 10-11-12 Gridbox 10-11-12 F F M C D C F W I T 12 Pr W 12 F O R E
ST FU
I F AI F GI PO PD EN Areal 13-14-15 0 10 20 30 40 Gridbox 13-14-15
Fig. 3.Variable importance (% of total explained variance) in the fire occurrence models (10 ha area threshold) for each phytoclimatic zone and considering both the grid-box and areal models and the inclusion of socioeconomic/LULC as co-variables (pink colour). The results presented correspond to the 3-fold-cross validation, each fold corresponding to a different period of the socioeconomic LULC statistics (Table 2, Sect. 2.7.1).
cycle of the fire danger predictors. Nevertheless, the inclu-sion of the socioeconomic/LULC variables provided none or little improvement to model performance (Fig. 5), and there-fore model performance, when any, can be attributed solely to the climate variables.
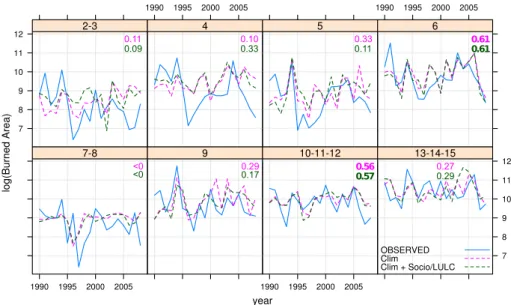
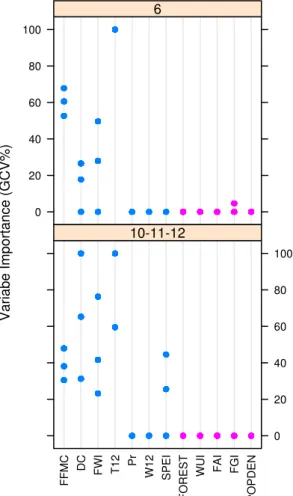
Only in phytoclimatic zones 6 and 10–11–12 a fair repro-ducibility of inter-annual burned area series was attained. In both cases, temperature, FWI, DC and FFMC were impor-tant explanatory variables (Fig. 6). In addition, the drought indicator SPEI was also a relevant predictor in the case of phytoclimatic zone 10–11–12. Several studies in the Mediter-ranean have highlighted the link of burned area with
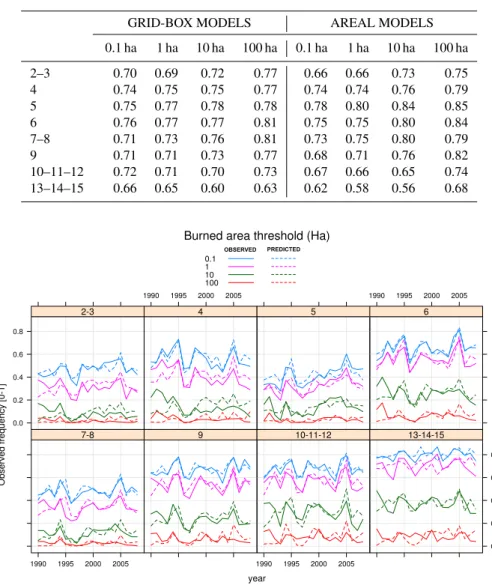
Table 3. ROC skill area (RSA) attained by the fire occurrence models for each phytoclimatic zone. Results are presented for the different burned area thresholds used for fire occurrence definition, and considering the leave-one-out cross-validation approach (see Sect. 2.7.1 for details).
GRID-BOX MODELS AREAL MODELS
0.1 ha 1 ha 10 ha 100 ha 0.1 ha 1 ha 10 ha 100 ha
2–3 0.70 0.69 0.72 0.77 0.66 0.66 0.73 0.75
4 0.74 0.75 0.75 0.77 0.74 0.74 0.76 0.79
5 0.75 0.77 0.78 0.78 0.78 0.80 0.84 0.85
6 0.76 0.77 0.77 0.81 0.75 0.75 0.80 0.84
7–8 0.71 0.73 0.76 0.81 0.73 0.75 0.80 0.79
9 0.71 0.71 0.73 0.77 0.68 0.71 0.76 0.82
10–11–12 0.72 0.71 0.70 0.73 0.67 0.66 0.65 0.74
13–14–15 0.66 0.65 0.60 0.63 0.62 0.58 0.56 0.68
year
Observed
frequ
ency
[0-1]
0.0 0.2 0.4 0.6 0.8
2-3
1990 1995 2000 2005
4 5
1990 1995 2000 2005
6
1990 1995 2000 2005
7-8 9
1990 1995 2000 2005
10-11-12
0.0 0.2 0.4 0.6 0.8
13-14-15 Burned area threshold (Ha)
0.1 1 10 100
OBSERVED PREDICTED
Fig. 4.Observed and 1 yr-out cross-validated predicted annual fire frequencies at each phytoclimatic zone, considering the climatic predictor data set and the four different burned area thresholds tested according to the areal models. Cross-correlation values between observed and predicted series are presented in Table 4.
moisture of deep organic soil layers. Other studies conducted in Portugal show that the DC gives a good indication of wild-fire behaviour and propagation and also of the relative haz-ardousness of a fire season due to its long-term response to daily weather variations (Viegas et al., 2004).
Inter-annual correlations between observed and modelled fire frequencies (Fig. 4, Table 4) are much higher than those obtained with burned area (Fig. 5), showing that fire occur-rence is better modelled from climate data alone than burned area. Within the framework of future climate impact assess-ment, the projections of future fire danger scenarios are most often based on the simulation output of GCMs (either down-scaled or not) run in transient mode (e.g. Bedia et al., 2013).
year
log(Burned
Are
a)
7 8 9 10 11
12 2-3
1990 1995 2000 2005
4 5
1990 1995 2000 2005
6
1990 1995 2000 2005
7-8 9
1990 1995 2000 2005
10-11-12
7 8 9 10 11 12
13-14-15
OBSERVED Clim
Clim + Socio/LULC
0.11
0.09 0.100.33 0.330.11 0.610.61
<0
<0 0.290.17 0.560.57 0.270.29
Fig. 5.Observed and cross-validated predicted annual burned areas at each phytoclimatic zone, considering the climatic predictor data set. Cross-correlation values (Spearman’s rho) between observed and predicted series are indicated by the figures within each panel.
Table 4.Spearman’s rho cross-correlation coefficients between the observed and predicted annual fire frequencies determined by the daily (D) and monthly (M) occurrence models, determined using the global probability threshold for the areal models. The number of grid boxes comprising each phytoclimatic zone are indicated by the N grid-boxes column. The results are presented for the different burned area thresholds used to define fire occurrence/absence.
Phytoclim. N grid boxes 0.1 ha 1 ha 10 ha 100 ha
D M D M D M D M
2–3 77 0.17 0.49 0.18 0.23 0.18 0.00 0.05 > 0
4 57 0.26 0.76 0.17 0.42 0.08 0.03 0.25 0.09
5 70 0.59 0.51 0.63 0.49 0.61 0.16 0.57 0.17
6 158 0.72 0.86 0.54 0.81 0.41 0.23 0.56 0.10
7–8 91 0.33 0.59 0.35 0.38 0.32 0.21 0.38 0.03
9 194 0.56 0.71 0.56 0.57 0.59 0.50 0.46 0.24
10–11–12 81 0.65 0.79 0.37 0.54 0.25 0.30 0.34 0.04
13–14–15 158 0.75 0.31 0.39 0.03 0.23 0.12 0.33 > 0
4 Conclusions
Our results support the use of ERA-Interim reanalysis and the FWI system for fire modelling applications in Spain, pro-vided an adequate temporal and spatial scale of data analysis. The added value of using daily occurrence data vs. monthly fire counts for modelling inter-annual fire frequency variabil-ity was demonstrated for fires of medium to large sizes, and even for all fire area thresholds in some particular zones.
Grid-box models of fire occurrence yielded in general good model skill in terms of RSA, although this fact does not translate directly into a good reproducibility of fire fre-quencies due to the inherent tendency of the method to over-estimate fire occurrence. Nonetheless, the annual cycle was adequately modelled regardless of the distributional charac-teristics of the different annual fire regimes of each phytocli-matic zone. Temperature and some components of the FWI
system (FWI itself and DC and FFMC in particular) were the most important predictors of fire occurrence.
The inclusion of socioeconomic/LULC covariates did not significantly contribute to the improvement of model perfor-mance, neither for the fire occurrence models nor for the burned area ones.
Variabe Im
portance (GC
V%)
0 20 40 60 80 100
6
F
F
M
C
D
C
F
W
I
T
12 Pr
W
12
SP
EI
F
O
R
E
ST
W
U
I
F
AI
F
GI
PO
PD
EN
0 20 40 60 80 100 10-11-12
Fig. 6.Variable importance of climatic and socioeconomic/LULC variables of the burned area models for phytoclimatic zones 6 and 10–11–12 (the only ones attaining significant inter-annual correla-tions of observed and modelled fire frequencies). Values for each variable correspond to the scores obtained by each of the 3-fold cross-validated models according to the three periods of socioeco-nomic/LULC data (see Sect. 2.7.1 for details).
to obtain long fire frequency annual series extending before satellite data – often used to this aim.
Most of burned area models failed to adequately repro-duce the inter-annual burned area series, with some excep-tions. In these cases, burned areas were mostly explained by temperature and drought-related indices bearing some sort of “memory” on the antecedent conditions, such as the FWI system component DC or the recently developed drought in-dex SPEI. As a result, the practical application of burned area models, building solely on the FWI system for the prediction of future burned area scenarios, poses important limitations, being the fire frequency models are more robust for this aim.
Supplementary material related to this article is available online at
http://www.nat-hazards-earth-syst-sci.net/14/53/2014/ nhess-14-53-2014-supplement.pdf.
Acknowledgements. We are grateful to P. Martín and I. Gómez (CSIC) for their help with fire data gathering and their useful suggestions regarding socioeconomic and LULC data analysis, and three anonymous referees for their insightful comments on an early version of this manuscript. We also thank A Camia and L. Vilar (Joint Research Centre) for the development of the socioeconomic database used in this study. The research leading to these results has received funding from the European Union’s Seventh Framework Programme (FP7/2007-2013) under grant agreement 243888 (FUME Project).
Edited by: R. Lasaponara
Reviewed by: four anonymous referees
References
Allué, J.: Atlas Fitoclimático de España. Taxonomías, Tech. rep., In-stituto Nacional de Investigaciones Agrarias, Ministerio de Agri-cultura, Pesca y Alimentación, Madrid, Spain, 221 pp., 1990. Amatulli, G., Camia, A., and San-Miguel-Ayanz, J.:
Estimat-ing future burned areas under changEstimat-ing climate in the EU-Mediterranean countries, Sci. Total Environ., 450, 209–222, 2013.
Balshi, M., McGuire, A., Duffy, P., Flannigan, M., Walsh, J., and Melillo, J.: Assessing the response of area burned to changing climate in wester boreal North America using a Multivariate Adaptive Regression Splines (MARS) approach, Glob. Change Biol., 15, 578–600, 2009.
Barbati, A., Arianoutsou, M., Corona, P., De Las Heras, J., Fer-nandes, P., Moreira, F., Papageorgiou, K., Vallejo, R., and Xan-thopoulos, G.: Post-fire forest management in southern Europe: a COST action for gathering and disseminating scientific knowl-edge, IForest-Biogeosciences and Foresty, 3, 5–7, 2010. Bedia, J., Busqué, J., and Gutiérrez, J. M.: Predicting plant species
distribution across an alpine rangeland in northern Spain: a com-parison of probabilistic methods, Appl. Veg. Sci., 14, 415–432, 2011.
Bedia, J., Herrera, S., Gutiérrez, J. M., Zavala, G., Urbieta, I. R., and Moreno, J. M.: Sensitivity of fire weather index to different reanalysis products in the Iberian Peninsula, Nat. Hazards Earth Syst. Sci., 12, 699–708, doi:10.5194/nhess-12-699-2012, 2012. Bedia, J., Herrera, S., and Gutiérrez, J. M.: Dangers of using global
bioclimatic datasets for ecological niche modeling. Limitations for future climate projections, Global Planetary Change, 107, 1– 12, 2013.
Beerling, D. J. and Osborne, C. P.: The origin of the savanna biome, Global Change Biology, 12, 2023–2031, 2006.
Beguería, S. and Vicente-Serrano, S. M.: SPEI: Calculation of the Standardised Precipitation-Evapotranspiration Index, r package version 1.3, 2013.
Bond, W., Woodward, F., and Midgley, G.: The global distribution of ecosystems in a world without fire, New Phythol., 165, 525– 537, 2005.
and Pyne, S. J.: Fire in the Earth System, Science, 324, 481–484, 2009.
Camia, A. and Amatulli, G.: Weather Factors and Fire Danger in the Mediterranean, in: Earth Observation of Wildland Fires in Mediterranean Ecosystems, edited by: Chuvieco, E., 71–82, Springer Berlin Heidelberg, Berlin, Heidelberg, 2009.
Camia, A., Barbosa, P., Amatulli, G., and San-Miguel-Ayanz, J.: Fire danger rating in the European Forest Fire Information Sys-tem (EFFIS): current developments, in: Vth International Con-ference on Forest Fire Research, edited by: Viegas, D., Figueira da Foz, Portugal, 2006.
Carvalho, A., Flannigan, M. D., Logan, K. A., Gowman, L., Mi-randa, A. I., and Borrego, C.: The impact of spatial resolution on area burned and fire occurrence projections in Portugal under climate change, Clim. Change, 98, 177–197, 2010.
Carvalho, A., Carvalho, A., Martins, H., Marques, C., Rocha, A., Borrego, C., Viegas, D., and Miranda, A.: Fire weather risk as-sessment under climate change using a dynamical downscaling approach, Environ. Modell. Software, 26, 1123–1133, 2011. Catry, F. X., Rego, F. C., Silva, J. S., Moreira, F., Camia, A.,
Ri-cotta, C., and Conedera, M.: Fire Starts and Human Activities, in: towards integrated fire management: outcomes of the European project fire paradox, edited by Silva, J. S., Rego, F. C., Fernandes, P., and Rigolot, E., 9–48, 2010.
Chevan, A. and Sutherland, M.: Hierarchical Partitioning, The American Statistician, 45, 90–96, 1991.
de Torres Curth, M., Biscayart, C., Ghermandi, L., and Pfister, G.: Wildland–Urban Interface Fires and Socioeconomic Condi-tions: A Case Study of a Northwestern Patagonia City, Environ. Manag., 49, 876–891, doi:10.1007/s00267-012-9825-6, 2012. Dee, D. P., Uppala, S. M., Simmons, A. J., Berrisford, P., Poli,
P., Kobayashi, S., Andrae, U., Balmaseda, M. A., Balsamo, G., Bauer, P., Bechtold, P., Beljaars, A. C. M., van de Berg, L., Bid-lot, J., Bormann, N., Delsol, C., Dragani, R., Fuentes, M., Geer, A. J., Haimberger, L., Healy, S. B., Hersbach, H., Hólm, E. V., Isaksen, L., Kållberg, P., Köhler, M., Matricardi, M., McNally, A. P., Monge-Sanz, B. M., Morcrette, J., Park, B., Peubey, C., de Rosnay, P., Tavolato, C., Thépaut, J.-N., and Vitart, F.: The ERA-Interim reanalysis: configuration and performance of the data assimilation system, Quart. J. R. Meteorol. Soc., 137, 553– 597, 2011.
Flannigan, M., Logan, K., Amiro, B., Skinner, W., and Stocks, B.: Future area burned in Canada, Clim. Change, 72, 1–16, doi:10.1007/s10584-005-5935-y, 2005.
Friedman, J. H.: Multivariate adaptive regression splines, Ann. Stat., 19, 1–67, 1991.
Hardy, C.: Wildland fire hazard and risk: Problems, definitions, and context, Symposium on Relative Risk Assessments for Decision-Making Related to Uncharacteristic Wildfire, Portland, OR, NOV, 2003, 211, 73–82, Forest Ecol. Manag., 2005. Jolliffe, I. and Stephenson, D., eds.: Forecast Verification. A
Prac-titioner’s guide in Atmospheric Science, Wiley, Chichester, Eng-land, 2003.
Koutsias, N., Xanthopoulos, G., Founda, D., Xystrakis, F., Nioti, F., Pleniou, M., Mallinis, G., and Arianoutsou, M.: On the rela-tionships between forest fires and weather conditions in Greece from long-term national observations (1894–2010), Int. J. Wild-land Fire, 22, 493–507, doi:10.1071/WF12003, 2013.
Krawchuk, M. A. and Moritz, M. A.: Constraints on global fire activity vary across a resource gradient, Ecology, 92, 121–132, doi:10.1890/09-1843.1, 2010.
Littell, J., McKenzie, D., Peterson, D., and Westerling, A.: Climate and wildfire area burned in western U.S. ecoprovinces, 1916– 2003, Ecol. Appl., 19, 1003–1021, 2009.
Manel, S., Williams, H. C., and Ormerod, S. J.: Evaluating presence-absence models in ecology: the need to account for prevalence, J. Appl. Ecol., 38, 921–931, 2001.
Marlon, J. R., Bartlein, P. J., Carcaillet, C., Gavin, D. G., Harrison, S. P., Higuera, P. E., Joos, F., Power, M. J., and Prentice, I. C.: Climate and human influences on global biomass burning over the past two millennia, Nat. Geosci., 1, 697–702, 2008. Martínez, J., Vega-Garcia, C., and Chuvieco, E.: Human-caused
wildfire risk rating for prevention planning in Spain, J. Environ. Manag., 90, 1241–1252, 2009.
McCullagh, P. and Nelder, J.: Generalized linear models, Chapman & Hall, London, 1989.
McKee, T., Doesken, J., and Kleist, J.: The relationship of drought frecuency and duration to time scales, in: Proceedings of the Eight Conf. On Applied Climatology, Anaheim, CA, edited by: Soc., A. M., 179–184, 1993.
McPherson, J., Jetz, W., and Rogers, D.: The effects of species’ range sizes on the accuracy of distribution models: ecological phenomenon or statistical artefact?, J. Appl. Ecol., 41, 811–823, 2004.
Mérida, J., Primo, E., Eleazar, J., and Parra, J.: Las Bases de Datos de Incendios Forestales como herramienta de planifi-cación: utilización en España por el Ministerio de Medio Ambi-ente, in: Proceedings of the 4th International Wildland Fire Con-ference, Sevilla, Spain, 13–18 May 2007, edited by: Organismo Autónomo de Parques Nacionales, M. d. M. A., 2007 (in Span-ish).
Meyn, A., Schmidtlein, S., Taylor, S., Girardin, M., Thonicke, K., and Cramer, W.: Spatial variation of trends in wildfire and sum-mer drought in British Columbia, Canada, 1920–2000, Int. J. Wildland Fire, 19, 272–283, 2010.
Michaelsen, J.: Cross-Validation in Statistical Climate Forecast Models, J. Clim. Appl. Meteorol., 26, 1589–1600, 1987. Milborrow, S.: Earth: Multivariate Adaptive Regression Spline
Models, R package version 3.2-6, 2013a.
Milborrow, S.: Notes on earth package. Vignettes of the R package ‘earth’, http://cran.r-project.org/web/packages/earth/ vignettes/earth-notes.pdf, last access: 23 December 2013b. Murray, K. and Conner, M.: Methods to quantify variable
impor-tance: implications for the analysis of noisy ecological data, Ecology, 90, 348–355, 2009.
Pausas, J.: Changes in fire and climate in the Eastern Iberian Penin-sula (Mediterranean Basin), Clim. Change, 63, 337–350, 2004. Pausas, J. G. and Paula, S.: Fuel shapes the fire-climate
relation-ship: evidence from Mediterranean ecosystems, Global Ecol. Biogeogr., 21, 1074–1082, 2012.
Pereira, M., Trigo, R., da Camara, C., Pereira, J., and Leite, S.: Syn-optic patterns associated with large summer forest fires in Portu-gal, Agr. Forest Meteorol., 129, 11–25, 2005.
Rivas Martínez, S.: Mapa de las Series de Vegetación de la Penín-sula Ibérica, Tech. rep., ICONA. Ministerio de Agricultura, Pesca y Alimentación, 1987.
Stocks, B., Lawson, B., Alexander, M., Van Wagner, C., McAlpine, R., Lynham, T., and Dube, D.: The Canadian Forest Fire Danger Rating System – An Overview, For. Chron., 65, 450–457, 1989. Swets, J.: Measuring the accuracy of diagnostic systems, Science,
240, 1285–1293, 1988.
Turco, M., Llasat, M. C., Tudela, A., Castro, X., and Provenzale, A.: Brief communication Decreasing fires in a Mediterranean region (1970–2010, NE Spain), Nat. Hazards Earth Syst. Sci., 13, 649– 652, doi:10.5194/nhess-13-649-2013, 2013.
van Wagner, C. E.: Development and structure of the Canadian Forest Fire Weather Index, Forestry Tech. Rep. 35, Canadian Forestry Service, Ottawa, Canada, 1987.
Vázquez, A., Pérez, B., Fernández-González, F., and Moreno, J.: Recent fire regime characteristics and potential natural vegeta-tion relavegeta-tionships in Spain, J. Veg. Sci., 13, 663–676, 2002.
Vicente-Serrano, S., Beguería, S., and López-Moreno, J.: A Multi-scalar drought index sensitive to global warming: The Standard-ized Precipitation Evapotranspiration Index – SPEI, J. Clim., 2010.
Viegas, D., Bovio, G., Ferreira, A., Nosenzo, A., and Sol, B.: Com-parative study of various methods of fire danger evaluation in southern Europe, Int. J. Wildland Fire, 9, 235–246, 1999. Viegas, D. X., Reis, R. M., Cruz, M. G., and Viegas, M. T.:
Cali-braão do sistema canadiano de perigo de incãndio para aplicaão em Portugal, Silva Lusitana, 12, 7793, 2004.
Vilar, L., Busetto, L., Caudullo, G., and Camia, A.: Spatial and temporal analysis of socio-economic factors and for-est fires in Mediterranean Europe, EUR Report, Publica-tions Office of the European Union, Luxembourg, http: //www.meteo.unican.es/thredds/catalog/FUME/Socioeconomic_ LULC/JRC_FireDriversDatabase_EUROPE10km/catalog.html, in preparation, 2014.