SED
1, 93–141, 2009Laser diffraction psd and granular matter
strength
F. Storti and F. Balsamo
Title Page
Abstract Introduction
Conclusions References
Tables Figures
◭ ◮
◭ ◮
Back Close
Full Screen / Esc
Printer-friendly Version
Interactive Discussion
Solid Earth Discuss., 1, 93–141, 2009 www.solid-earth-discuss.net/1/93/2009/
© Author(s) 2009. This work is distributed under the Creative Commons Attribution 3.0 License.
Solid Earth Discussions
This discussion paper is/has been under review for the journal Solid Earth (SE). Please refer to the corresponding final paper in SE if available.
Particle size distributions by laser
di
ff
raction – Part 1: Sensitivity of granular
matter strength to analytical operating
procedures
F. Storti and F. Balsamo
Dipartimento di Scienze Geologiche, Universit `a “Roma Tre”, Largo S. L. Murialdo 1, 00146 Roma, Italy
Received: 6 November 2009 – Accepted: 16 December 2009 – Published: 21 December 2009 Correspondence to: F. Storti ([email protected])
SED
1, 93–141, 2009Laser diffraction psd and granular matter
strength
F. Storti and F. Balsamo
Title Page
Abstract Introduction
Conclusions References
Tables Figures
◭ ◮
◭ ◮
Back Close
Full Screen / Esc
Printer-friendly Version
Interactive Discussion
Abstract
We tested laser diffraction particle size analysis in poorly coherent carbonate
plat-form cataclastic breccias and unfaulted quartz-rich eolian sands, representing
low-and high-strength granular materials, respectively. We used two different instruments
with different sample dispersion and pumping systems and several wet and dry
ana-5
lytical procedures that included different pump speeds, measure precision tests with
and without sample ultrasonication, and different dispersant liquids. Results of our
work indicate that high strength material is not strongly affected by analytical operating
procedures, whereas low strength material is very sensitive to the pump speed, ultra-sonication intensity, and measurement run time. To reduce such a data variability, we 10
propose a workflow for analytical tests preliminary to the set up of the most appropriate SOP.
1 Introduction
Particle size distributions provide fundamental information for rock characterization and geological process description in earth sciences, including sedimentology, stratigraphy, 15
structural geology, pedology, and volcanology (e.g. Krumbein, 1941; Irani and Callis, 1963; Engelder, 1974; Friedman, 1979; Sheridan et al., 1987; Rieu and Sposito, 1991).
In the last three decades, laser diffraction particle size analysers have proved to be an
effective tool for providing particle size distributions of poorly coherent rocks and soils
(Weiss and Frock, 1976; McCave et al., 1986; de Boer et al., 1987; Wanogho et al., 20
1987; Agrawal et al., 1991; Loizeau et al., 1994; Pye and Blott, 2004; Blott and Pye, 2006). This because they need short analysis time and cover a wide size range, and because they require small size samples (e.g. Beuselinck et al., 1998), thus facilitating very detailed studies of particle size distributions in geological structures.
Laser diffraction particle size analysers provide indirect size measurements of
25
SED
1, 93–141, 2009Laser diffraction psd and granular matter
strength
F. Storti and F. Balsamo
Title Page
Abstract Introduction
Conclusions References
Tables Figures
◭ ◮
◭ ◮
Back Close
Full Screen / Esc
Printer-friendly Version
Interactive Discussion
diffract light through a given angle that increases logarithmically with decreasing size
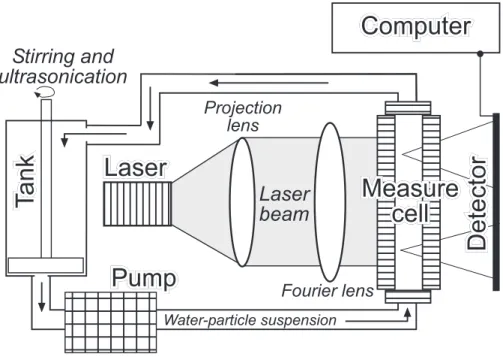
(e.g. Beuselinck et al., 1998). In “wet procedures”, few grams of material are dispersed into a liquid that circulates across a quartz measure cell illuminated by a laser beam
(Fig. 1). Different instruments have differently designed systems for stirring the
dis-persant liquid into the tank and ensuring its circulation through the measure cell by 5
mechanical pumping. A wide variety of standard operating procedures (SOP) can be
set up in laser diffraction particle size analysers. They include the selection of the
pump speed, the number of measurement runs, the length of the measurement time, and the use of dispersant agents and/or ultrasonication to aid sample disaggregation and dispersion (e.g. Blott et al., 2004; Sperazza et al., 2004). It follows that measure 10
results, particularly when dealing with datasets produced by different operators and/or
different instruments, can be influenced by the adopted SOP. Sample ultrasonication,
for example, can aid particle disaggregation by collision or, in some cases, particle agglomeration (e.g. Mason et al., 2003; Blott et al., 2004).
In this study we analysed particle size distributions of unfaulted quartz-rich (83% 15
quartz, 9% plagioclase, and 8% feldspar) eolian sands from the Priverno quarry, on the Tyrrhenian side of the Central Apennines (e.g. Angelucci and Palmerini, 1961), and carbonate cataclastic breccias from the active Assergi extensional fault system, which bounds to the south the Gran Sasso Massif in the Central Apennines, Italy (e.g. D’Agostino et al., 1998). Our results indicate that particle size data measurement 20
by laser diffraction granulometry is not straightforward in fragile granular materials. We
provide an analytical workflow for preliminary testing, propedeutic to final SOP deter-mination in granular rocks.
2 Instruments overview
Most granulometric analyses were performed with a Mastersizer 2000 laser diffraction
25
granulometer and associated dispersion units manufactured by Malvern Instruments
SED
1, 93–141, 2009Laser diffraction psd and granular matter
strength
F. Storti and F. Balsamo
Title Page
Abstract Introduction
Conclusions References
Tables Figures
◭ ◮
◭ ◮
Back Close
Full Screen / Esc
Printer-friendly Version
Interactive Discussion
sizes in the 0.02 to 2000 µm range by using a blue (488.0 µm wavelength LED) and red (633.8 µm wavelength He-Ne laser) light dual-wavelength, single-lens detection
system. The light energy diffracted by the dilute suspension circulating through the cell
is measured by 52 sensors. The light intensity adsorbed by the material is measured as
obscurationand indicates the amount of sample added to the dispersant liquid. Light
5
scattering data are accumulated in 100 size fractions bins, which are analysed at 1000 readings per second, and compiled with Malvern’s Mastersizer 2000 software by using
either full Mie or Fraunhofer diffraction theories (de Boer et al., 1987). Light scattering
data acquired by the Mastersizer 2000 granulometer were all mathematically inverted with the Mie theory, which utilizes the refractive index (RI) and absorption (ABS) of the 10
dispersed granular material, and RI of the dispersant liquid. This theory is based on the assumption that: (1) particles are homogeneous; (2) particles are spherical; (3) the optical properties of particle and dispersion medium are known; (4) suspension dilution guarantees that light scattered by one particle is measured before being-re-scattered by other particles.
15
Particle size distributions were measured from wet dispersions using both small (Malvern Hydro 2000 S) and large (Malvern Hydro 2000 MU) volume sample disper-sion units available for the Mastersizer 2000 granulometer. The Hydro 2000 S unit has a capacity of 50 to 120 ml and is equipped with a continuously variable single shaft centrifugal pump and stirrer (up to 3500 revolutions per minute; in the following rpm), 20
and by a continuously variable ultrasonic probe. The Hydro 2000 MU unit has a disper-sion mechanism consisting of a sample recirculation head immerged into a standard laboratory beaker (capacity of 600 to 1000 ml), which contains a built-in stirrer and sample recirculation centrifugal pump (from 600 to 4000 rpm), and a continuously vari-able ultrasonic probe (maximum power is 20 µm of tip displacement). A comparative 25
wet analysis was performed by a Cilas 930 laser diffraction granulometer manufactured
by Cilas, which measures particle size distributions in the 0.2 to 500 µm size range of
wet dispersions by diffraction of a laser light of 830 nm wavelength, based either on
SED
1, 93–141, 2009Laser diffraction psd and granular matter
strength
F. Storti and F. Balsamo
Title Page
Abstract Introduction
Conclusions References
Tables Figures
◭ ◮
◭ ◮
Back Close
Full Screen / Esc
Printer-friendly Version
Interactive Discussion
peristaltic pumps.
The analysed carbonate fault breccia sample, named CABRE3, was collected in the same site of samples CABRE1 and CABRE2 described in Storti and Balsamo (2009), and was sieved at 500 µm to account for the analytical size range of the Cilas 930 laser
diffraction particle size analyser. Reproducible sub-sampling up to about 20 g weight of
5
the total sample amount was achieved by using a Quantachrome sieving riffler-rotary
sample splitter. Sub-sample aliquots necessary to produce laser obscuration values between 10% and 15% were randomly selected from sub-samples (from 0.5 g to few grams) and added into the liquid-filled beaker for being analysed.
3 Factors influencing data acquisition and processing from dilute suspensions:
10
testing strategy
Both chemical and mechanical factors can influence light scattering data obtained from dilute suspensions (e.g. Sperazza et al., 2004). Chemical interactions can in fact oc-cur between the dispersion medium, the anlysed material and, possibly, the dispers-ing agent. Mechanical sample alteration can be produced by two major factors: (i) 15
ultrasonication during sample recirculation and (ii) centrifugal pump and stirrer speed. Moreover, the conversion of light scattering data into particle size distributions depends on the optical properties of both analysed material and dispersant liquid. The high vari-ability of the optical properties of rocks and sediments commonly requires iterative data reprocessing unless essentially monomineralic materials are analysed (e.g. Sperazza 20
et al., 2004).
To investigate on the influence of parameters listed above, we set up the follow-ing tests on monomineralic materials like eolian quartz sand (sub-sample aliquots SAND1x) and carbonate cataclastic breccia (sub-sample aliquots CABRE3x): pump speed test, measure precision test (instrument precision test of Blott et al., 2004), 25
ultrasonication test, chemical test, and reprocessing test. The pump speed test is
SED
1, 93–141, 2009Laser diffraction psd and granular matter
strength
F. Storti and F. Balsamo
Title Page
Abstract Introduction
Conclusions References
Tables Figures
◭ ◮
◭ ◮
Back Close
Full Screen / Esc
Printer-friendly Version
Interactive Discussion
are averaged in a single measurement), and consists of measurement runs performed
on a given sub-sample aliquot, at different stirrer and pump speed (in the following
simply referred to as pump speed) for a givent. The test starts with the set up of laser
obscuration values between 10% and 15% at half of the maximum pump speed. The pump speed is then lowered to the minimum value and few (typically 10) measurement 5
runs are performed before increasing the pump speed (typically by 100 rpm). Pro-gressive measure steps are carried out up to the maximum pump speed. Results are plotted in a mean diameter versus pump speed graph to select the most appropriate
rpm value for further analyses. The measure precision test is labelled MPtS, whereS
is the pump speed, and consists of measurement runs acquired at given pump speed 10
and measurement run time during sub-sample recirculation through the measure cell.
Our MPtS analyses typically consisted of 100 measurement runs, which means some
hundred thousands of instrument readings. Analysis of data trends is included in the measure precision test to help selecting the most appropriate number of measurement runs and to prevent significant mechanical bias. Addition of sub-sample ultrasonication 15
to the measure precision test produces the ultrasonication test US, which is labelled
as USdS, whered is the probe tip displacement in the Hydro 2000 MU dispersion unit.
Chemical effects were investigated by repeating the above mentioned sample tests
us-ing different dispersion liquids. The suffixl is added to the appropriate test labelling in
order to indicate the dispersion liquid used, which can be a solution with a dispersing 20
agent. We did not use specific labelling for decalcified tap water by coupled magnetic and chemical commercial devices, which was used in most of our analyses. The repro-cessing test consists of changing the optical properties of both granular material and dispersant liquid during light scattering data processing of a given analysis by the Mie theory through the Mastersizer 2000 software.
25
indi-SED
1, 93–141, 2009Laser diffraction psd and granular matter
strength
F. Storti and F. Balsamo
Title Page
Abstract Introduction
Conclusions References
Tables Figures
◭ ◮
◭ ◮
Back Close
Full Screen / Esc
Printer-friendly Version
Interactive Discussion
cations from previous tests. This because of the short time required by laser diffraction
particle size analysers to acquire light scattering data, thus encouraging the collection of large datasets from which sub-sets can then be easily extracted.
4 Pump speed test
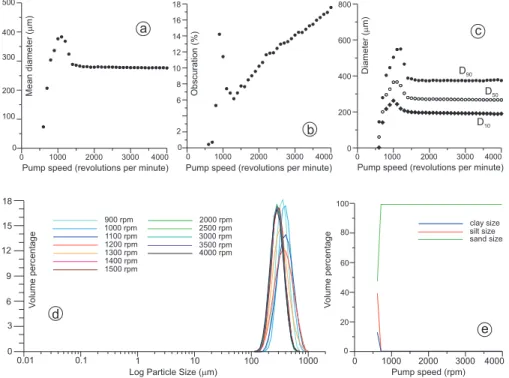
Results of the P5-test of sub-sample aliquot SAND1a (i.e. 5000 readings of the
scat-5
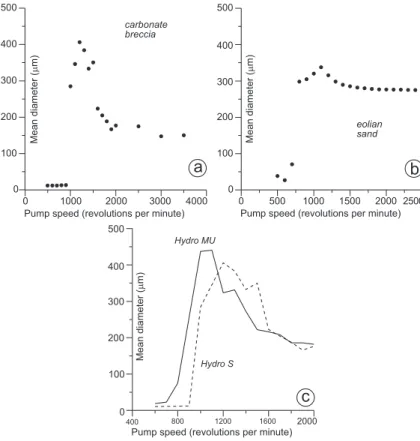
tered light energy distribution for each measurement run) are illustrated in Fig. 2. Mean diameters show an asymmetric bell-shaped trend characterized by very low values at 600 and 700 rpm, a maximum at 1000 to 1200 rpm, and an almost flat envelope of mean diameter values at pump speed higher than 1800 rpm (Fig. 2a). The correspond-ing laser obscuration values show a much higher variability, with a peak at 900 rpm and 10
a minimum at 1300 rpm, followed by a near constant increase at higher pump speed
values (Fig. 2b). The trend of D10, D50, and D90percentile data points strongly
resem-bles the distribution of the mean diameters (Fig. 2c). Granulometric curves averaged over 10 measurement runs indicate a strongly unimodal particle size distribution with some variability of both volume percentage and modal peak size between 900 and 15
1500 rpm. Conversely, almost overlapping curves support strongly consistent results at pump speed values greater than 2000 rpm (Fig. 2d). The well sorted particle size dis-tribution of the sample is illustrated by the pattern of clay, silt, and sand size fractions: starting from 700 rpm, the latter includes 100% of the analysed material (Fig. 2e).
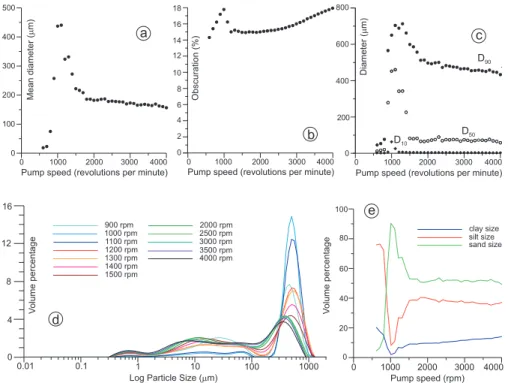
The P5-test of sub-sample aliquot CABRE3a shows an asymmetric bell-shaped trend
20
characterized by very low values of mean diameters at 600 to 800 rpm, followed by an abrupt increase up to 1100 rpm (Fig. 3a). With increasing the pump speed, mean di-ameter values rapidly decrease up to 1500 rpm and then continue to overally decrease quite slowly up to the maximum pump speed. The corresponding laser obscuration values show a rapid initial increase up to about 18% at 1000 rpm, followed by a rapid 25
SED
1, 93–141, 2009Laser diffraction psd and granular matter
strength
F. Storti and F. Balsamo
Title Page
Abstract Introduction
Conclusions References
Tables Figures
◭ ◮
◭ ◮
Back Close
Full Screen / Esc
Printer-friendly Version
Interactive Discussion
increasing the pump speed (Fig. 3b). The D10, D50, and D90 percentiles show
bell-shaped envelopes, qualitatively similar to that of the mean diameter (Fig. 3c). From
2000 to 4000 rpm, the D90 data point envelope shows a constant and significant
de-crease, while D50is characterized by a higher scattering and only a slightly decreasing
trend. D10 values decrease as well and at 4000 rpm reach almost half of the value
5
at 2000 rpm. Granulometric curves averaged over 10 measurement runs, are char-acterized by a strongly asymmetric shape that includes a major peak in the coarser fractions and a subordered “long tail” in the finer ones (Fig. 3d). With increasing the pump speed, the height of the major peak decreases and shifts towards finer modal values, and the volume percentage of finer particles (equivalent diameter smaller than 10
about 100 µm) correspondingly increases. The pattern of clay, silt, and sand size frac-tion curves indicates an initial dominance of silt sizes, followed by their abrupt decrease and a corresponding increase of san size fractions at pump speed values correspond-ing to the maximum mean diameter values (Fig. 3e). At pump speed values higher than 1500 rpm, the sand size fraction slightly varies about a plateau value, the silt size 15
fraction slightly decreases, and the clay size fraction slightly increases.
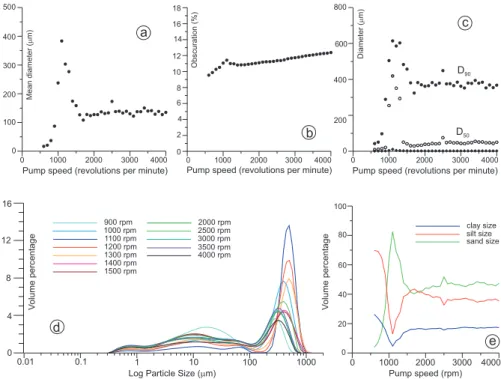
Results of the P1-test of sub-sample aliquot CABRE3b are illustrated in Fig. 4. The
overall behaviour of this test is similar to the previous one, with a slightly higher scat-tering of mean diameter and percentile values. Granulometric curves do not show the almost constant shape evolution that characterizes those acquired at 5 s of measure-20
ment run time, despite the overall trend is comparable with the latter.
A comparative P5-test of sub-sample aliquot CABRE3c was performed with the
Hy-dro 2000 S dispersion unit. The overall behaviour is quite similar to the previous test, with very low mean diameter values at 500 rpm, a maximum at 1200 rpm, and a de-crease up to 2000 rpm. The last steps, with pump speed increments of 500 rpm, show 25
quite small variations (Fig. 5a). A P5-test by the Hydro 2000 S dispersion unit of
SED
1, 93–141, 2009Laser diffraction psd and granular matter
strength
F. Storti and F. Balsamo
Title Page
Abstract Introduction
Conclusions References
Tables Figures
◭ ◮
◭ ◮
Back Close
Full Screen / Esc
Printer-friendly Version
Interactive Discussion
5s of measurement run time by the Hydro 2000 MU and S dispersion units, shows that the former systematically provides higher mean diameter values at low pump speed ranges up to 1100 rpm, including the highest one (Fig. 5c). In the 1200 to 1600 rpm range, higher mean diameter values are provided by the Hydro 2000 S unit. At higher pump speed, values provided by the two dispersion units are similar.
5
4.1 Interpretation of the pump speed test results
The meaning of the bell-shaped curve provided by pump speed tests is not straight-forward. Low velocity stirring and pumping favour sedimentation of coarser particles at the bottom of the beaker and/or slow motion in the recirculation unit and measure cell, thus producing initial size distributions biased towards the finer particles. The rapid 10
increase of mean diameter values derives from the improved recirculation of progres-sively coarser particles with increasing the pump and stirrer speed. The highest mean diameter values can either relate to the actual particle size distribution, or to an artefact caused by stagnation/slow motion of coarser material in the measure cell. In the first case, the subsequent decrease of mean diameter values should indicate ongoing parti-15
cle size reduction, accompanied by a significant increase of laser obscuration at values higher than the initial reference interval. For sub-sample aliquot CABRE3a, such an increase occurs at pump speed values higher than 2100 rpm, whereas obscuration re-mains almost constant and within the initial reference interval from 1500 to 2000 rpm (Fig. 3b). This evidence suggests that highest mean diameter values are coarseward 20
biased by ineffective sample recirculation, and that values in the plateau
characteriz-ing both mean diameter and laser obscuration values, correspond to the most likely measurement runs. In CABRE3b the obscuration data point plateau adjacent to the maximum value is not well developed and, conversely, it seems indicating a slight
in-crease of finer material during measurement. However, analysis of the D10, D50, and
25
D90 percentiles does not indicate significant particle size reduction despite significant
scattering.
SED
1, 93–141, 2009Laser diffraction psd and granular matter
strength
F. Storti and F. Balsamo
Title Page
Abstract Introduction
Conclusions References
Tables Figures
◭ ◮
◭ ◮
Back Close
Full Screen / Esc
Printer-friendly Version
Interactive Discussion
different and this can relate to the different rock type and size. Initial values very close to
zero can be explained by the very good sorting of the sample, almost totally consisting of sand-size particles that, at very low pump speed, are almost entirely deposited at the bottom of the beaker. The constant increase of laser obscuration values at pump speed higher than 1300 rpm indicates an increase of the material amount in the dispersion 5
unit. Percentiles, however, would support much smaller size variations (Fig. 2c). This apparently contrasting evidence can be reconciled by admitting an increase of very fine particles and negligible overall particle size reduction. The source of such extremely fine grained material is likely collision-induced surface polishing of quartz grains, which are originally coated by iron hydroxide thin films imparting them a slightly orange colour. 10
The same colour characterized water in the beaker at the end of the analyses.
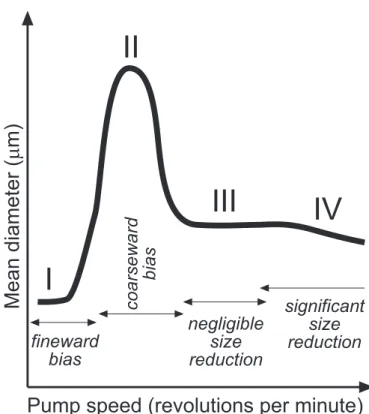
Results from the pump speed tests illustrated above can be schematically explained by a composite trend of mean values as a function of pump speed values, where four major stages can be identified (Fig. 6): (1) an initial segment characterized by very
low mean diameter values, which is interpreted to indicate fineward bias by ineff
ec-15
tive material recirculation into the dispersion unit and measure cell; (2) the adjacent, bell-shaped segment containing the maximum mean diameter values, which is
inter-preted to indicate coarseward bias by ineffective material recirculation; (3) the third,
flat-lying or slowly dipping segment, which is interpreted to indicate effective material
recirculation without significant mechanical alteration, thus providing the most effective
20
pump speed size range for further analyses; (4) the fourth segment, characterised by progressively decreasing mean diameter values indicating the occurrence of significant mechanical alteration and consequent fineward biasing of the sample material data.
5 Measure precision test
Results from the pump speed test on the SAND1 sample indicate negligible influence 25
of this parameter for values higher than 2000 rpm. We performed a MP25005 test
SED
1, 93–141, 2009Laser diffraction psd and granular matter
strength
F. Storti and F. Balsamo
Title Page
Abstract Introduction
Conclusions References
Tables Figures
◭ ◮
◭ ◮
Back Close
Full Screen / Esc
Printer-friendly Version
Interactive Discussion
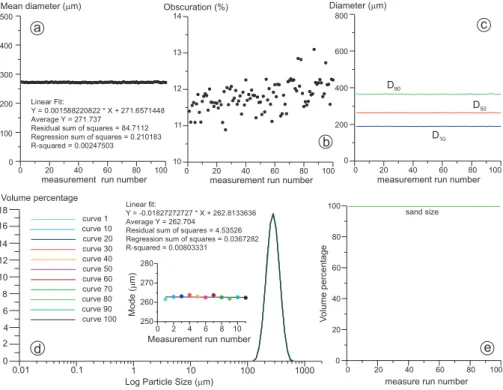
SAND1c (Fig. 7). Mean diameter values maintain extremely similar during the 100 runs,
as well as D10, D50, and D90 percentiles, while obscuration values are scattered and
progressively increase. Granulometric curves selected to monitor the evolution of the test show virtually identical shapes, as supported by the very low variations of the corresponding mode values (Fig. 7d). This indicates that no material finer than sand 5
was produced during measurement runs (Fig. 7e).
The pump speed test for sample CABRE3 indicates that 2000 rpm is the most
suit-able pump speed value to ensure effective material recirculation without very invasive
mechanical alteration. Moreover, 5 s of measurement run time are expected to pro-vide more statistically robust results than 1 s. Accordingly, we initially performed a 10
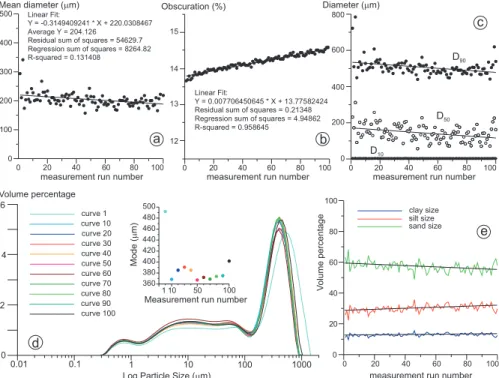
MP20005, test on sub-sample aliquot CABRE3d (Fig. 8). Mean diameter values show
significant scattering and a slightly decreasing trend with time, while laser obscuration
progressively increased. The value of D50, and D90 percentiles show a pattern similar
to the mean diameter, being the scattering of the former particularly higher. On the
other hand, D10percentile values are extremely small. Selected granulometric curves
15
are quite similar apart from the first run one (Fig. 8d). The corresponding modal val-ues show a much higher mode for the first run, followed by a drop of about 140 µm in the second one. Slightly higher values characterize runs 3 to 5, and then very sim-ilar values pertain to the following runs (about 350 µm) with the exception of the last one, which has a higher mode, slightly higher than 400 µm. The distribution of sand, 20
silt and clay size fractions show a scattered pattern about a slightly decreasing trend for the sand size, less scattering about a slightly increasing trend for the silt size, and negligible scattering about near constant values for the clay size fraction (Fig. 8e).
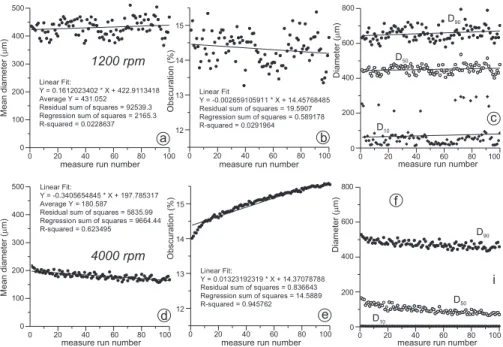
Data from MP tests at 1200 rpm and 4000 rpm pump speed, respectively, performed for comparative purposes on the influence of pump speed, are illustrated in Fig. 9. 25
mea-SED
1, 93–141, 2009Laser diffraction psd and granular matter
strength
F. Storti and F. Balsamo
Title Page
Abstract Introduction
Conclusions References
Tables Figures
◭ ◮
◭ ◮
Back Close
Full Screen / Esc
Printer-friendly Version
Interactive Discussion
surement run time were performed at 2000 rpm of pump speed and 1 s, 10 s, 20 s, and
40 s of measurement run time, respectively. The MP20001, test on sub-sample aliquot
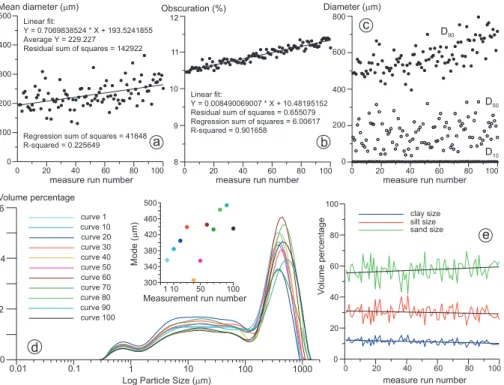
CABRE3g (Fig. 10) is characterized by intense scattering of mean diameter values that show an increasing trend with increasing the run number (i.e. time). Intense
scatter-ing also occurs in D50, and D90 percentiles and in the sand, silt and clay size fraction
5
data. The selected granulometric curves show a higher variability and a non systematic trend, compared to the corresponding ones acquired at 5 s of measurement run time, as also indicated by the corresponding modal values (Fig. 10d). For a constant total duration of the measure precision test, increasing the measurement run time causes a decrease of mean diameter data scattering and more linearly increasing trends of laser 10
obscuration values (Fig. 11). We also run a MP5test on sub-sample aliquot CABRE3k
by using the Cilas 930 laser diffraction particle size analyser. Results provided
signifi-cantly smaller mean diameter values with respect to those provided by the Mastersizer 2000, and these values systematically decreased through time, as indicated by the very good linear best fit (Fig. 12).
15
Plotting mean diameters of test MP20005 averaged every five measurement runs,
indicates a progressive decrease of values with time. In particular, such a decrease can
be effectively fitted by an exponential curve, and the highest variation occurs between
the first two points (Fig. 13a). A similar trend characterizes the corresponding modal values, despite higher scattering (Fig. 13b). A detail of laser obscuration data for the 20
first ten runs shows a very slight, almost linear increase, which reaches about 1% at the end of the test (Fig. 13c). The corresponding granulometric curves indicate that only the first and third runs provided coarser distributions, with a modal peak of about 510 µm, while the remaining eight ones are quite similar and have a modal peak of about 400 µm that remains unchanged also after 50 and 100 runs (Fig. 13d). In 25
particular, the third run curve provides the coarsest distribution, and the corresponding
D10, D50, and D90 percentiles and modal value are outliers with respect to the overall
SED
1, 93–141, 2009Laser diffraction psd and granular matter
strength
F. Storti and F. Balsamo
Title Page
Abstract Introduction
Conclusions References
Tables Figures
◭ ◮
◭ ◮
Back Close
Full Screen / Esc
Printer-friendly Version
Interactive Discussion
5.1 Interpretation of the measure precision test results
The measure precision test provided contrasting results depending on the rock type. Carbonate cataclastic breccias are sensitive to the material recirculation time (i.e. the number of measurement runs and/or the measurement run time), whereas eolian sand data remains almost unaltered through time. In particular, in carbonate cataclastic 5
breccias a significant difference occurs between the first run and the following ones,
suggesting that only short recirculation times ensure a small mechanical bias to particle size data from wet suspension analyses.
6 Ultrasonication test
An ultrasonication test on eolian sand was performed on sub-sample aliquot SAND1d, 10
using the maximum ultrasonication probe tip displacement (20 µm), 2500 rpm of pump
speed, and 5 s of measurement run time (US205). Mean diameters remain almost
constant in the first 26 runs, with an average value of 270.8 µm, and then suddenly steps down to an average value of 262.3 µm in the remaining 73 runs of the test. The average value over 100 runs is 264.5 µm (Fig. 14a). Laser obscuration values 15
increase of about 12.5% during the test (Fig. 14b). When only the first 10 granulometric curves are compared, they show a virtually constant modal peak at about 259 µm. The corresponding volume percentage drops of about 1.75% from curve 7 onward (Fig. 14c). Modal values remain almost constant for the entire test, about an average value of 258.5 µm (Fig. 14d). Contrasting these 10 curves from the ultrasonication test, 20
against the first one from the measure precision test on sub-sample aliquot SAND1c
indicates negligible differences(Fig. 14c).
Ultrasonication intensities of 2.5 µm, 5 µm, 10 µm, and 20 µm of tip displacement were applied to the carbonate cataclastic breccia, using a pump speed of 2000 rpm and 5 s of measurement run time. Results indicate that increasing the ultrasound en-25
SED
1, 93–141, 2009Laser diffraction psd and granular matter
strength
F. Storti and F. Balsamo
Title Page
Abstract Introduction
Conclusions References
Tables Figures
◭ ◮
◭ ◮
Back Close
Full Screen / Esc
Printer-friendly Version
Interactive Discussion
to power law best fit curves, (ii) higher increases of laser obscuration, and (iii) a de-crease of average modal values up to 10 µm, which remain almost constant when the maximum probe tip displacement is used (Fig. 15). Analysis of granulometric curves pertaining to the first 10 runs and to runs 50 and 100 in each test shows a progressively
increasing difference between first run curves and the remaining ones with
increas-5
ing the ultrasonication probe tip displacement (Fig. 16). Moreover, shape differences
among curves increase, particularly between test US2.55and the remaining ones, and
the modal peak volume percentage of the bulk of the curves in each test decreases with increasing ultrasonication intensity. Comparison of the first run curves from test with and without ultrasonication shows that the latter provide a significantly coarser 10
particle size distribution in the modal peak (Fig. 16e). The influence of ultrasonication
is also illustrated by the difference between first-run modal values and those averaged
over the first 10 runs of the corresponding tests. The greater difference occurs when no
ultrasonication was used. The smaller difference occurs at the minimum ultrasonication
intensity and then it increases up to the US105test.
15
6.1 Interpretation of the ultrasonication test results
Results from ultrasonication tests indicate negligible effects on eolian sand, particularly
when only the first 10 to 20 runs are considered, according to the measure precision test evidence. On the other hand, in the carbonate cataclastic breccia sub-sample aliquots, ultrasonication has a much greater influence causing significant particle size 20
reductions after few measurement runs, as indicated by the concomitant reduction of mean diameter and mode values, by the increase of laser obscuration, and by the increase of volume percentages in the 0.5 µm to 100 µm segments of granulometric curves. Even after a single measurement run, ultrasonication is able to reduce the modal peak value of particle size distributions of about 60 µm to 80 µm.
SED
1, 93–141, 2009Laser diffraction psd and granular matter
strength
F. Storti and F. Balsamo
Title Page
Abstract Introduction
Conclusions References
Tables Figures
◭ ◮
◭ ◮
Back Close
Full Screen / Esc
Printer-friendly Version
Interactive Discussion
7 Chemical test
The influence of denaturated ethylic alcohol on data acquisition from eolian sand was
investigated by performing a MP25005al, test on sub-sample aliquot SAND1e. Results
are very consistent, as illustrated by the almost constant mean diameter values, by the flat lying best fit line of mode values, and by the very similar granulometric curves in 5
the first 10 runs, which provide an extremely good overlap with the first curve from the same test using decalcified tap water as dispersant liquid (Fig. 17). The corresponding modal values show an initial decrease of less than 5 µm, reaching a plateau value after 4 runs.
Two measure precision tests were performed on CABRE3p and CABRE3q sub-10
sample aliquots, using denaturated ethylic alcohol and demineralised water, respec-tively (Fig. 18). The first test provided quite scattered mean diameter and mode values, both characterized by flat-lying best fit lines, which are smaller than the correspond-ing ones obtained from demineralised water of about 70 µm and 53 µm, respectively. The increase of laser obscuration values is greater for the dispersion in denaturated 15
ethylic alcohol. Analysis of granulometric curves pertaining to the first 10 runs indi-cates a higher variability for measurements acquired in denaturated ethylic alcohol, of both curve shape and modal peak elevation (Fig. 18g, h). Such a higher variability is confirmed by the analysis of the corresponding modal values. Finally, comparison with the first run curve from the same test using decalcified tap water as dispersant 20
liquid, indicates that granulometric curves obtained from the denaturated ethylic
alco-hol suspension have much greater differences with respect to the corresponding ones
acquired using demineralised water as dispersant liquid.
7.1 Interpretation of the chemical test results
Test results indicate that the use of denaturated ethylic alcohol has a negligible in-25
sub-SED
1, 93–141, 2009Laser diffraction psd and granular matter
strength
F. Storti and F. Balsamo
Title Page
Abstract Introduction
Conclusions References
Tables Figures
◭ ◮
◭ ◮
Back Close
Full Screen / Esc
Printer-friendly Version
Interactive Discussion
sampling, even in well sorted sediments like dune sands. On the other hand, the same dispersant liquid causes a decrease of about 75 µm of mean diameter values when car-bonate cataclastic breccia is analysed. The evidence that, when demineralised water is used, results are very similar to those from the corresponding test in decalcified tap water rules out any significant bias produced by sub-sampling and supports particle 5
fragmentation during suspension recirculation. This is well illustrated by the systematic decrease of modal peak volumes and size, and by the corresponding increase of vol-ume percentage values in the 0.5 µm to 110 µm segments of granulometric curves in Fig. 18g. Higher variations occur after only two runs.
8 Reprocessing test
10
Following from previous test on sub-sample aliquot SAND1c was selected for data
re-processing. Changing RI values from 1.4 to 1.8 causes negligible effects in eolian
quartz sand, as illustrated in Fig. 19. The corresponding granulometric curves almost perfectly overlap and percentiles and modal values show a very small variability. The same result was obtained when varying ABS values from 1.00 to 0.01 (Fig. 20). Chang-15
ing RI in carbonate cataclastic breccia (first run of test MP20005on sub-sample aliquot
CABRE3d) causes some variability in the corresponding grain size distributions,
par-ticularly from RI=1.4 to RI=1.6 (Fig. 21). Analysis of residuals associated with best
fit curves indicates that the most appropriate RI value is 1.6. Higher values, however, do not significantly influence the computed particle size distributions, as lower values 20
do particularly for the volume percentage of sizes lower than about 2 µm (Fig. 21b).
The major effect of changing ABS values from 1.00 to 0.01 on CABRE material is to
progressively shorten the tail of granulometric curves, from about 0.25 µm (ABS=1.00–
0.50) to 0.6 µm when ABS=0.01 (Fig. 22). For ABS lower than 1.00, decreasing particle
absorption causes an increase of percentile values and a decrease of modal values. 25
SED
1, 93–141, 2009Laser diffraction psd and granular matter
strength
F. Storti and F. Balsamo
Title Page
Abstract Introduction
Conclusions References
Tables Figures
◭ ◮
◭ ◮
Back Close
Full Screen / Esc
Printer-friendly Version
Interactive Discussion
effects on eolian quartz sand, and an influence on CABRE material that is comparable
to what produced by changing RI of carbonate particles (Fig. 23).
8.1 Interpretation of reprocessing test results
Results of these tests indicate that in the case of the analyzed materials, the sensitivity of light scattering data reprocessing by the Mie theory is mainly governed by the par-5
ticle size range, rather than by their optical properties. In fact, the very good sorting of sample SAND1 results in a virtually insensitive behavior to reprocessing, while the large spanning of sizes in CABRE3 enhances the sensitivity of particles finer that about 2 µm.
9 Discussion
10
Results illustrated above indicate that particles with different strength respond in a very
different way to the same testing strategy during particle size determination by laser
diffraction. Quartz eolian sand provided virtually identical particle size distributions
regardless of the adopted operating procedure. On the other hand, carbonate cata-clastic breccia is very sensitive to operating procedures. Such a contrast indicates that 15
the variability associated with the sample CABRE3 does not depend on instrumental bias, but instead it relates to the peculiar fabric of cataclastic rocks derived from mas-sive protoliths like platform carbonates. In fact, in this case particles are produced by multiple fracturing, rolling and grinding of material within fault zones (e.g. Borg et al., 1960; Storti et al., 2003; Sammis and Ben Zion, 2008). Particle size depends on the 20
relative strength distribution along cleavage and microfracture sets as a function of the applied stress (e.g. Sammis et al., 1987). Accordingly, the mechanical behaviour of these carbonate cataclastic particles can be compared to that of sedimentary particles made of cohesive aggregate grains. Conversely, multiple collisions of quartz particles
during eolian transport along coastal dunes ensures effective exploiting of pre-existing
SED
1, 93–141, 2009Laser diffraction psd and granular matter
strength
F. Storti and F. Balsamo
Title Page
Abstract Introduction
Conclusions References
Tables Figures
◭ ◮
◭ ◮
Back Close
Full Screen / Esc
Printer-friendly Version
Interactive Discussion
flaws. The resulting rounded particles are strong enough for being not significantly
influenced by mechanical solicitations in laser diffraction particle size analysers.
It follows that determining the appropriate operating procedure bears a
fundamen-tal importance for heavily microfractured materials, while it has secondary effect when
high strength particles are analysed. In the latter case, only pump speed can influence 5
the final results by not ensuring effective particle recirculation in the dispersion unit.
However, given the high strength of this material, pump speed values close or higher than half of maximum speed (e.g. 2000–3000 rpm) can be used without expecting any significant mechanical bias. On the other hand, operating procedures as less inva-sive as possible are required when analysing fragile granular materials. In this case, 10
finding the proper analytical workflow benefits of some general guidelines for broad sample categories, followed by further specific refinements. Moreover, selecting an ef-fective instrumentation plays a fundamental role to determine particle size distributions of fragile materials. According to our tests, peristalting pumping during sample
recircu-lation introduces a systematic bias to the final results and, consequently, laser diff
rac-15
tion analysers adopting this technical solution are inappropriate. On the other hand,
centrifugal pumping provides a much more flexible and effective solution for analysing
fragile materials. Between the two Malvern dispersion units we used, the large volume
Hydro 2000 MU ensured effective sample recirculation at lower pump speed values
compared to the Hydro 2000 S. 20
Our preferred workflow (Fig. 24) starts with a pump speed test to provide indications on the pump speed range for further testing. Short measurement run times (typically 5 s as a starting value) are used in pump speed analyses, in order to minimise sub-sample mechanical alteration without compromising the statistical robustness of the data. Results from the P-test provide constraints for MP and US test pairs performed at 25
SED
1, 93–141, 2009Laser diffraction psd and granular matter
strength
F. Storti and F. Balsamo
Title Page
Abstract Introduction
Conclusions References
Tables Figures
◭ ◮
◭ ◮
Back Close
Full Screen / Esc
Printer-friendly Version
Interactive Discussion
the mode and percentiles, among which D10, D50, and D90 are the most common
ones. Once the most appropriate parameters in terms of best sample recirculation, measure run time, and measure run number are selected, all information for defining the most appropriate SOP is available for a given dispersion liquid. The next step is
to check the effectiveness of the selected dispersion medium by running the same test
5
with different dispersion liquids. Comparison of all results leads to the selection of
the final SOP, which can be repeated for several sub-samples to perform a sampling precision test (Blott et al., 2004) that allows evaluating measure reproducibility (Fig. 24).
It is worth nothing that, despite the effectiveness of statistical parameters like mean
diameter, percentiles, and others, they cannot replace the use of granulometric curves 10
for comparing results from different tests. This because very similar average values
can relate to very different granulometric curves (e.g. Selley, 2000).
10 Conclusions
Particle size distributions significantly contribute to the description of many geologi-cal processes including sedimentation, rock fragmentation and soil formation. Modern 15
laser diffraction particle size analysers ensure fast data acquisition over a wide size
range, coupled with the appropriate flexibility for analysing very different granular
mate-rials. This flexibility, however, can produce severely biased results when inappropriate analytical operating procedures are used, particularly on fragile materials. We anal-ysed both high strength (eolian quartz sand) and low strength (carbonate cataclastic 20
breccia) essentially monomineralic materials to test the impact of different analytical
operating procedures involving particle dispersion into a liquid, on the obtained particle size distributions. Our results can be summarised by the following points:
1. centrifugal pumping the particle-liquid dilute dispersion at the most appropriate pump speed is crucial in wet analyses of granular material to prevent (i) dramatic 25
underestimating coarser particles when ineffective pumping and stirring allow
SED
1, 93–141, 2009Laser diffraction psd and granular matter
strength
F. Storti and F. Balsamo
Title Page
Abstract Introduction
Conclusions References
Tables Figures
◭ ◮
◭ ◮
Back Close
Full Screen / Esc
Printer-friendly Version
Interactive Discussion
and stirring allow transient particle stagnation within the measure cell; (iii) under-estimating coarser particles when fast pumping and stirring produce significant particle size reduction in low strength material during measure running;
2. high strength material is not significantly influenced by the adopted
instrumenta-tion and standard operating procedure, provided that effective sample
recircula-5
tion is obtained in the dispersion unit;
3. adding ultrasonication in wet analyses of low strength material systematically causes mechanical particle size reduction during measure running that, however,
is less effective than what caused by fast pumping and stirring during sample
re-circulation and mainly produces very fine particles by polishing of the larger ones; 10
4. in low strength material, the number of averaged measurement runs has to be carefully determined by statistical data analysis of large datasets in order to en-sure robust outputs and minimize mechanical biasing of particle size during recir-culation in the dispersion unit;
5. Selecting appropriate optical properties for the analysed sample material and dis-15
persant liquid, respectively, is particularly important for fine and very fine particles,
being coarser ones less affected by this parameter.
We propose a workflow as a guideline for addressing particle size determinations by
laser diffraction granulometry. Application of this procedure is typically flexible due to
the great variability of analysed materials and the common need of several iterations 20
before reaching the most statistically robust results. Systematic support of laser diff
SED
1, 93–141, 2009Laser diffraction psd and granular matter
strength
F. Storti and F. Balsamo
Title Page
Abstract Introduction
Conclusions References
Tables Figures
◭ ◮
◭ ◮
Back Close
Full Screen / Esc
Printer-friendly Version
Interactive Discussion
Acknowledgements. We are grateful to R. M. Joeckel for his helpful review of the
submit-ted manuscript. Constructive criticism and advice from S. Blott on an early version of the manuscript were very useful for significantly improving it. Funding for this work was provided by the “Roma Tre” University Laboratory Upgrade Programme, grants to F. Storti, and by the Italian MIUR (Ministero dell’Istruzione, dell’Universit `a e della Ricerca). L. Aldega, C. Giampaolo
5
and S. Lo Mastro kindly provided the composition of the Priverno sand by X-ray diffraction. We are grateful to Malvern Instruments Ltd. (particularly to B. Floure, P. Kippax and A. Virden) and to Alfatest s.r.l. (particularly to M. Congia and V. Polchi) for their technical support and advice. This paper is dedicated to the memory of Renato Funiciello, who inspired and encouraged our work during these years.
10
References
Agrawal, Y. C., McCave, I. N., and Riley, J. B.: Laser diffraction size analysis, in: Principles, Methods and Application of Particle Size Analysis, edited by: Syvitski, J. P. M., Cambridge University Press, Cambridge, 119–128, 1991.
Angelucci, A. and Palmerini, V.: Studio sedimentologico delle sabbie rosse di Priverno (Lazio
15
sud-occidentale), Geologica Romana, 3, 203–225, 1961.
Beuselinck, L., Govers, G., Poesen, J., Degraer, G., and Froyen, L.: Grain-size analysis by laser diffractometry: comparison with the sieve-pipette method, Catena, 32, 193–208, 1998. Blott, S. J., Croft, D. J., Pye, K., Saye, S. E., and Wilson, H. E.: Particle size analysis by
laser diffraction, in: Forensic Geoscience: Principles, Techniques and Applications, edited
20
by: Pye, K. and Croft, D. J., Geological Society, London, Special Pubblication, 232, 63–73, 2004.
Blott, S. J. and Pye, K.: Particle size distribution analysis of sand-size particles by laser diff rac-tion: an experimental investigation of instrument sensitivity and the effects of particle shape, Sedimentology, 53, 671–685, 2006.
25
Borg, I., Friedman, M., Handin, J., and Higgs, D. V.: Experimental deformation of S. Peter sand: a study of cataclastic flow, Geol. Soc. Am. Mem., 79, 133–191, 1960.
D’Agostino, N., Chamot-Rooke, N., Funiciello, R., Jolivet, L., and Speranza, F.: The role of pre-existing thrust faults and topography on the styles of extension in the Gran Sasso range (central Italy), Tectonophysics, 292, 229–254, 1998.
SED
1, 93–141, 2009Laser diffraction psd and granular matter
strength
F. Storti and F. Balsamo
Title Page
Abstract Introduction
Conclusions References
Tables Figures
◭ ◮
◭ ◮
Back Close
Full Screen / Esc
Printer-friendly Version
Interactive Discussion de Boer, G. B. J., de Weerd, C., Thoenes, D., and Goossens, H. W. J.: Laser diffraction
spec-trometry: Fraunhofer diffraction versus Mie scattering, Particle Characterization, 4, 138–146, 1987.
Engelder, J. T.: Cataclasis and the generation of fault gouge, Geol. Soc. Am. Bull., 85, 1515– 1522, 1974.
5
Friedman, G. M.: Differences in size distributions of populations of particles among sands of various origins, Sedimentology, 26, 3–32, 1979.
Irani, R. R. and Callis, C. F.: Particle size: measurements, interpretation, and application, John Wiley and Sons, New York, 1963.
Krumbein, W. C.: Measurement and geologic significance of shape and roundness of
sedimen-10
tary particles, J. Sed. Petr., 11, 64–72, 1941.
Loizeau, J. L., Arbouille, D., Santiago, S., and Vernet, J. P.: Evaluation of a wide range laser diffraction grain size analyzer for use with sediments, Sedimentology, 41, 353–361, 1994. Mason, J. A., Jacobs, P. M., Greene, R. S. B. and Nettleton, W. D.: Sedimentary aggregates in
the Peoria Loess of Nebraska, USA, Catena, 53, 377–397, 2003.
15
McCave, I. N., Bryant, R. J., Cook, H. F. and Coughanowr, C. A.: Evaluation of a laser-diffraction-size analyzer for use with natural sediments, J. Sed. Petr., 56, 561–564, 1986. Pye, K. and Blott, S. J.: Particle size analysis of sediments, soils and related particulate
ma-terials for forensic purposes using laser granulometry, Forensic Science Int., 144, 19–27, 2004.
20
Rieu, M. and Sposito, G.: Fractal fragmentation, soil porosity and soil water properties: I. Theory, Soil Sci. Soc. Am. J., 55, 1231–1238, 1991.
Sammis, C. G. and Ben Zion, Y.: Mechanics of grain-size reduction in fault zones, J. Geophys. Res., 113, B02306, doi:10.1029/2006JB004892, 2008.
Sammis, C. G., King, G., and Biegel, R.: The kinematics of gouge deformation, Pure Appl.
25
Geophys., 125, 777–812, 1987.
Selley, R. C.: Applied Sedimentology, second edition, Academic Press, SanDiego, 2000. Sheridan, M. F., Wohletz, K. H., and Dehn, J.: Discrimination of grain-size sub-populations in
pyroclastic deposits, Geology, 15, 367–370, 1987.
Sperazza, M., Moore, J. N., and Hendrix, M. S.: High-resolution particle size analysis of
nat-30
urally occurring very fine-grained sediment through laser diffractometry, J. Sedim. Res., 74, 736–743, 2004.
SED
1, 93–141, 2009Laser diffraction psd and granular matter
strength
F. Storti and F. Balsamo
Title Page
Abstract Introduction
Conclusions References
Tables Figures
◭ ◮
◭ ◮
Back Close
Full Screen / Esc
Printer-friendly Version
Interactive Discussion insights for non-self-similar cataclasis, Earth Planet. Sci. Lett., 206, 173–186, 2003.
Wanogho, S., Gettinby, G., and Caddy, B.: Particle size distribution analysis of soils using laser diffraction, Forensic Science Int., 33, 117–128, 1987.
Weiss, E. L. and Frock, H. N.: Rapid analysis of particle-size distributions by laser light scatter-ing, Powder Technology, 14, 287–293, 1976.
SED
1, 93–141, 2009Laser diffraction psd and granular matter
strength
F. Storti and F. Balsamo
Title Page
Abstract Introduction
Conclusions References
Tables Figures
◭ ◮
◭ ◮
Back Close
Full Screen / Esc
Printer-friendly Version
Interactive Discussion
Laser
Laser
beam
Projectionlens
Fourier lens
Water-particle suspension
Stirring and
ultrasonication
T
ank
Measure
cell
Pump
Detector
Computer
SED
1, 93–141, 2009Laser diffraction psd and granular matter
strength
F. Storti and F. Balsamo
Title Page
Abstract Introduction
Conclusions References
Tables Figures
◭ ◮
◭ ◮
Back Close
Full Screen / Esc
Printer-friendly Version
Interactive Discussion
a
b
c
0 1000 2000 3000 4000
0 100 200 300 400 500
Pump speed (revolutions per minute)
Mean diameter (
m
m)
0 1000 2000 3000 4000
0 2 6 8 10 12 14 16 18
Obscuration (%)
Pump speed (revolutions per minute)
0 1000 2000 3000 4000
0 200 400 600 800
Diameter (
m
m)
Pump speed (revolutions per minute) D50
D10
D90
d
Log Particle Size (mm)
V
olume percent
age
0.01 0.1 1 10 100 1000
6 9 12 18
3
0
900 rpm
1400 rpm 1500 rpm 1000 rpm 1100 rpm 1200 rpm 1300 rpm
2500 rpm 3000 rpm 3500 rpm 4000 rpm 2000 rpm
15 clay size
silt size sand size
V
olume percent
age
Pump speed (rpm)
0 1000 2000 3000 4000
0 20 40 60 80 100
e
Fig. 2. Results of the pump speed test P5performed on sub-sample aliquot SAND1a by the
Hydro 2000 MU dispersion unit. (a) Mean diameter value evolution with increasing the pump speed from 600 up to 4000 rpm.(b)Laser obscuration value progression during the same test.
SED
1, 93–141, 2009Laser diffraction psd and granular matter
strength
F. Storti and F. Balsamo
Title Page
Abstract Introduction
Conclusions References
Tables Figures
◭ ◮
◭ ◮
Back Close
Full Screen / Esc
Printer-friendly Version
Interactive Discussion
c
Diameter (
m
m)
a
0 100 200 300 400 500
Pump speed (revolutions per minute)
0 1000 2000 3000 4000
Mean diameter (
m
m)
b
0 1000 2000 3000 4000
Pump speed (revolutions per minute)
Obscuration (%)
0 2 4 6 8 10 12 14 16 18
0 200 400 600 800
Pump speed (revolutions per minute)
D50
D10
D90
0 1000 2000 3000 4000
clay size silt size sand size
V
olume percent
age
Pump speed (rpm) d
Log Particle Size (mm)
V
olume percent
age
0.01 0.1 1 10 100 1000
8 12 16
4
0
900 rpm
1400 rpm 1500 rpm 1000 rpm 1100 rpm 1200 rpm 1300 rpm
2500 rpm 3000 rpm 3500 rpm 4000 rpm 2000 rpm
0 1000 2000 3000 4000
0 20 40 60 80
100 e
Fig. 3.Results of the pump speed test P5performed on sub-sample aliquot CABRE3a by the
Hydro 2000 MU dispersion unit. (a)Mean diameter value evolution with increasing the pump speed from 600 up to 4000 rpm.(b)Laser obscuration value progression during the same test.
SED
1, 93–141, 2009Laser diffraction psd and granular matter
strength
F. Storti and F. Balsamo
Title Page
Abstract Introduction
Conclusions References
Tables Figures
◭ ◮
◭ ◮
Back Close
Full Screen / Esc
Printer-friendly Version
Interactive Discussion
0 1000 2000 3000 4000
0 500
Pump speed (revolutions per minute)
Mean diameter (
m
m)
0 1000 2000 3000 4000
0 200 400 600 800
Pump speed (revolutions per minute) D50
D90
a
Obscuration (%)
0 1000 2000 3000 4000
0 2 4 6 8 10 12 14 16 18
Pump speed (revolutions per minute) b
Diameter (
m
m)
c 400
300
200
100
Log Particle Size (mm)
0.01 0.1 1 10 100 1000
900 rpm
1400 rpm 1500 rpm 1000 rpm 1100 rpm 1200 rpm 1300 rpm
2500 rpm 3000 rpm 3500 rpm 4000 rpm 2000 rpm
V
olume percent
age
8 12 16
4
0
clay size silt size sand size
V
olume percent
age
Pump speed (rpm) d
e
0 1000 2000 3000 4000
0 20 40 60 80 100
Fig. 4.Results of the pump speed test P1performed on sub-sample aliquot CABRE3b by the
Hydro 2000 MU dispersion unit. (a) Mean diameter value evolution with increasing the pump speed from 600 up to 4000 rpm.(b)Laser obscuration value progression during the same test.
SED
1, 93–141, 2009Laser diffraction psd and granular matter
strength
F. Storti and F. Balsamo
Title Page
Abstract Introduction
Conclusions References
Tables Figures
◭ ◮
◭ ◮
Back Close
Full Screen / Esc
Printer-friendly Version
Interactive Discussion
carbonate breccia
0 500
Pump speed (revolutions per minute)
0 1000 2000 3000 4000
a
400
300
200
100
Mean diameter
(
m
m)
eolian sand
0 500 1000 1500 2000 2500
0 500
Pump speed (revolutions per minute)
b
400
300
200
100
Mean diameter
(
m
m)
400 800 1200 1600 2000
0 100 200 300 400 500
Mean diameter (
m
m)
Pump speed (revolutions per minute)
Hydro S Hydro MU
c
Fig. 5. (a) Pump speed test P5 performed on sub-sample aliquot CABRE3c by the Hydro
SED
1, 93–141, 2009Laser diffraction psd and granular matter
strength
F. Storti and F. Balsamo
Title Page
Abstract Introduction
Conclusions References
Tables Figures
◭ ◮
◭ ◮
Back Close
Full Screen / Esc
Printer-friendly Version
Interactive Discussion
Pump speed (revolutions per minute)
Mean diameter (
m
m)
fineward bias
coarseward
bias
negligible size reduction
significant size reduction
IV
III
II
I
SED
1, 93–141, 2009Laser diffraction psd and granular matter
strength
F. Storti and F. Balsamo
Title Page Abstract Introduction Conclusions References Tables Figures ◭ ◮ ◭ ◮ Back Close
Full Screen / Esc
Printer-friendly Version
Interactive Discussion measurement run number
a
e b
c
measurement run number
0 20 40 60 80 100
0 20 40 60 80 100
measure run number
d
Log Particle Size (mm)
0.01 0.1 1 10 100 1000
6 12 18 0 V olume percent age sand size
0 20 40 60 80 100
Linear Fit:
Y = 0.001588220822 * X + 271.6571448 Average Y = 271.737
Residual sum of squares = 84.7112 Regression sum of squares = 0.210183 R-squared = 0.00247503
0 100 200 300 400 500
0 20 40 60 80 100
0 200 400 600 800 D50 D90 D10
Mean diameter (mm)
Volume percentage
Obscuration (%) Diameter (mm)
16 14
10 8
4
2 Measurement run number
Mode (
m
m)
0 2 4 6 8 10
250 260 270 280 curve 1 curve 100 curve 90 curve 80 curve 70 curve 60 curve 40 curve 30 curve 20 curve 10 curve 50
0 20 40 60 80 100
10 11 12 13 14
measurement run number
Linear fit:
Y = -0.01827272727 * X + 262.8133636 Average Y = 262.704
Residual sum of squares = 4.53526 Regression sum of squares = 0.0367282 R-squared = 0.00803331
Fig. 7. Results of the measure precision test MP25005 performed on sub-sample aliquot
SED
1, 93–141, 2009Laser diffraction psd and granular matter
strength
F. Storti and F. Balsamo
Title Page
Abstract Introduction
Conclusions References
Tables Figures
◭ ◮
◭ ◮
Back Close
Full Screen / Esc
Printer-friendly Version
Interactive Discussion
100
measurement run number
a
0 100 200 300 400 500
0 20 40 60 80
Linear Fit:
Y = -0.3149409241 * X + 220.0308467 Average Y = 204.126
Residual sum of squares = 54629.7 Regression sum of squares = 8264.82 R-squared = 0.131408
Mean diameter (mm)
e b
12 13 14 15
0 20 40 60 80 100
Residual sum of squares = 0.21348 Regression sum of squares = 4.94862 R-squared = 0.958645
Linear Fit:
Y = 0.007706450645 * X + 13.77582424
0 20 40 60 80 100
0 200 400 600 800
D10
D50
D90
c
measurement run number measurement run number
0 20 40 60 80 100
0 20 40 60 80 100
measurement run number
d
Log Particle Size (mm) Volume percentage
0.01 0.1 1 10 100 1000
2 4 6
0
V
olume percent
age
clay size silt size sand size
curve 100
Obscuration (%) Diameter (mm)
1 10 50 100
360 380 400 420 440 460 480 500
Mode (
m
m)
Measurement run number
curve 1
curve 90 curve 80 curve 70 curve 60 curve 40 curve 30 curve 20 curve 10
curve 50
Fig. 8. Results of the measure precision test MP20005 performed on sub-sample aliquot
SED
1, 93–141, 2009Laser diffraction psd and granular matter
strength
F. Storti and F. Balsamo
Title Page Abstract Introduction Conclusions References Tables Figures ◭ ◮ ◭ ◮ Back Close
Full Screen / Esc
Printer-friendly Version
Interactive Discussion
a Linear Fit:
Y = 0.1612023402 * X + 422.9113418 Average Y = 431.052
Residual sum of squares = 92539.3 Regression sum of squares = 2165.3 R-squared = 0.0228637
0 100 200 300 400 500
0 20 40 60 80 100
Mean diameter (
m
m)
f
0 20 40 60 80 100
Linear Fit:
Y = -0.3405654845 * X + 197.785317 Average Y = 180.587
Residual sum of squares = 5835.99 Regression sum of squares = 9664.44 R-squared = 0.623495
d
Obscuration (%)
b
0 20 40 60 80 100
12 13 14 15
Linear Fit
Y = -0.002659105911 * X + 14.45768485 Residual sum of squares = 19.5907 Regression sum of squares = 0.589178 R-squared = 0.0291964
0 20 40 60 80 100
0 200 400 600 800 D90 D50 D10
measure run number
c
Diameter (
m
m)
measure run number measure run number
0 20 40 60 80 100
12 13 14 15
Residual sum of squares = 0.836643 Regression sum of squares = 14.5889 R-squared = 0.945762 Linear Fit:
Y = 0.01323192319 * X + 14.37078788
e
Obscuration (%)
0 20 40 60 80 100
0 200 400 600 800
measure run number
i D90 D50 D10 Diameter ( m m) 1200 rpm 4000 rpm
measure run number measure run number
0 100 200 300 400 500
Mean diameter (
m
m)
SED
1, 93–141, 2009Laser diffraction psd and granular matter
strength
F. Storti and F. Balsamo
Title Page
Abstract Introduction
Conclusions References
Tables Figures
◭ ◮
◭ ◮
Back Close
Full Screen / Esc
Printer-friendly Version
Interactive Discussion
100 measure run number
a
0 100 200 300 400 500
0 20 40 60 80
Mean diameter (mm)
e b
9 10 11 12
0 20 40 60 80 100 0 20 40 60 80 100
0 200 400 600 800
D10 D50
c
measure run number measure run number
0 20 40 60 80 100
0 20 40 60 80 100
measure run number
d
Log Particle Size (mm) Volume percentage
0.01 0.1 1 10 100 1000
2 4 6
0
V
olume percent
age
clay size silt size sand size curve 1
curve 100 curve 90 curve 80 curve 70 curve 60 curve 40 curve 30 curve 20 curve 10
curve 50
Obscuration (%) Diameter (mm)
D90
8 Linear fit:
Y = 0.008490069007 * X + 10.48195152 Residual sum of squares = 0.655079 Regression sum of squares = 6.00617 R-squared = 0.901658
1 10 50 100
300 340 380 420 460 500
Measurement run number
Mode (
m
m)
Regression sum of squares = 41648 R-squared = 0.225649 Linear fit:
Y = 0.7069838524 * X + 193.5241855 Average Y = 229.227
Residual sum of squares = 142922
Fig. 10. Results of the measure precision test MP20001 performed on sub-sample aliquot
SED
1, 93–141, 2009Laser diffraction psd and granular matter
strength
F. Storti and F. Balsamo
Title Page
Abstract Introduction
Conclusions References
Tables Figures
◭ ◮
◭ ◮
Back Close
Full Screen / Esc
Printer-friendly Version
Interactive Discussion
0 10 20 30 40 50
0 100 200 300 400
500 Linear Fit:
Y = -0.4961758944 * X + 206.8466653 Average Y = 194.194
Residual sum of squares = 8106.93 Regression sum of squares = 2563.46 R-squared = 0.24024
0 10 20 30 40 50
13 14 15 16 17 18
Obscuration (%)
0 5 10 15 20 25
0
500 Linear Fit:
Y = -0.4750692308 * X + 176.2197 Average Y = 170.044 Residual sum of squares = 2613.06 Regression sum of squares = 293.398 R-squared = 0.100947
0 5 10 15 20 25
11 12 13 14 15 16
0 1 2 3 4 5 6 7 8 9 10 11 12 13
0
500 Linear Fit:
Y = -1.851313187 * X + 200.3955769 Average Y = 187.436
Residual sum of squares = 494.034 Regression sum of squares = 623.78 R-squared = 0.558035
0 1 2 3 4 5 6 7 8 9 10 1112 13 10
11 12 13 14 15 c
d a
b f
e
measurement run time = 10s
Mean diameter (
m
m)
measurement run time = 20s measurement run time = 40s
measure run number measure run number measure run number
SED
1, 93–141, 2009Laser diffraction psd and granular matter
strength
F. Storti and F. Balsamo
Title Page
Abstract Introduction
Conclusions References
Tables Figures
◭ ◮
◭ ◮
Back Close
Full Screen / Esc
Printer-friendly Version
Interactive Discussion 0
100 200 300 400 500
0
measure number
10 20 30
174.63 mm
151.69 mm
136.69 mm
132.60 mm
Mean diameter (
m
m)
Linear Fit:
Y = -1.413119021 * X + 166.5176782 Average Y = 144.614
Residual sum of squares = 355.134 Regression sum of squares = 4488.04 R-squared = 0.926673
Fig. 12. Results of a measure precision tests performed on sub-sample aliquot CABRE3k