Licenciada em Ciências de Engenharia Biomédica
Study of the influence of σ factors on
the kinetics of RNA production
Dissertação para obtenção do Grau de Mestre em Engenharia Biomédica
Orientador: José Manuel Fonseca, Professor Auxiliar, FCT-UNL
Co-orientador: André Sanches Ribeiro, Professor Assistente, TUT, Finlândia
Júri:
Presidente: Professora Doutora Carla Maria Quintão Pereira
Arguente: Professora Doutora Maria João Gomes Trindade Caseiro
Vogal: Professor Doutor José Manuel Matos Ribeiro da Fonseca
Page |
III
Copyright
Copyright©2011 – Todos os direitos reservados. Cristiana Isabel Martins Ferreira.
Faculdade de Ciências e Tecnologia. Universidade Nova de Lisboa.
A Faculdade de Ciências e Tecnologia e a Universidade Nova de Lisboa têm o direito,
perpétuo e sem limites geográficos, de arquivar e publicar esta dissertação através de
exemplares impressos reproduzidos em papel ou de forma digital, ou por qualquer outro meio
conhecido ou que venha a ser inventado, e de a divulgar através de repositórios científicos e de
admitir a sua cópia e distribuição com objectivos educacionais ou de investigação, não
Page |
V
“Toute réussite déguise une abdication” “Each success hides an abdication”
Page |
VII
Acknowledgements
First I would like to thank my supervisor Prof. Dr. José Manuel Fonseca, who proposed me
to go to Finland to do the study presented in this Master Thesis, and always believed that I
could do it, even when I thought to give up. He always encouraged me to never give up.
To Prof. Dr. André Sanches Ribeiro, who welcomed me in his group and made possible the
development of this Master Thesis providing to me all the tools needed and taught me all the
background needed.
To Huy Tran, who helped me a lot during my stay in Finland, as well as, after in Portugal.
He was always available to explain everything to me and taught me how to use the tools
needed for the analysis of the images and to get the results in the stochastic model here
developed. Thank you for your help, patience and all the knowledge transmitted.
To Jason Lloyd-Price, who provided me the tools needed to do the processing and
segmentation of the time series analyzed. Jason provided me the Jason masking tool that was
used in all of the time series analyzed and the SGNSim Simulator where all the simulations of
the stochastic models were done.
To Vinodh Kandavalli, who provided me the time series data to be analyzed. Without his
work in the laboratory it would have been impossible to get the results. And I have to say
thank you for all the good moments spent together during my stay in Finland.
To Nádia Gonçalves, who helped me even before I arrived in Finland and who was always
present during my five months in Tampere. We spent great moments together that I will never
forget, my friend.
To Samuel Matos for the good moments spent together and for all the help on biology
subjects.
To everyone in the LBD group, who received me very well, who integrated me so well and
who were always available for anything I needed.
To Hanaa Zaki, Carmen Rodríguez, Clémentine Brinon, Ana Domenti, Teresa Bustamante,
João Silva and all the exchange students, for all the great moments spent together and
specially for being my family in Finland. With you I felt that I was at home and I had the
greatest experience in my life. I will never forget you!
To all my friends, from the high school or before, from my journey in Coimbra and from
the last 2 years in Lisbon, I want to show my greatest gratitude for all the good times spent
Cristiana Isabel Martins Ferreira
2014
Page |
VIII
Finally I thank my family, especially my parents and my brother who gave me theopportunity to finish my studies and support my exchange period in Finland, gave me strength
Page |
IX
Resumo
A dinâmica da expressão genética da Escherichia coli é controlada a nível da iniciação da
transcrição, que tem início quando uma holoenzima de RNA polimerase, constituída pelo
núcleo da enzima RNA polimerase e o factor σ, reconhece a sequência promotora de um gene.
Sob diferentes condições, diferentes factores σ são usados. Para além disto, alguns
promotores requerem um factor σ específico, enquanto outros têm menos especificidade. A concentração dos factores σ varia consoante o factor e a fase de crescimento celular.
Dado que a influência dos factores σ na cinética de iniciação da transcrição é
desconhecida, pretende-se neste estudo caracterizar a sua dinâmica, em condições de
crescimento óptimas, por diferentes factores σ sob controlo de dois promotores, PtetA e PBAD,
nas fases exponencial e estacionária de crescimento celular. São utilizadas células mutantes,
sem o factor σ54 ou sem o factor σ38
, e compara-se a dinâmica da iniciação da transcrição com a
das células não mutantes, para os promotores nas duas fases de crescimento celular. As
moléculas de RNA são detectadas logo que produzidas, através do método de marcação
MS2-GFP e são obtidas as distribuições dos intervalos de tempo entre a produção consecutiva de
moléculas de RNA.
Dos resultados obtidos conclui-se que: PtetAnão é afectado pela composição dos factores σ
nas duas fases de crescimento celular em análise, enquanto PBAD o é; a dinâmica da iniciação da
transcrição é influenciada pelo promotor usado; existem 3 passos limitantes na iniciação da
transcrição sob controlo dos dois promotores para as 3 estirpes durante as fases de
crescimento em análise; as distribuições dos intervalos obtidos não são do tipo exponencial; a
produção de RNA é sub-Poissonian; os resultados do modelo estão de acordo com as medidas
in vivo para PtetA enquanto para PBAD existem algumas diferenças.
Palavras-chave: factor σ, iniciação da transcrição, cinética da produção de RNA, simulação
Page |
XI
Abstract
Gene expression dynamics in Escherichia coli is controlled at the transcription initiation
stage, which begins when an RNA polymerase holoenzyme, composed of RNA polymerase core
enzyme and the σ factor, recognizes the promoter sequence of a gene. Under different
conditions, different σ factors are used. Also, some promoters require a specific σ factor, while others have less specificity. The intracellular levels of σ factors vary between σ factors and with
the cell growth phase.
It is still unknown whether different σ factors will lead to differing kinetics of transcription
initiation, thereby, in this study it will be characterized the dynamics of this process by
different σ factors, under optimal growth conditions and under the control of either of two promoters, PtetA and PBAD, during the exponential and stationary growth phases. Mutant cells,
lacking σ54 or σ38 were used and the dynamics of transcription initiation was compared with
wild-type cells, for each of the two promoters and during each of the two growth phases. For
this, RNA molecules are detected as soon as they are produced in each cell, using an MS2-GFP
tagging method, and the distribution of time intervals between consecutive RNA productions
are obtained in each condition.
From the results obtained it is concluded that: PtetA is not affected by the σ factors’
population composition during the two growth cellular phases studied, while PBAD it is ; the
dynamics of transcription initiation is affected by the promoter used; there are 3 rate-limiting
steps in transcription initiation under control of the two promoters for the 3 strains during the
phases analyzed; the distribution of the intervals are not exponential-like; RNA production is
sub-Poissonian; the results of the model developed are in agreement with the observations
from in vivo measurements under control of PtetA,while for PBAD there are some differences.
Page |
XIII
Contents
Acknowledgements ... VII
Resumo ...IX
Abstract ...XI
Contents ...XIII
Figure contents ... XV
Table of contents ... XVII
Abbreviations and symbols ... XIX
1. Introduction ...1
2. State of the art ...5
2.1. Gene expression ...5
2.2. The role of σ factors in transcription ...6
2.3. Models of gene expression dynamics in E. coli ...9
2.4. In vivo measurements of time intervals between consecutive RNA productions ...10
3. Methods and Materials ...13
3.1. Use of fluorescent probes ...13
3.2. Microscopy measurements ...14
3.3. Image analysis...15
3.4. Modelling strategies ...17
3.5. Simulating strategies ...18
4. Results and Discussion ...21
4.1. In vivo measurements of tagged RNA molecules in wild-type cells, in mutant cells lacking σ38and in mutant cells lacking σ54 ...21
4.1.1. Measurements under control of PtetA ...22
4.1.1.1. Measurements during exponential phase ...22
4.1.1.2. Measurements during stationary phase ...24
Cristiana Isabel Martins Ferreira
2014
Page |
XIV
4.1.2.1. Measurements during exponential phase ...25
4.1.2.2. Measurements during stationary phase ...26
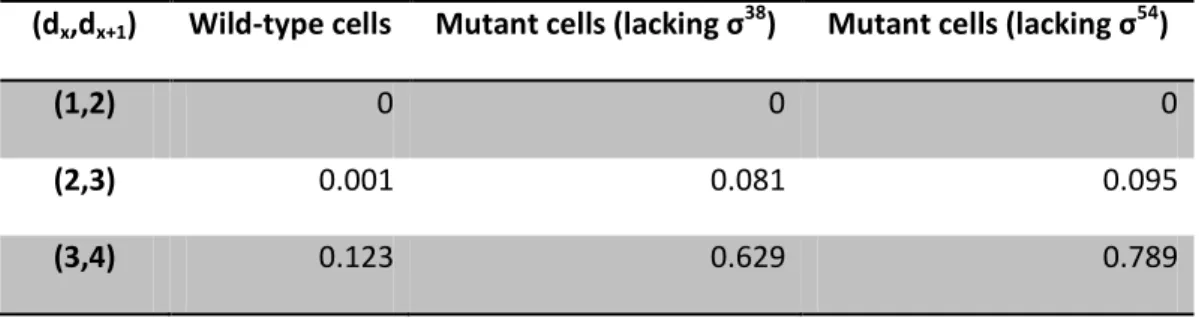
4.2. Inference of steps in transcription initiation ...288
4.3. Model of σ factors ...37
4.3.1. Results of simulations of the model of σ factors ...41
4.3.1.1. Under control of PtetA during exponential phase ...41
4.3.1.2. Under control of PtetA during stationary phase ...44
4.3.1.3. Under the control of PBAD during the exponential phase ...46
4.3.1.4. Under control of PBAD during stationary phase ...488
5. Conclusion ...511
Page |
XV
Figure contents
Figure 2.1: Scheme of the three phases of transcription in Escherichia coli. ... 7
Figure 3.1: Measurement system. Components of the detection system. ... 13
Figure 3.2: Nikon Eclipse (Ti-E, Nikon, Japan) inverted microscope with a 100x Apo TIRF
objective (1.49 NA, oil). ... 14
Figure 3.3: Part of an image taken by confocal microscope of MS2-GFP tagged molecules in
E. coli cells at different stages of its processing. ... 16
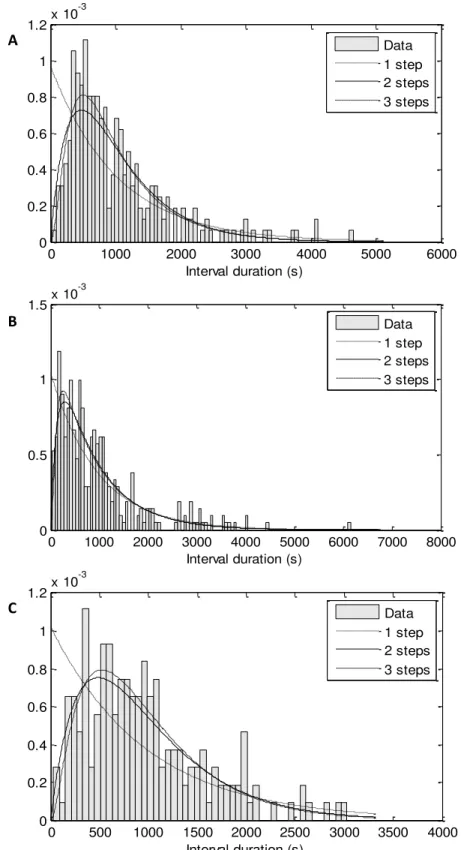
Figure 4.1:Histogram of the measured intervals between consecutive transcription events
under control of PtetA during exponential phase... 29
Figure 4.2: Histogram of the measured intervals between consecutive transcription events
under control of PtetA during stationary phase ... 31
Figure 4.3: Histogram of the measured intervals between consecutive transcription events
under control of PBAD during exponential phase... 33
Figure 4.4: Histogram of the measured intervals between consecutive transcription events
under control of PBAD during stationary phase ... 35
Figure 4.5: Scheme of the model used in our study... 38
Figure 4.6: Distribution of RNA production under control of PtetA during exponential phase.
... 43
Figure 4.7: Distribution of RNA productionunder control of PtetA during stationary phase.45
Figure 4.8: Distribution of RNA production under control of PBAD during exponential
phase.. ... 48
Page |
XVII
Table of contents
Table 4.1: Statistics on the time intervals between consecutive transcription events in
individual cells under control of PtetA during exponential phase. ... 23
Table 4.2: Intracellular levels of σ70, σ54 and σ38 subunits in E.coli W3110 and MC4100. ... 23
Table 4.3: Statistics on the time intervals between consecutive transcription events in
individual cells under control of PtetA during stationary phase. ... 24
Table 4.4: Statistics on the time intervals between consecutive transcription events in
individual cells under control of PBAD during exponential phase. ... 26
Table 4.5: Statistics on the time intervals between consecutive transcription events in
individual cells under control of PBAD during stationary phase. ... 27
Table 4.6: Log-likelihood and duration of the steps of the models with d equal to 1 to 4 steps for three strains under control of PtetA during exponential growth phase. ... 30
Table 4.7: Likelihood-ratio tests. P values between pairs of models for the three strains
under control of PtetA during exponential phase. ... 30
Table 4.8:Log-likelihood and duration of the steps of the models with d equal to 1 to 4
steps for three strains under control of PtetA during exponential growth phase. ... 32
Table 4.9: Likelihood-ratio tests. P values between pairs of models for the three strains
under control of PtetA during stationary phase. ... 32
Table 4.10:Log-likelihood and duration of the steps of the models with d equal to 1 to 4
steps for three strains under control of PBAD during exponential growth phase. ... 34
Table 4.11: Likelihood-ratio tests. P values between pairs of models for the three strains
under control of PBAD during exponential phase. ... 34
Table 4.12:Log-likelihood and duration of the steps of the models with d equal to 1 to 4
steps for three strains under control of PBAD during stationary growth phase. ... 36
Table 4.13: Likelihood-ratio tests. P values between pairs of models for the three strains
under control of PBAD during stationary phase. ... 36
Table 4.14: Results of the stochastic model developed in this study, for the three strains
under control of PtetA during exponential phase... 44
Table 4.15: Results of the stochastic model developed in this study, for the three strains
under control of PtetA during stationary phase. ... 46
Table 4.16: Results of the stochastic model developed in this study, for the three strains
Cristiana Isabel Martins Ferreira
2014
Page |
XVIII
Table 4.17: Results of the stochastic model developed in this study, for the three strainsPage |
XIX
Abbreviations and symbols
µ(s) Mean duration in seconds
σ Sigma factor
σ(s) Standard deviation in seconds
α2ββ’ω Catalytic Subunits of RNA polymerase core enzyme
aTc Anhydrotetracycline
ATP Adenosine triphosphate
cj Reaction probability per time unit
CME Chemical Master Equation
CVS Coefficient of variance over mean square
d Number of steps
DNA Deoxyribonucleic Acid
E Amount of RNA polymerase that is free
Eσ Amount of free holoenzyme
Eσ70 b
Eσ38
b Quantity of holoenzyme that bind nonspecifically to DNA Eσ54
b
Eσ70 Eσ38
Quantity of holoenzyme that bind specifically to DNA in the promoter region
Eσ54
Eb Amount of nonspecifically binding of E to DNA
E. coli Escherichia coli
In vitro Latin for “within glass”
In vivo Latin for “within the living”
kcc Rate constant of the formation of the closed complex
koc Rate constant of the formation of the open complex between RNAp and the
DNA
kp Translation rate constant
Disassociation constant of the specific binding of the holoenzyme to the
promoter
KX Disassociation constant between RNAp core enzyme and the sigma factor
Cristiana Isabel Martins Ferreira
2014
Page |
XX
mRNA Messenger Ribonucleic AcidMS2-GFP MS2 coat protein fused with Green Fluorescence Protein (GFP)
N Number of existing species in the solution
nσ
nσ3 Total number of sigma factors
nσ 4
nEσ Total number of holoenzyme
P Protein
Pr Promoter region
Prc Closed complex of RNA polymerase and the DNA
ro Open complex formation with respective sigma factor associated
PtetA Reporter gene – tet operon
PLac Reporter gene – Lactose operon
r Ribosomes
RNA Ribonucleic Acid
RNAp Ribonucleic Acid Polymerase
RNApσ RNA polymerase holoenzyme
SSA Stochastic Simulation Algorithm
T Temperature
UV Ultraviolet
Page |
1
1. Introduction
Every living organism ensures its survival by following the cell dogma (Crick, 1970), which is
scripted in the chromosome inherited from its parent(s) and passed down to its children.
Following this dogma, the pieces of information stored in the chromosome, known as genes,
specific sequences of nucleotides encoded in the deoxyribonucleic acid (DNA), are expressed
through two complex processes. The first process, known as transcription, is a crucial step in
gene expression and its regulation. The second process is translation. In transcription, an
enzyme called RNA polymerase (RNAp) reads the DNA and makes a complementary messenger
RNA strand (mRNA). Upon released, mRNA is either modified or immediately translated by
ribosome to create proteins, which are the functional units in cells (Alberts et al., 2008).
Gene expression has a stochastic nature, which causes cell to cell variability in the number
of RNA and protein molecules in cells of a genetically identical population (Süel, Garcia-Ojalvo,
Liberman, & Elowitz, 2006). Single-cell experiments have shown that there are fluctuations in
rate of production of RNA and proteins over time (Elowitz, Levine, Siggia, & Swain, 2002).
The bacterium Escherichia coli (E. coli) has been used as a model organism in studies
related to transcription. In vitro studies established that transcription initiation is a multi-step
process (Buc & McClure, 1985) which takes a long time and plays an important role in
determining the mean and noise in mRNA. The duration of each step vary between promoters
(Lutz, Lozinski, Ellinger, & Bujard, 2001), also with temperature (Buc & McClure, 1985) and
with the concentration of Mg2+ and others metabolites (Suh, Leirmo, Record, & Jr., 1992),
among other reasons. It is known that transcription is a stochastic process (H H McAdams &
Arkin, 1999) and recent in vivo studies showed that it is a sub-Poissonian process (Kandhavelu
et al., 2011) under weak and medium induction levels. The same studies revealed that
transcription initiation in vivo has at least two elementary steps.
Recent studies also recognized that in transcription, there is a sensoring factor that
enables specific binding of RNA polymerase to gene promoters. This factor, σ (sigma) factor, is
a single subunit of the transcription machinery of E. coli that acts as a sensor guiding RNA
polymerase to specific binding sites on promoters (Gruber & Gross, 2003). It is known that,
under different conditions, different σ factors are used in transcription. Also, while some promoters appear to require a specific σ factor to initiate transcription, others have less σ
factor specificity (Gruber & Gross, 2003). Additionally, some σ factors transcribe genes
Cristiana Isabel Martins Ferreira
2014
Page |
2
genes expressed during stationary growth phase (Loewen & Hengge-aronis, 1994). So far, itremains unclear how different σ factors affect the transcription dynamics, particularly the
kinetics of the multi-step transcription initiation process. Therefore, it would be of interest to
study how the dynamics of transcription differ between mutant cells (lacking one specific σ
factor) and wild-type cells (containing all σ factors), when under the same, optimal growth
conditions. This test will be performed here in two promoters, PtetA and PBAD, in order to infer if
existing differences in RNA production kinetics between mutant cells are solely σ factor
-dependent or are also promoter--dependent. Because the number of σ factors is cell phase
-dependent, this test will be performed here for two growth phases of E. coli, more specifically
it will be compared the results from wild-type cells and mutant cells during the exponential
phase with the ones from the same strains during the stationary phase, for both promoters
used.
In order to study the role of σ factors on the dynamics of transcription, a data analysis of
the measurements was performed and a stochastic model of σ factors was developed. The
model simulates the biological processes at the single event level using a modified version of
the Stochastic Simulation Algorithm (SSA) (Gillespie, 1977) that allows delays in reaction
events and aims at the prediction of the statistics of transcription, which would not be feasible
using deterministic kinetics. As mentioned before, the transcription by the RNAp takes some
time, thereby the model developed from a delayed stochastic model of transcription that
contains time delays in reaction events (A. Ribeiro, Zhu, & Kauffman, 2006). The duration of
transcription initiation, in this model, is modelled following a Gaussian distribution, to take
into account the rate-limiting steps inherent to this process (McClure, 1980). The model
developed also includes explicitly the steps of transcription initiation, as the formation of the
closed complex and its isomerization, which leads to the open complex formation (Buc &
McClure, 1985) and the elongation process. It contains also the reactions of the translation
process, like the formation of proteins and the time needed for that.
Once the different σ factors in study are included in our model, it is possible to simulate all
the different strains of E. coli as well as the two different growth phases in study, changing the
values of parameters like the intracellular level of the holoenzymes and dissociation constants.
The results of these simulations are compared with the results from the in vivo measurements.
For the simulations under control of PtetA the results are in agreement with the results of the in
vivo measurements. On the other hand, for PBAD although the distribution of RNA production
follows the same trend, the values of the mean production intervals are different from the in
Page |
3
This study is derived from a study conducted in the Laboratory of Biosystem Dynamics(LBD), Department of Signal Processing, Tampere University of Technology, Finland. Here, the
author acquired knowledge about the models of gene expression and σ factors, and became
familiar with the simulation and data analysis tools. We performed the data analysis from the
measurements and the author assisted in the development of the first stochastic model of
transcription that includes σ factors.
The results should offer insights on the prospective of modifying the array of σ factors in E.
coli mutants, whether to restrict the environments it can live in, or to expand them to more
extreme conditions, beneficial to the synthetic biology field or the pharmaceutical industry.
This thesis contains 5 Chapters besides the first, introductory one. Chapter 2 gives an
introduction of the main topics of this thesis: gene expression, the role of σ in transcription,
the models of gene expression dynamics in E. coli and the in vivo measurements of time
intervals between consecutive RNA productions. In chapter 3 we present all the methodology
used in this study, such as, the use of fluorescence probes to obtain bright fluorescent spots,
how we do the measurements with the microscope, how we analyse the images obtained in
the microscope and how we extract the results. Chapter 4 contains the results and their
discussion, of the in vivo measurements in wild-type cells, in mutant cells lacking σ54 and in
mutant cell lacking σ38
during exponential phase and during stationary phase under control of
PtetA or under control of PBAD. This chapter also contains the results obtained when we fitted
the model with the empirical results. The discussion of the results of the simulations made for
the three strains under control of the two promoters during the two growth phases are also
presented in this chapter. The conclusion of this work is presented in Chapter 5 as well as the
perspectives on future developments. Finally, Chapter 6 contains all the references used in this
Page |
5
2. State of the art
In this chapter we present a theoretical description of the main concepts needed to
understand the study performed in this thesis. First, we give insights on gene expression.
Second, we describe in greater detail the first step of this process, transcription, in E. coli and
the role of σ factors in this process. Then, we explain how the gene expression dynamics in E.
coli is modeled and how the in vivo measurements of time intervals between consecutive RNA
productions are made. These last two subchapters are important since they describe how to
obtain the results with the analysis performed in the present study.
2.1. Gene expression
All living cells contain their genetic instructions stored in genes, which are specific
sequences of nucleotides encoded in DNA. These instructions are copied and transmitted from
mother to daughter cells. The flow of these genetic instructions within a cell is explained by
the central dogma of molecular biology (Crick, 1970), which states that “DNA
(Deoxyribonucleic Acid) makes RNA (Ribonucleic Acid) which makes protein”. The molecule of
DNA contains the genetic code which is inherited from the mother cell. The process by which
the genetic code is used by cells to direct protein synthesis is denominated by gene expression.
This process consists of two main steps: transcription and translation.
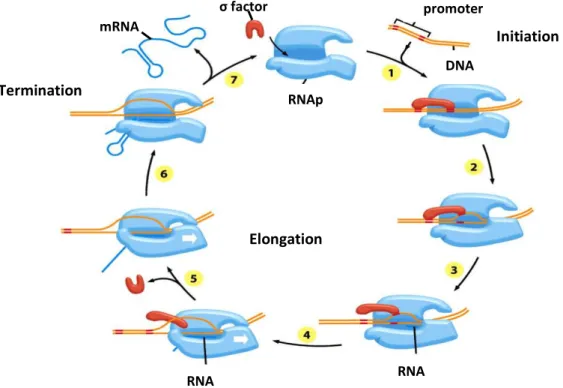
Prokaryotes transcription occurs in three phases known as initiation, elongation and
termination. In transcription initiation, transcription factors bind to RNA polymerase (RNAp)
allowing the RNAp to be tightly bound in the promoter region in DNA. Once the RNAp is
attached to the DNA strain, a small portion of the DNA double helix is opened and unwound, in
order to expose the bases on each DNA strand. Only one strand of DNA is used as a template
at any one time for the synthesis of a messenger RNA (mRNA) molecule. The nucleotide
sequence of the RNA chain is determined like in DNA replication, which means determined by
the complementary base-pairing between incoming nucleotides and the DNA template. The
incoming ribonucleotides are covalently linked to the growing RNA chain when there is
complementarity of its bases. When the RNAp binds the terminator region, transcription is
over and it is released the DNA template and the completed messenger RNA (mRNA) molecule.
Upon released, mRNA is either modified or immediately translated by ribosome to create
Cristiana Isabel Martins Ferreira
2014
Page |
6
2.2. The role of
σ
factors in transcription
RNA polymerase (RNAp), the central enzyme of gene expression in bacteria, consists of five
protein subunits, two α subunits, together with single copies of the two largest (β and β’) and
the smallest (ω) subunits, and it is responsible for the polymerization or synthesis of RNA. This
core enzyme (RNAp) is able to copy DNA into RNA but transcription is not initiated at the
correct site in a gene, which means that it does not recognize the promoter region. It is
required that the core enzyme binds to the transcription initiation factor, σ factor, which is a
single regulatory subunit that recognizes the signal on the DNA strand and indicates that the
RNA polymerase should initiate the synthesis of the RNA. When the σ factor binds the core
enzyme, it is formed the RNA polymerase holoenzyme (RNApσ) (reaction 2.1), increasing the
affinity to various promoters and decreasing the affinity of the RNAp for nonspecific DNA. It is
known that, when reaction 2.1 occurs, the σ factor provides most of the determinants for
promoter recognition and DNA melting (Gruber & Gross, 2003).
RNAp σ RNApσ (2.1)
Prokaryotes transcription (Figure 2.1) occurs in three phases: initiation, elongation and
termination. Transcription initiation involves a reversible binding of RNAp holoenzyme to a
special DNA sequence at the beginning of the gene, known as the promoter region (Pr). This
step is referred as closed complex formation (Prc) because the DNA is not unwound (reaction
2.2) (Figure 2.1 – step 1). The closed complex is a relatively weak, unstable formation.
RNApσ r rc (2.2)
The next step is the unwound of approximately 10 bases of DNA around the initiation site
in order to form an open complex (Figure 2.1 – step 2), much stronger than the closed
complex, in which one strand of DNA is a template for transcription. When few nucleotides are
added, the σ factor is released stochastically from the RNA polymerase (Figure 2.1 – step 3),
which then leaves the promoter and moves along the template strand of DNA to continue the
elongation of the growing RNA chain (Figure 2.1 – step 4, 5 and 6). It was found that
sometimes the σ factor remains on RNA polymerase until termination, which can be used as an
elongation regulator (Mooney, Darst, & Landick, 2005).
During elongation, the RNAp unwinds the template strand of DNA ahead of it and rewinds
Page |
7
of the RNA continues until the RNAp encounters a termination signal, at which pointtranscription stops and the messenger RNA (mRNA) is released from the RNAp and this
enzyme is dissociated from its DNA strand template (reaction 2.3) (Figure 2.1 – step 7).
rc r RNAp σ mRNA (2.3)
In Escherichia coli, there are seven different σ subunits that can participate in the
transcription of a specific set of genes (Ishihama, 2000). These σ factors, that possess different promoter-recognition properties, can be generally divided into two groups: the σ70family of σ
factors and the σ54group. The first group includes σ factors that share structural similarities
and the ones in the second group have differences in sequence, promoter architecture and
σ factor
Initiation
Elongation Termination
mRNA
RNA RNA
σ factor
RNAp
DNA promoter
Cristiana Isabel Martins Ferreira
2014
Page |
8
function from the σ70 family (Wösten, 1998). Despite the overall similarity in their structures,the σ70
family can recognize different classes of promoters (Gruber & Gross, 2003). Some
promoters can only be activated by a specific σ factor, while others can be activated by any σ factor. imilarly, some σ factors appear to become activated at specific temperature ranges.
There is also anti-σ factors that inhibit the function of theσ factors (Ishihama, 2000). Under
stress, its repertoire of σ factor is altered along with the cells’ transcriptional program (Gruber & Gross, 2003). It is known that in response to growth transitions and environmental
conditions there is changes in the intracellular levels of each individual σ factor (Jishage, Iwata,
Ueda, & Ishihama, 1996).
E. coli contains six σ factors of the σ70
family, σ70 (encoded by RpoD), σ38 (RpoS), σ32 (RpoH),
σ28
(RpoF), σ24 (RpoE) and σFecI, each participating in the transcription of a specific set of genes
(Ishihama, 2000). σ70 is the house-keeping σ factor that can transcribe most genes expressed
during the exponential phase. The intracellular concentration of σ70 subunit remains at a
constant level in the transition from the exponential growth phase to the stationary phase,
although the levels of core enzyme subunits decrease concomitantly with the stopping of cell
growth. σ38
is the master regulator of the general stress response, transcribing more than 70
genes that confer resistance against such diverse insults as oxidative stress, UV-radiation, heat
shock, hyperosmolarity, acidic pH and ethanol. Due to the generality of the response, σ38
plays
both a preventative and a combative role (Gruber & Gross, 2003). The level of σ38 increases
when the cell enters the stationary growth phase and plays an important role in the stress
response during these translation to that phase (Jishage & Ishihama, 1995). σ32 and σ24can
transcribe the heat shock genes. σ28
is involved in transcription of flagellar formation and
chemotaxis genes. σFecI
is used in the ferric citrate transport system and has extracytoplasmic
functions.
σ54
transcribe genes which are activated by a deficiency of nitrogen (Merrick, 1993) and
some other stress response genes (Shingler, 1996).It is known that the amount of σ54 present
in the cell is approximately one tenth of the amount of σ70
, during exponential and stationary
phase growth (Jishage et al., 1996). ome differences between this group of σ factors and the
σ70family are: σ54
is able to bind promoter DNA even in the absence of core RNA polymerase
and σ54
requires an additional ATP-dependent activation event provided by transcriptional
Page |
9
2.3. Models of gene expression dynamics in
E. coli
The dynamics of the two main steps of gene expression, transcription and translation, has
two main properties. First, these are both stochastic processes (H H McAdams & Arkin, 1999).
Second, both of these processes are multi-stepped (Buc & McClure, 1985). That is, they
possess more than one event that is ‘rate-limiting’ and thereby affects the durations of the intervals between consecutive productions of the product molecules. The modelling strategy
here presented was first proposed in (A. Ribeiro et al., 2006), and aims to capture both of
these features. For that, the simulation of these models is performed using the ‘ tochastic
imulation Algorithm’ (SSA) (Gillespie, 1977) which is a Monte Carlo method that simulates numerically the time evolution of well stirred reaction systems. The time goes forward in
discrete steps. A reaction is explicitly executed in each step and the effect on the number of
each molecule is settled. Since these models do not explicitly include σ factors and due to the
aim of this thesis, it is required the development of a new model containing the σ factors in
study of E. coli. With that, it is possible to study its influence on the kinetics of RNA production.
The model of σ factors developed in this thesis as well as its results, are presented in chapter
4, in section 4.3..
Transcription is usually modelled as a 2-step process (reaction 2.4). The first step is named
closed complex formation and consists on the finding of the transcription start site by an RNA
polymerase (here modelled with constant rate kcc)(Figure 2.1). The second step is named open
complex formation and consists on the formation of the open complex between the RNA
polymerase and the DNA (here modelled with rate constant koc)(Figure 2.1). Since these are
the two major rate-limiting steps of transcription under optimal conditions (Buc & McClure,
1985), in general, the outcome of this step includes not only a free promoter region and RNAp
but also a complete messenger RNA molecule (Figure 2.1):
r RNAp k→ cc rRNAp k→ oc r RNAp mRNA (2.4)
As the gene exists at single-copy level, each transcription event only produces one
molecule of messenger RNA.
Cristiana Isabel Martins Ferreira
2014
Page |
10
Reaction 2.5 is used to model, as a single-step process, the translation of mRNA byribosomes (r) in order to produce proteins (P), where kp is the translation rate constant. The
values of the reaction rates vary between promoters and determine the dynamics of RNA
production.
Studies have shown that the lifespan of mRNA is usually limited to minutes, while proteins
have a much longer half-life (from several minutes to hours). The lifespan of mRNA can be
fitted with an exponential distribution (Bernstein, Khodursky, Lin, Lin-Chao, & Cohen, 2002).
The concentration of the proteins decreases due to cell elongation and division. The decaying
process of these molecules can be modelled by the first order reactions listed below (reactions
2.6 and 2.7) (Greive & von Hippel, 2005).
mRNA d→ M (2. )
→d (2. )
2.4.
In vivo
measurements of time intervals between consecutive RNA
productions
Due to the development of new techniques for tagging RNA molecules with MS2 coat
protein fused with Green Fluorescence Protein (GFP), MS2-GFP proteins (Peabody,
1993)(Peabody, 1997) (Fusco et al., 2003)(Golding & Cox, 2004) and using time-lapse
fluorescence microscopy, it is possible to detect RNA molecules soon after completion or even
while elongating (Golding & Cox, 2004), once the GFP produces a green light when a source of
UV hits the protein and a green spot appears when a molecule of RNA is formed.
Before these new techniques appeared, the knowledge of RNA transcription and its
dynamics came from population studies or in vitro studies with purified components ((Harada
et al., 1999) (Shaevitz, Abbondanzieri, Landick, & Block, 2003)(Skinner, Baumann, Quinn,
Molloy, & Hoggett, 2004)). However, once these studies were not a cell-to-cell study, it was
difficult to understand some processes which occurs at a single cell level. Thus, in our study the
technique developed by Golding et al. (Golding, Paulsson, Zawilski, & Cox, 2005) will be used.
With this technique, the cell-to-cell diversity in RNA numbers of a population at a given
moment in time was firstly quantified (Golding et al., 2005).
The in vivo kinetics of RNA production at single cell level can also be measured with this
Page |
11
(Golding et al., 2005) if the time when the first RNA molecules appear is registered, it ispossible to measure the time interval between consecutive transcription events and calculate
the mean duration as well as the variability of these intervals (Kandhavelu et al., 2011, 2012;
Muthukrishnan et al., 2012). It is suspected that the cell-to-cell diversity in RNA and protein
numbers in populations of sister cells (Kandhavelu et al., 2011; Paulsson, 2004; A. Ribeiro et
al., 2006) comes from the expected noise of the underlying chemical processes in gene
expression (Peccoud & Ycart, 1995). If the noise in transcription is estimated by measuring the
intervals between transcription events (Kandhavelu et al., 2011) instead of by measuring
cell-to-cell diversity in RNA numbers, the results are more reliable once that in the latter method
the noise is influenced by several phenomena other than transcription, like errors in RNA
partitioning in cell division or noise in RNA degradation (Huh & Paulsson, 2011a, 2011b;
Page |
13
3. Methods and Materials
In this chapter the methodology used in our experiments is explained. First the laboratory
procedure will be introduced, explaining how the fluorescent cells are obtained and how the
microscope is set to allow obtaining the images for analysis using custom software written in
Matlab. The results of this analysis will be compared with the ones from the model developed
in the aim of this study. The modeling and the simulating strategies used for the model here
developed are explained in the last two subchapters of this chapter.
3.1. Use of fluorescent probes
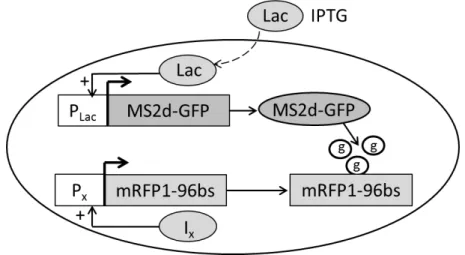
The mRNA detection system contains two elements: a reporter gene on a medium copy
plasmid and a target gene on a single-copy-F-plasmid. In figure 3.1 the mRNA detection system
used in our study is described. The reporter gene (PLac) codes for a fluorescence protein, GFP,
fused to a dimmer of the RNA bacteriophage MS2 coat protein (MS2d). The target gene codes
for the target RNA, which contains several MS2-binding sites (Golding et al., 2005). As
mentioned before, we will used different promoters to analyse its influence in RNA production
and due to this, we represent the promoter in Figure 3.1 with PX, where X can be tetA or BAD.
Figure 3.1: Measurement system. Components of the detection system. The reporter gene (PLac)
controls the expression of the tagging protein (MS2d-GFP) and is inducible by Lac. The target construct is on a single-copy F-plasmid and its expression is controlled by the promoter PX whose activity is
regulated by specific inducer (IX). The spots (represented with ‘g’ in the figure) appear when M 2d-GFP
Cristiana Isabel Martins Ferreira
2014
Page |
14
A bright fluorescent spot (Figure 3.1, represented by ‘g’) appears in the cell when multipleMS2d-GFP fusion proteins bind to a newly transcribed RNA.
For our measurements, cells with both MS2d-GFP and transcript target plasmids will be
grown overnight in Miller LB medium at 37°C with aeration, diluted into fresh medium to
maintain exponential growth until reaching an optical density of OD ≈ . for both promoters during exponential phase and an optical density of OD ≈ .4 for both promoters
during stationary phase and supplemented by antibiotics according to the specific plasmids.
The reporter plasmids will be induced with IPTG (1.0 mM%) during 45 minutes at 37 °C. The
target Ptet, single-copy-F-plasmid, will be induced with anhydrotetracycline (aTc) (15 ng) during
5 minutes at the same temperature (37 °C). The target PBAD, also a single-copy-F-plasmid, will
be induced with arabinose (Ara) (0.2%) during 5 minutes at 37 °C.
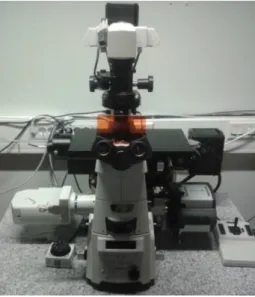
3.2. Microscopy measurements
Microscopy measurements are done as in (Kandhavelu et al., 2011). After the induction of
target RNA, the cells are placed on a microscopic slide between a cover slip and 3% LB-agarose
gel pad set, and visualized by fluorescence microscopy, using a Nikon Eclipse inverted C1
confocal laser-scanning system with a 100x Apo TIRF objective.
Figure 3.2: Nikon Eclipse (Ti-E, Nikon, Japan) inverted microscope with a 100x Apo TIRF objective (1.49 NA, oil). MS2-GFP fluorescence was measured with this microscope by a C2 confocal laser-scanning system with a 488 nm laser (Melles-Griot) and a 1 /3 nm detection filter, using a pixel dwell
Page |
15
In order to measure GFP fluorescence, we use a C2 confocal laser-scanning system with 488nm laser and a 515/30 nm detection filter. For each slide, images of cells are captured using C1
with Nikon software EZ-C2 (Figure 3.2), approximately 5 min after induction, one image each
30 seconds, for approximately 2 hours. Microscopy will be performed in a temperature
chamber to maintain the temperature constant.
3.3. Image analysis
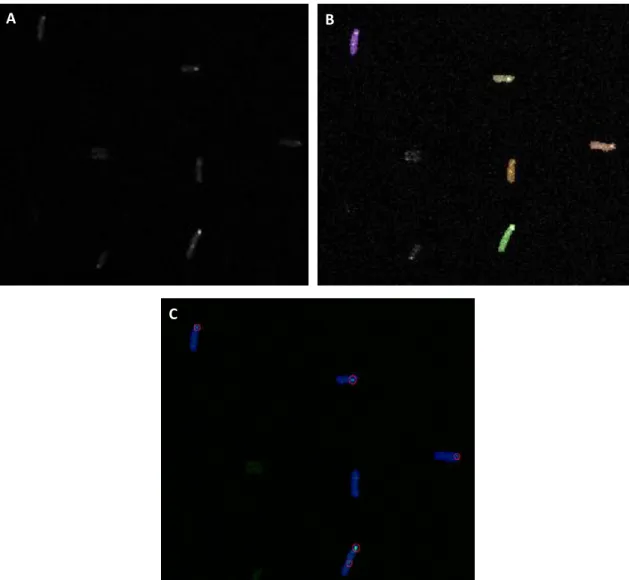
Once the images of the cells are acquired by confocal microscopy (Figure 3.3), we will
perform their analysis as in (Kandhavelu et al., 2012). In particular, the image analysis will be
done semi-automatically using custom software written in Matlab.
The methods used follow (Kandhavelu et al., 2011). However, although all the similarities
with the methods used in (Kandhavelu et al., 2011), the masking process is different. Each
image is divided in three classes: background, cell border and cell region. Clumped cells are
identified based on their size and edge information using an iterative cell segmentation
process. A threshold is defined based on cell size and cells whose size goes beyond this
threshold are discarded. RNA spots are segmented using a Kernel Density Estimation method
(Ruusuvuori et al., 2010).
Figure 3.3 represents an example of the three stages of the processing. It is chosen one
region of one original image (Figure 3.3 – A) taken with the microscope of our laboratory
(Figure 3.2) and it is shown this region during the masking process (Figure 3.3 – B) and during
the spot detection (Figure 3.3 – C). During the masking process (Figure 3.3 – B) it is necessary
to do manual corrections of the masking made automatically. Only when all the frames of the
time series are well masked, the spot detection is made (Figure 3.3 – C). After this processing,
the individual cells are shown in blue and the spots are shown in green. Then, the number of
RNA molecules in each spot is quantified by normalizing the MS2d-GFP-RNA spot intensity
distribution, which means, dividing a spot’s intensity by the intensity of the first peak in the
Cristiana Isabel Martins Ferreira
2014
Page |
16
The masking process (Figure 3.3) is made for each individual image independently, for atime-series measurement. The overall distribution of spot intensity is generated and obtained
from all cells at each time point. This allows obtaining the number of RNA molecules in each
cell at each time point. It is possible to determine when a new RNA appears and the time
between the appearance of consecutive RNA molecules in individual cells when counting the
number of RNAs in each cell at each moment. From that, the distributions of intervals between
consecutive transcription events in a cell population subject to the same level of induction and
temperature can be generated (Kandhavelu et al., 2011).
A B
C
Page |
17
3.4. Modelling strategies
The chemical reactions used to represent elementary biological processes in cells could be
mathematically described using models, enabling the simulation and inspection of the
chemical system dynamics. These models can be either deterministic or stochastic.
The deterministic model is particularly useful when assessing processes with a population
approach. However, it does not work properly when modelling gene expression due to the low
copy number of RNA molecules (Taniguchi et al., 2010) and the stochastic nature of chemical
reactions (Harley H. McAdams & Arkin, 1999) involved in this process. In this way, we employ a
stochastic model of gene expression. Stochasticity in gene expression affects the functioning of
cells and organisms and contributes to the phenotypic diversity in a genetically homogeneous
population (Harley H. McAdams & Arkin, 1997; Ozbudak, Thattai, Kurtser, Grossman, & van
Oudenaarden, 2002; Samoilov, Arkin, & Ross, 2002).
The kinetics of molecules in a solution is studied under the following assumptions:
the system is well-stirred and of constant volume V, which requires that the
spatial distribution of all species’ molecules is uniform within the volume V and
the position of molecules is independent of each other;
the system is in thermal equilibrium at constant temperature T, which means that
every molecule in the solution moves independently;
reactions occur only when two or more molecules collide, while most collisions do
not lead to reactions.
The dynamics of a solution with N species from X1 to XN and M reactions can be inspected
by the analysis of the jth reaction, described as follow:
∑
→ ∑
In this reaction, the reaction constant cj is the “reaction probability per time unit” and
indicates how likely the reaction jth is to happen given the reactants' molecule number at a
given time. sij and rij indicates how many molecules of the substance Xi are
consumed/produced via the jth reaction. For stochastic models there is the propensity function
(equation 3.2) which is equivalent to the rate equation of the deterministic models.
aj(x) dt specifies the probability for the j th
reaction to occur in the infinitesimal time
window [t, t + dt). h(x) indicates the number of possible reactant combinations of a reaction at
Cristiana Isabel Martins Ferreira
2014
Page |
18
specific time depends only on the current state, the system dynamics can be considered as aMarkov process, where each reaction marks a change in state. Using the stochastic model, we
can calculate the time for the change in the state to occur and the possible next state.
3.5. Simulating strategies
In order to find the solution for the stochastic models, the first order Chemical Master
Equation (CME) (Gillespie, 1977), a mathematical method used to describe the time-evolution
of probability density at fixed rates was originally employed. The most serious issues of CME
are when it is applied to complex systems involving a large number of substances and when
the probability densities are calculated on the continuous time scale. In those cases, the
solutions are usually intractable. To address these problems, the Stochastic Simulation
Algorithm (SSA) (Gillespie, 1977) was developed. The SSA is a Monte Carlo method that
simulates numerically the time evolution of well stirred reaction systems. Time goes forward in
each discrete step where a reaction is explicitly executed and the effect on the number of each
molecule is settled. The time of the next reaction is determined using probability distributions.
SSA takes into account the fact that the time evolution of a spatially homogeneous chemical
system is a stochastic process. This algorithm numerically simulates the Markov process using
random sampling.
Equation (3.3) is the basis for the realization of SSA.
In equation (3.3) is the normalized flux of the reaction, jth and indicates how likely
the reaction is to occur and represents the exponential distribution of the
probability of one reaction occurs at time t τ. The time τ for the next reaction to occur can be
calculated for any state x in the system’s state space, if the distribution is
inverted as in equation (3.4). Two uniform random numbers r1 and r2 are used to do the
inverse transformation. j can be obtained from equation (3.5).
Page |
19
∑ ∑
SSA consists of the following steps:
1. Initialize the step n=0 with time and state ;
2. Calculate and from the current state ;
3. Generate r1 and r2 from a uniform distribution [0,1);
4. Calculate τ from equation (3.4) and from equation (3.5);
5. Perform reaction Rj with the update of tn+1 = tn + τ and xn+1 = xn + Sj, where Sj is the
stoichiometric vector indicating the changes in molecule numbers after one reaction jth
occurs;
6. Set n=n+1 and return to step 2.
SSA is implemented in SGNSim (A. S. Ribeiro & Lloyd-Price, 2007). SGNSim models a wide
range of systems of chemically interacting elements. The extended version of SGNSim, SGNS2
(Lloyd-Price et al., 2012) was the first simulator to include multi-delayed events, dynamic
compartments and molecule partitioning schemes in division. Thereby, in our study, the SGNS2
Page |
21
4. Results and Discussion
This chapter contains the results obtained in our study of potential differences in dynamics
of transcription between mutant cells and wild-type cells under the same, optimal growth
conditions. This study was performed under control of PtetA and PBAD, to determine if existing
differences in RNA production kinetics between mutant cells are solely σ factor-dependent or
are also promoter-dependent.
Firstly, we present the results of the in vivo measurements of tagged RNA molecules made
in wild-type cells and in mutant cells lacking σ38 or lacking σ54. As mentioned before, these
experiments were done under control of two different promoters during exponential growth
phase and stationary growth phase. For all the experiments, assuming that transcription
initiation consists of a sequence of exponentially distributed steps, it is inferred the number of
steps as well as the duration of the underlying rate-limiting steps. The modeling strategy used
to model the dynamics of transcription and the results of its simulations to explore the
dynamics of gene expression under stress conditions are presented below. The discussion of
the results obtained is done for all the measurements.
4.1.
In vivo
measurements of tagged RNA molecules in wild-type cells, in
mutant cells lacking σ
38and in mutant cells lacking σ
54When a bacterium is inoculated in a medium, it passes through four growth phases. The
first growth phase is known as lag phase and corresponds to the time required for the
adaptation to the new environment. In this phase its growth rate is 0. The second growth
phase is the exponential phase, where the mass of the cell increases in an exponential manner.
When the nutrients became exhaust or when the toxic metabolic products accumulate or
inhibit growth, the cell enters in another phase, known as stationary phase. At this point, the
growth ceases completely and the death of the bacteria starts. The last phase, denominated by
death phase, is where there is a progressive death of the cell. Our measurements were done
during the exponential and stationary phase, because there are σ factors responsible for
transcribing genes expressed during exponential phase and other σ factors responsible for
transcribing genes expressed during the stationary phase (Jishage et al., 1996). The results and
Cristiana Isabel Martins Ferreira
2014
Page |
22
4.1.1. Measurements under control of PtetA
These in vivo studies of the kinetics of transcription initiation were performed under
control of PtetA for three different E. coli strains. For the in vivo measurements of wild-type
cells, which means containing all the σ factors presents in E. coli, it is used the E. coli strain BW25113 (Baba et al., 2006). The E. coli strain JW5437 (Baba et al., 2006) is used in in vivo
measurements of mutant cells lacking σ38 and the E. coli strain JW3169 (Baba et al., 2006) is
used in mutant cells lacking σ54
.
Once the sequence of the target gene contains 96 binding sites for the MS2 coat protein,
the reporter proteins (MS2-GFP) can bind to the target RNA and a fluorescent spot is formed.
These fluorescent spots can be observed in fluorescence microscopy images. The cells are
placed under the confocal microscope during 2 hours with a measurement done at each 30
seconds. Analysis of these images is performed by a semi-automatic method (Kandhavelu et
al., 2011) which does the detection and the masking of the cells from the images obtained
(Figure 3.3).
As mentioned before, the experiments are made during the exponential and the stationary
growth phases. Bellow, the results for the measurements made during these two phases, as
well as, its discussion is addressed.
4.1.1.1. Measurements during exponential phase
From the images we extracted the number of cells as well as the number of intervals
between productions of consecutive RNA molecules detected in individual cells (Number of
samples). Table 4.1 shows these values for the three strains of E. coli analysed during the
exponential growth phase, as well as the mean duration to complete a transcription initiation
event once initiated (µ(s)), the standard deviation (σ(s)) of this interval duration. Both values
are represented in seconds, and the variance over mean square value (CVS) obtained per each
experiment. The CVS value is an important value once it indicates how spread the probability
density of the protein number it is and how noisy the regulation of one gene to another it is.
However, this value will be discussed later on the sub-chapter of the inference of step in
transcription initiation.
tudies have shown that some σ factors are responsible for the transcription of genes that
Page |
23
genes that are expressed during the stationary phase (Jishage et al., 1996). It is also knownthat the intracellular concentration of σ70 as well as of σ54
is the same in the exponential
growth phase and in the stationary phase, when analysing one strain of E. coli (Table 4.2)
(Jishage et al., 1996). On the other hand, the intracellular concentration of σ38 is approximately
zero during the exponential growth phase, but it increases significantly in the stationary phase
(Table 4.2) (Jishage et al., 1996).
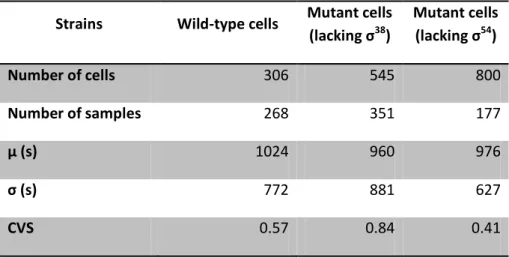
Table 4.1:Statistics on the time intervals between consecutive transcription events in individual cells under control of PtetA during exponential phase. Number of cells analyzed, number of intervals between
production of consecutive RNA molecules detected in individual cells (Number of samples), mean duration of production intervals in seconds (µ(s)), the standard deviation (σ(s)) and the square of the
coefficient of variation (CVS) of the interval duration obtained in our experiment with wild-type cells and with mutant cells lacking σ38 and σ54 during exponential phase under control of PtetA.
Strains Wild-type cells Mutant cells
(lacking σ38
)
Mutant cells
(lacking σ54
)
Number of cells 306 545 800
Number of samples 268 351 177
µ (s) 1024 960 976
σ (s) 772 881 627
CVS 0.57 0.84 0.41
Table 4.2: Intracellular levels of σ70, σ54 and σ38 subunits in E.coli W3110 and MC4100. This information is obtained from (Jishage et al., 1996).
σ
subunit
Level (fmol/µg) of σ subunit in strain:
W3110 MC4100
Exponential
phase
Stationary
phase
Exponential
phase
Stationary
phase
σ70 150-170 150-170 50-80 50-80
σ54
20-30 20-30 3-5 3-5
σ38
Cristiana Isabel Martins Ferreira
2014
Page |
24
From the data in Table 4.1, we observe that the time needed to complete a transcriptioninitiation event once initiated is approximately the same for all the three strains analysed.
From Table 4.2 it is possible to observe that the intracellular level of σ54 is not negligible
(around one tenth of the intracellular level of the total amount of σ70 ((Jishage et al., 1996)) )
during exponential phase. Thus, it was expected a difference between kinetics of transcription
initiation of wild-type cells and of mutant cells lacking this σ factors. Once this difference is not
verified, it is possible to conclude that PtetA does not contain any consensus for σ 54
binding.
For the mean production interval of mutant cells lacking σ38
comparing with wild-type
results was not expected any difference, since during exponential phase the intracellular level
of this σfactor is null (Table 4.2). From these results, it is possible to conclude that PtetA is not affected by σ factor composition during the exponential phase.
4.1.1.2. Measurements during stationary phase
Since during stationary phase the intracellular level of σ38 is not negligible, it was important
to evaluate the dynamics of transcription initiation when this σ factor is lacking when
compared with the dynamics of transcription of wild-type cells.
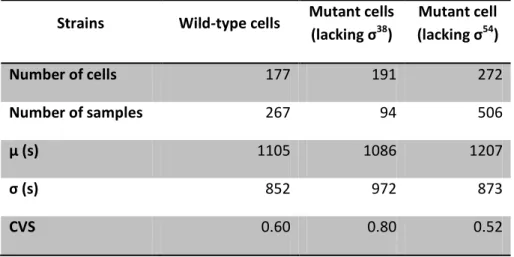
Table 4.3: Statistics on the time intervals between consecutive transcription events in individual cells under control of PtetA during stationary phase. Number of cells analyzed, number of intervals between production of consecutive RNA molecules detected in individual cells (Number of samples), mean duration of production intervals in seconds (µ(s)), the standard deviation (σ(s)) and the square of the
coefficient of variation (CVS) of the interval duration obtained in our experiment with wild-type cells and with mutant cells lacking σ38 and σ54 during stationary growth phase under control of PtetA.
Strains Wild-type cells Mutant cells
(lacking σ38)
Mutant cell
(lacking σ54
)
Number of cells 177 191 272
Number of samples 267 94 506
µ (s) 1105 1086 1207
σ (s) 852 972 873
Page |
25
Thereby the measurements during the stationary growth phase are made using the samestrains and procedure of the measurements during exponential growth phase. Further, the
same parameters are extracted for the three strains analysed, as the number of cells analysed,
the number of samples, the mean duration of production intervals, the standard deviation and
the CVS of the interval duration. These values are represented in Table 4.3.
Comparing between strains and from Table 4.3, it is possible to observe that the time
needed to complete a transcription initiation event in wild-type cells is approximately the
same than for the measurements made during exponential phase (Table 4.1). The transcription
time for mutant cells lacking σ38 becomes longer, indicating an increase in the proportion of σ38
in wild-type strain (Table4.2). On the other hand, the mean production interval of mutant
lacking σ54 is higher when comparing with the same measurements during exponential phase.
With the data from Tables 4.1 and 4.3 it is possible to infer that the transcription kinetics
under control of PtetA, during exponential and stationary phases, is not affected by σ factor
composition, due the dynamics of transcription almost does not change between strains
during exponential and stationary growth phase.
4.1.2. Measurements under control of PBAD
The measurements under control of PBAD were made following the same procedure used
for PtetA, differing only on the inducer used to induce the target. In these measurements, the E.
coli strains under study are the same than the strains used under control of PtetA. This
sub-chapter contains the results and the discussion of the results of these measurements during
exponential phase and stationary phase, similar to the previous.
4.1.2.1. Measurements during exponential phase
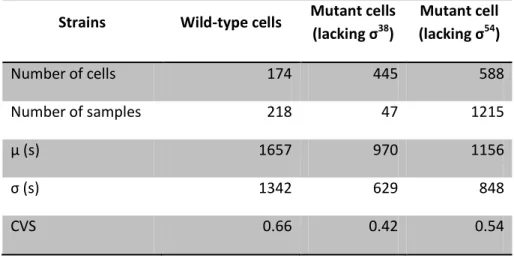
Likewise as the analysis made for the measurements under control of PtetA, Table 4.4
presents the values obtained for the experiments made during exponential phase under
control of PBAD. As mentioned before and from Table 4.2, it is known that the intracellular level
of σ38
during exponential phase is not significant. Therefore, it was not expected a marked