ESTIMATION OF HEAT DISSIPATION IN BROILER CHICKENS DURING THE FIRST TWO WEEKS OF LIFE
Jéssica Fantin Ruvio1, Leonardo Schassi2, Handrey Borges Araújo1, Flávio Alves Damasceno2 & Tadayuki Yanagi Junior2
1Universidade Federal de Mato Grosso. E-mail: [email protected], [email protected] 2Universidade Federal de Lavras. E-mail: [email protected], [email protected],
ABSTRACT
The objective of this work was to evaluate the heat dissipated in broilers during the first two weeks of life and to estimate with infrared thermography the loss of sensible heat from birds. The environmental conditions were pre-established in wind tunnels using the automatic monitoring and control system, where only air temperature values were varied during each experimental week. Thus, the heat exchanges through convection and radiation of each animal were calculated by means of equations for the first and second week of life, and the temperature of the broilers was obtained by means of thermographic images. Has been found that the surface temperatures of the birds are correlated with air temperature and that they suffer greater heat dissipation when below their thermal comfort zone and as the bird develops.
Keywords: Poultry, surface temperature, thermography
ESTIMATIVA DE CALOR DISSIPADO EM FRANGOS DE CORTE DURANTE AS DUAS PRIMEIRAS SEMANAS DE VIDA
RESUMO
Objetivou-se com o presente trabalho avaliar o calor dissipado em frangos de corte, durante as duas primeiras semanas de vida, e estimar a perda de calor sensível das aves com auxílio da termografia infravermelho. As condições ambientais foram pré-estabelecidas em túneis de vento utilizando o sistema automático de monitoramento e controle, onde variou-se apenas a temperatura do ar durante cada semana experimental. Desta forma, foram calculadas por meio de equações, as trocas de calor por convecção e radiação de cada animal para a primeira e segunda semana de vida, sendo a temperatura superficial dos frangos obtida por meio de imagens termográficas. Verificou-se que as temperaturas superficiais das aves
estão associadas à temperatura do ar sofrendo maior dissipação de calor quando abaixo da sua zona de conforto térmico e à medida que a ave se desenvolve.
Palavras-chave: Avicultura, temperatura superficial, termografia
INTRODUCTION
The Brazilian poultry industry is currently the third largest in the world, surpassed only by the United States and China (FAO, 2015). Poultry production has become, in recent years, one of the main Brazilian agricultural activities.
The enormous growth in world and national poultry production has occurred thanks to the evolution in the areas of genetics, animal nutrition, management and well-being, including the importance of the environment of the animal to its thermal comfort range and also the increasing attention in the search for good animal welfare conditions (CASSUCE et al., 2012).
Thus, the heat generated by the metabolic processes and received from the environment must be dissipated from the bird's body into the environment in order for homeothermia to be maintained. These heat exchanges are performed with minimum energy expenditure in a thermoneutral environment. However, when subjected to high temperatures, birds have more difficulty maintaining their body temperature. Increased respiratory rate is therefore the most efficient thermoregulatory mechanism for dissipating body heat under heat stress conditions. Thus, the energy requirement for keeping birds exposed to different ambient temperatures can be altered (OLIVEIRA NETO et al., 2000).
In poultry, ideal productivity is achieved when birds in a certain range of effective environmental temperature maintain constant body temperature, with minimal effort of thermoregulatory mechanisms. When this situation occurs, it can be said that the bird is in the so-called thermal comfort zone, where there is no sensation of cold or heat and the performance of the bird in any activity is optimized (CURTIS, 1983; BAÊTA & SOUZA, 2012).
According to Nascimento et al. (2014), an efficient way to quantify sensible heat dissipation is through thermographic analysis. The thermographic analysis is used to map the surface temperature of the animals, it being a non-invasive measurement also providing an estimate of heat loss. In this way, this technique has been used to calculate the heat and mass transfers between the birds and the surrounding environment, for the design of evaporative ventilation and cooling systems, as well as inference about bird management (AERTS et al., 2003; YAHAV et al., 2005).
There are several studies that use thermographic analysis to evaluate the heat dissipated by animals (ALVES et al., 2012; NASCIMENTO et al., 2014). However, few studies have been conducted to quantify body heat dissipation in broilers in the first weeks of life.
The objective of this work was to evaluate the heat dissipated in broilers during the first two weeks of life and to estimate with infrared thermography the loss of sensible heat from birds.
MATERIALS AND METHODS Air-conditioned wind tunnel
This research was developed in three experimental units of air-conditioned wind tunnels installed in the Environment Laboratory located in the Engineering Department of the Federal University of Lavras, Minas Gerais, Brazil.
The air-conditioned wind tunnels were placed inside an experimental room (5.6 x 5.7 x 3.0 m) which was equipped with two air conditioning systems with power of 18,000 BTUs each, for the maintenance of basic air temperature values for the desired environment.
In the experimental room three wind tunnels (0.8 x 5.0 m) were installed in order to obtain different thermal conditions to which the birds could be submitted (Figure 1). The tunnels were built in steel sheets and PVC pipes, with partial air recirculation system. Each tunnel had two electric heaters with power of 600 W and two humidifiers with average fog capacity of 300 ml h-1, distributed in two stages of operation. Each heating stage could be expanded up to 1800 W of power. The first stage allowed the air temperature (tair) and relative humidity (RH) inside each tunnel reached a minimum reference
value and the second stage was used to make a more accurate control of these variables. Further details on wind tunnels can be observed in Schiassi et al. (2014).
The air velocity (VAIR) was manually controlled by means of potentiometers connected to exhaust
fans of 0.4 m in diameter and a maximum flow of 4,200 m3h-1. The area for animals was covered with plastic film with high transparency so that digital and thermographic images could be captured. This area had a cage with dimensions of 0.6 x 0.4 x 0.4 m, surrounded with wire mesh, to contain the animals.
In each air-conditioned wind tunnel, 15 birds were housed in the first week of life. Later, due to the housing density, this number was reduced to 12 in the second week (Figure 2). Thus, 45 birds of the Cobb lineage were created, divided into lots of mixed sex, throughout the experimental period. Each bird was identified by number through a tag attached to the foot. The ration and water were available ad
(a)
(b)
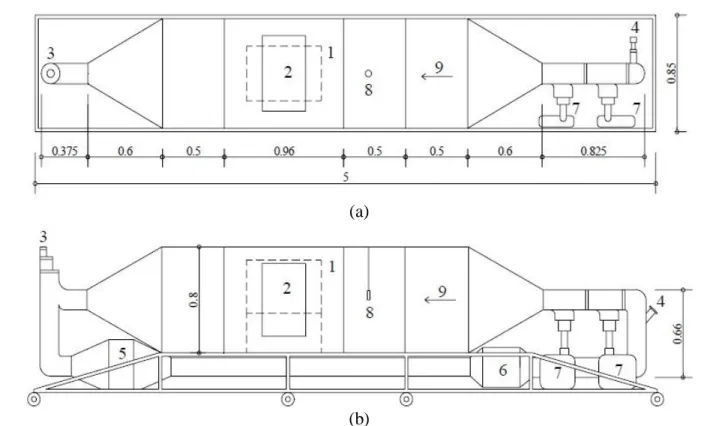
Figure 1. Schematic drawings of the top (a) and lateral (b) views of the wind tunnel used in this study.
Unit of the dimension: cm. Label: 1 - Cage for the animals. 2 - Windows with plastic film. 3 - Air entrance. 4 - Air exit. 5 – Fans. 6 – Heaters. 7 – Nebulizers. 8 – Sensors. 9 - Air flow direction.
(a) (b)
Figure 2. (a) Position of the birds inside the cage and (b) thermographic image of the interior of the cage.
Measurement, instrumentation and control
A system of acquisition and control of climatic variables was installed in the laboratory, consisting of a datalogger (CR1000, Campbell Scientific), a channel multiplexer (AM16 / 32B, Campbell
Scientific), a relay controller (SDM-CD16AC, Campbell Scientific), Sensors / registers for tair and RH
(HMP45C, Vaisala), water temperature measurement sensors (108, Vaisala), T-type thermocouples for indoor air temperature measurement (troom) and outer (text) of the experimental room, and the black bulb
temperature was measured by T-type thermocouples installed in black globes. The electric heaters and humidifiers were connected to the datalogger through 16 channels of the relay controller connected to electromagnetic relays, as can be observed in Schiassi et al. (2014).
The air velocity values inside the wind tunnels were measured by means of a digital propeller anemometer. For that, the air velocity values were obtained in 15 points distributed over an imaginary mesh located in the transversal section of the cage and displaced 0.15 m in the longitudinal direction. In this case, three replicates were performed for each point, totaling 45 measurement points for each wind tunnel.
To obtain the thermographic images a Fluke thermographic camera, model TI55FT20/54/7.5, 2% reading precision was used. The images were collected daily at 2 pm.
The values of tair, RH, troom and text, for each pre-set air temperature value, were measured and
recorded at 10-second intervals for a period of 24 hours each day.
In this study, three combinations of air temperature were used for the first and second week of life of the animals, as can be observed in Table 1. On the other hand, relative humidity and air velocity were maintained with constant values 60 ± 1% and 0.2 ± 0.1 m s-1, respectively, throughout the experimental period.
Table 1. Weekly average air temperature, with its respective standard deviation, within the
air-conditioned wind tunnels, corresponding to each treatment.
Treatments Air temperature (°C)
Week 1 Week 2
T24-24 24.2 ± 0.02 24.2 ± 0.05
T27-27 27.2 ± 0.03 27.2 ± 0.04
T30-30 30.1 ± 0.13 30.0 ± 0.04
According to Baêta & Souza (2012) and Cassuce et al. (2012), for birds to express their maximum productive potential, each week of life, they need an ideal temperature (Table 2). Thus, the air temperature combinations tested in this study were used to observe the bird’s responses to cold discomfort.
Table 2. Comfort temperature ranges for broilers at different ages.
Age (Week) Temperature range (°C)
1st 34-32
2nd 32-28
Source: Adapted from Baêta & Souza (2012) and Cassuce et al. (2012).
The losses of sensible heat by radiation (QR) and by convection (QC) from birds to the
environment were calculated using the set of equations proposed by Curtis (1972), Yahav et al. (2004), Brecht et al. (2005) and Baêta & Souza (2012):
T C R Q = Q Q (1) C s s ar Q = A h (T -T ) (2) 4 4 R s air Q = e (T -T ) (3) AR h = 0.336. 4.184 (1.46+ V 100) (4) Where:
QT is the total heat, (W m-2);
As is the surface area of the bird (m2);
h is the heat transfer coefficient, (W m-2 K-1);
Ts is the average surface temperature of birds (°C);
Tair is the air temperature (°C);
e is the emissivity, equal to 0.95; and
σ is the Stefan-Boltzman constant, equal to 5.6691×10⁻⁸.
The surface area of birds (As) was calculated through Equation 5, proposed by Silva et al. (2009):
0.74 s
A = 3.86 MC (5)
In which:
MC is the body mass of the birds (kg).
Experimental design
The experiment was installed following the randomized block design (DBC), with a factorial scheme 3 x 2, that is, 3 treatments and 2 weeks. Measurements were performed for two weeks, and each week was considered as a block. Four replicates were performed for each treatment. For the analysis of
variance and linear regression, the evaluated parameters were processed by the statistical program Sisvar 4.6 (FERREIRA, 2000), being developed by the Federal University of Lavras.
RESULTS AND DISCUSSION
Table 3 shows the mean values and standard deviations compared by the Tukey test (5%) of the surface temperature (Ts) for the different treatments tested during each week of collection.
Table 3. Mean values and standard deviations of the surface temperature (Ts) for the different treatments
during the two weeks of collection.
Week Ts (°C)
T24-24 T27-27 T30-30
1 33.4 ± 0.2 a 32.5 ± 0.3 a 35.4 ± 0.4 a
2 35.1 ± 0.4 b 34.8 ± 0.5 b 35.6 ± 0.4 a
The averages followed by equal letters, in the same column, do not differ statistically from each other, by Tukey test, at 5% probability.
There was a significant difference (p <0.05) in Ts between the first two weeks in treatments T 24-24 and T27-27 (Table 1). According to the analysis of the thermographic images, the mean Ts of the birds
rose with increasing age in both treatments. However, in the treatment T30-30, there was no significant
difference (p> 0.05) in Ts between the weeks evaluated. During the first week of life, the feathering in the birds is smaller, the environment becomes favorable to the losses of heat, thus causing a greater reduction in Ts.
Nascimento et al. (2014) evaluating the temperature of the birds with 7, 14, 21 and 28 days of life in air-conditioned and conventional ventilation systems, observed that Ts values were equal to 34.1 ºC and 35.2 ºC, respectively. According to these authors, the mean Ts of the birds is directly associated with the surface temperatures of the installation (surface temperatures of the side curtain, lining and bed).
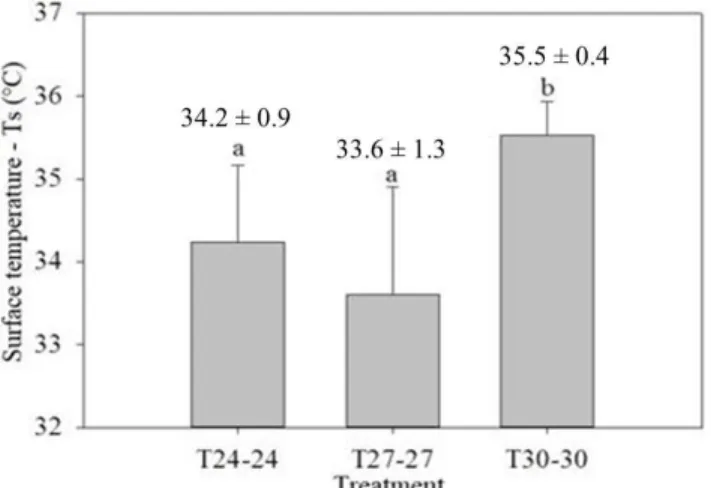
In Figure 3, we can observe the mean values and standard deviations of Ts in each treatment tested. The mean Ts in treatment T30-30 was considered statistically higher in relation to the other
treatments tested. In this case, the birds were in conditions of thermal stress, according to the limits recommended by Tinôco (2004), Baêta & Souza (2012) and Cassuce et al. (2012).
A number of studies have been conducted correlating the air temperature with the surface temperature of the birds (DAHLKE et al., 2005; YAHAV et al., 2005; WELKER et al., 2008), although the results obtained in the present study show that the association is higher with installation surface
temperatures. According to Nascimento et al. (2014), the association between the surface temperatures of the facility and the birds ratifies the importance of the use of building materials with low thermal conductivity that help to maintain the thermal insulation of the external temperatures and decrease the heat transfer from the installation to the birds.
Figure 3. Mean values and standard deviations of the surface temperature for each treatment tested. The
averages followed by the same letters do not differ statistically from each other, by the Tukey test, at 5% probability.
The convective heat dissipation (Qc) in all treatments tested was higher in the second week of life of the birds (Table 4). The difference in Qc dissipation between the first two weeks was greater than 50% in all tested situations. The estimation of Qc dissipation for the treatment T24-24 was statistically
higher (Tukey test, 5%), as can be observed in Figure 4.
According to Yahav et al. (2005), the air velocity is the parameter that most influences the heat dissipation by convection. It is important to maximize sensible heat exchanges through the difference between the bird's surface temperature and the air temperature. In this case, when this difference is minimal, the birds increase the heat transfer by evaporation with the aid of panting that has a high energy cost and a fall in animal performance (MENEGALI et al., 2009).
Table 4. Mean values and standard deviations for estimation of heat dissipation by convection (Qc) for
the different treatments during the two weeks of collection.
Week Qc (W m
-2)
T24-24 T27-27 T30-30
1 1.32 ± 0.08 a 0.70 ± 0.07 a 0.70 ± 0.08 a
2 3.07 ± 0.31 b 1.72 ± 0.25 b 1.47 ± 0.27 b
The averages followed by equal letters, in the same column, do not differ statistically from each other, by Tukey test, at 5% probability.
Figure 4. Mean values and standard deviations of convection heat dissipation estimation (QC) for each treatment tested. The averages followed by the same letters do not differ statistically from each other, by the Tukey test, at 5% probability.
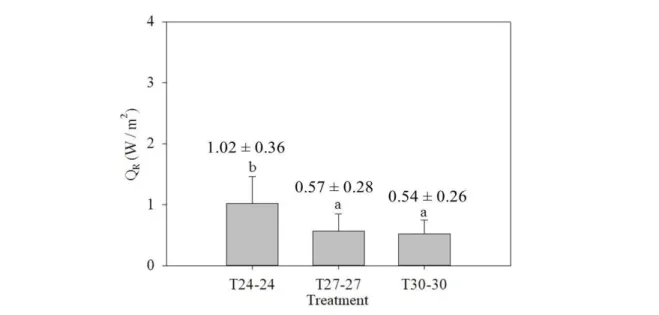
In Table 5, the heat dissipation by radiation (QR) during the first two weeks of bird life can be
observed. Based on the results, it is observed that in the second week of life of the birds the dissipation of QR was statistically higher in all treatments tested. This fact may be justified by the greater metabolic
activity in the first compared to the second week of life.
There was a significant difference between the environmental temperatures tested for radiation-sensitive heat dissipation (p <0.05), as can be observed in Figure 5. It was verified that the birds dissipated more heat with temperature of 24°C compared to the other temperatures tested (27 and 30 °C).
Alves et al. (2012) evaluating Ts and QR of broilers with different sex and lineage, with 35 days
of age, fed with different lipid sources, observed, using thermographic images, lower Ts and lower dissipation of QR in the female birds of the Cobb line.
Table 5. Mean values and standard deviations for estimation of heat dissipation by radiation (QR) for the different treatments during the two weeks of collection.
Week QR (W m
-2)
T24-24 T27-27 T30-30
1 0.62 ± 0.04 a 0.32 ± 0.03 a 0.35 ± 0.04 a
2 1.42 ± 0.15 b 0.82 ± 0.12 b 0.72 ± 0.13 b
The averages followed by equal letters, in the same column, do not differ statistically from each other, by Tukey test, at 5% probability.
Figure 5. Mean values and standard deviations for estimation of convection heat dissipation (QR) for each treatment tested. The averages followed by the same letters do not differ statistically from each other, by the Tukey test, at 5% probability.
In the present study, it was observed that the dissipation of QT occurred in a differentiated manner
during the two weeks evaluated (Table 6). During the second week of bird life, QT was statistically higher
in all treatments tested (Tukey test, 5%).
The more accurate heat loss estimation makes it possible to estimate the value of metabolizable energy that is required by the bird in the first days of life, as a function of the time of transfer from birth (SHINDER et al., 2007). The study of thermography becomes important, since the most efficient forms of heat exchange of birds with the environment in the first weeks of life correspond to the sensitive forms (radiation, conduction and convection). As adults, sensitive forms of heat transfer are no longer efficient, making the form of latent heat transfer (evaporation) more efficient (YAHAV et al., 2004). These results may allow for a more accurate strategy for feeding and sizing the ventilation system in the first weeks. During the breeding phase, the chicks will need supplemental heat. However, as growth progresses, birds are increasingly beginning to contribute to their heating as well as that of the shed with the heat they generate.
Heat production in broilers is relatively high because the growth rate is based on the feed consumption with inherent efficiency of use of metabolizable energy (ME), which can reach 40%. This indicates that 60% of ME consumption will be lost by heat (FERNANDES et al., 2014).
The explanations of the authors contribute with the results obtained, justifying the increase of the heat exchange in the second week (Table 6). However, the significant difference in heat loss at
temperatures of 27 and 30 °C during the first week can be explained by the greater proximity of the thermal comfort zone and the smaller surface area of the animals during the first week.
Table 6. Mean values and standard deviations for estimation of heat dissipation by radiation (QR) for the different treatments during the two weeks of collection.
Week QT (W m
-2)
T24-24 T27-27 T30-30
1 1.96 ± 0.11 a 1.03 ± 0.10 a 1.03 ± 0.12 a 2 4.51 ± 0.46 b 2.56 ± 0.36 b 2.21 ± 0.39 b The averages followed by equal letters, in the same column, do not differ statistically from each other, by Tukey test, at 5% probability.
Considering the ambient temperature of each treatment tested, the mean value of sensible heat dissipation can be observed in Figure 6.
Figure 6. Mean values and standard deviations of total heat dissipation estimation (QT) for each treatment tested. The averages followed by the same letters do not differ statistically from each other, by the Tukey test, at 5% probability.
According to Nääs et al. (2010), the sensitive exchanges occur through convection losses and radiation, which depend on a temperature differential between the body surface of the birds and the ambient temperature, that is, the larger the difference, the more efficient these exchanges will be. The different body regions of the birds can contribute in a different way to the body heat balance, making the classification possible of regions considered conservative vasoregulatory ones, such as the regions
covered by feathers and the regions without feathers, that have greater contribution in the exchanges between the body surface and the surrounding environment (SHINDER et al., 2007).
CONCLUSIONS
Based on the results, it was found that:
a) The surface temperatures of the birds are associated with the air temperature and they suffer greater heat dissipation when subjected to temperatures below their thermal comfort zone and also as growth develops.
b) The use of thermographic images allowed greater accuracy in the measurements of sensible heat dissipation in broilers, showing variations during the first two weeks of life, as well as in the different environmental conditions evaluated.
ACKNOWLEDGEMENTS
The authors thank the Coordination for Improvement of Higher Education Personnel (CAPES), National Council for Scientific and Technological Development (CNPq) and Foundation for Research Support of the State of Minas Gerais (FAPEMIG) for the financial support of the project.
REFERENCES
AERTS, M.; WATHES, C.M.; BERCKMANS, D. 2003. Dynamic data-based modelling of heat production and growth of broiler chickens: development of an integrated management system.
Biosystems Engineering, London, v. 84, n. 3, p. 257-66.
ALVES, F.M.S; FELIX, G.A.; ALMEIDA PAZ, I.C.L.; NÄÄS, I.A ; SOUZA, G.M; CALDARA, F.R.; GARCIA, R.G. 2012. Impact of exposure to cold on layer production. Revista Brasileira de Ciência
Avícola, v. 14, p. 223-226.
BAÊTA, F. C.; SOUZA, C.F. Ambiência em edificações rurais – conforto animal. 2012. Editora: UFV, Viçosa - MG, 265p.
BRECHT, A. VAN; HENS, H.; LEMAIRE, J. L.; AERTS, J. M.; DEGRAEVE, P.; BERCKMANS, D. 2005. Quantification of the heat exchange of chicken eggs. Poultry Science, Champaign, v.84, p.353-361.
CASSUCE, D. C.; TINOCO, I. F. F.; BAETA, F. C.; ZOLNIER, S.; CECON, P. R.; VIEIRA, M. F. A. 2012. Atualização das temperaturas de conforto térmico para frangos de corte de até 21 dias de idade.
Engenharia Agrícola, Jaboticabal, v.33, p.28-36.
CURTIS, S. E. 1983. Environmental management in animal agriculture. Ames: State University Press. Iowa, 409 p.
DAHLKE, F.; GONZALES, E.; GADELHA, A. C.; MAIORKA, A.; BORGES, S.A.; ROSA, P.S.; FARIA FILHO, D.E.; FURLAN, R.L. 2005. Feathering, triodothyronine and thyroxine plasma levels and body temperature of two broiler lines raised under different temperatures. Ciência Rural, Santa Maria, v.35, p.664-670.
FAO. 2015. Central de informações de aves e suinos – Carne de Frango/Quantidade Produzida. Available at: <www.cnpsa.embrapa.br/cias/dados/graficos.php>. Access in: 25/01/2015.
FERNANDES, G. A.; FERNANDES, F. F. D.; MOUSQUER, C. J. 2014. Nutrição de frangos de corte adequada a regiões de clima quente – Revisão. Revista Eletrônica Nutritime, Viçosa, v. 11, n. 01, p. 3045 – 3069.
FERREIRA, D F. 2000. SISVAR - Sistema de análise estatística para dados balanceados. Lavras: UFLA/DEX.
MENEGALI, I.; TINÔCO, I. F. F.; BAÊTA, F. C.; CECON, P. R.; GUIMARÃES, M. C. C; CORDEIRO, M. B. 2009. Ambiente térmico e concentração de gases em instalações para frangos de corte no período de aquecimento. Revista Brasileira de Engenharia Agrícola e Ambiental, Campina Grande, v.13, p.984-990.
NÄÄS, I.A.; ROMANINI, C.E.B.R.; NEVES, D.P.; NASCIMENTO, G.R.; VERCELLINO, 273 R.A. 2010. Broiler surface temperature distribution of 42 day old chickens. Scientia Agricola, Piracicaba, v. 67, p.497-502.
NASCIMENTO, G. R.; NÄÄS, I. A., BARACHO, M. S.; PEREIRA, D. F.; NEVES, D. P. 2014. Termografia infravermelho na estimativa de conforto térmico de frangos de corte. Revista Brasileira
de Engenharia Agrícola e Ambiental, Campina Grande, v.18, n.6, p.658–663.
OLIVEIRA NETO, A. R.; OLIVEIRA, R. F. M.; DONZELE, J. L.; ROSTAGNO, H. S.; FERREIRA, R. A.; MAXIMIANO, H. C.; GASPARINO, E. 2000. Efeito da Temperatura Ambiente sobre o Desempenho e Características de Carcaça de Frangos de Corte Alimentados com Dieta Controlada e Dois Níveis de Energia Metabolizável. Revista Brasileira de Zootecnia, Viçosa, v.29, n.1, p.183-190.
SCHIASSI, L.; YANAGI JUNIOR, T.; ABREU, L. H. P.; REIS, G. M.; DAMASCENO, F. A.; SILVA, G. C. A. E.; CAMPOS, A. T. 2014. Laboratory Proposal for Studies on Poultry Environment.
International Journal of Engineering Research and Applications (IJERA), New Delhi, v.4,
p.65-74.
SHINDER, D.; RUSAL, M.; TANNY, J.; DRUYAN, S.; YAHAV, S. 2007. Thermoregulatory responses of chicks (Gallus domesticus) to low ambient temperatures at an early age. Poultry Science, Champaign, v.86, n.10, p.2200-2209.
SILVA, E.; YANAGI JUNIOR, T.; BRAGA JÚNIOR, R.A.; LOPES, M.A.; DAMASCENO, F. A.; SILVA, G. C. A. 2009. Desenvolvimento e validação de um modelo matemático para o cálculo da área superficial de frangos de corte. Engenharia Agrícola, Jaboticabal, v.29, p.1-7.
TINÔCO, I. F. F. 2004. A granja de frangos de corte. In: Mendes, A. A.; Nããs, I. A.; Macari, M. (ed.) Produção de frangos de corte. Campinas: FACTA, p.55-84.
WELKER, J. S.; ROSA, A. P.; MOURA, D. J.; MACHADO, L. P.; CATELAN, F.; UTTPATEL, R. 2008. Temperatura corporal de frangos de corte em diferentes sistemas de climatização. Revista
Brasileira de Zootecnia, Viçosa, v.37, p.1463-1467.
YAHAV, S.; SHINDER, D.; TANNY, J.; COHEN, S. 2005. Sensible heat loss: the broiler's paradox.
World's Poultry Science Journal, Beekbergen, v.61, n.3, p.419-434.
YAHAV S, STRASCHNOW A, LUGER D, SHINDER D, TANNY J., COHEN S. 2004. Ventilation, sensible heat loss, broiler energy, and water balance under harsh environmental conditions. Poultry
Science, Champaign, v. 83, p.253–258.
Received in November 26, 2015 Accepted in August 24, 2017