E-COMMERCE: ONLINE CONSUMER, SERVICE FAILURES
AND THE SERVICE PARADOX
Maria Rita Estrela Maggioli Esteves Pereira
Dissertation submitted as partial requirement for the conferral of
Master in International Management
Supervisor:
Prof. Eurico Brilhante Dias, Ph.D., Assistant Professor, ISCTE Business School, Management Department
Co-supervisor:
Prof. Catarina Marques, Ph.D., Assistant Professor, ISCTE Business School, Quantitative Methods Department
- Spine –
E
-COO
MERC
E
:
ON
L
IN
E
CO
N
S
U
MER,
SE
RV
ICE
FA
IL
U
RE
S A
ND
RE
C
OV
E
RI
E
S
A
N
D
T
H
E
S
E
R
V
ICE
P
A
R
A
D
O
X
M
a
ri
a
R
it
a
E
stre
la
M
a
g
g
io
li
E
ste
v
es
P
erei
ra
i
Acknowledgements
This dissertation was hardly the work of one person alone, as I would not have had been here if it weren’t for a number of special people.
First and foremost, I thank professor Eurico Dias, supervisor of this study, for accepting the challenge to guide me and for providing me the knowledge and support necessary to move on.
I would also like to thank professor Catarina Marques, co-supervisor of this study, for her unconditional and extraordinary help. Thank you for your all-around availability and for the constant knowledge and words of wisdom.
To my family and friends, I send you my love for the constant worry and interest in helping. You gave me the energy to pursue my goal. A special thank you to my brothers and grandmothers for being the light of my day and the joy in my life.
Daniel, thank you for being my everyday support. Thank you for being as present as you were and for helping me in the hours of need. I’m grateful for you, your love, your patience, your kindness and your endless wisdom.
Finally, I dedicate this work to my parents. The reason for everything I am today and the pillars of my being. To my father, thank you for pushing me literaly every single day, for never letting me give up and for always knowing what is best for me. To my mother, thank you for trusting and believing in my abilities, for showing support when I need the most and for the much needed consolation. It is because of both of you that this work is done and that I have come such a long way. I am forever grateful for having been raised by you, surrounded by your love and your effort to provide us with everything you could give us so that we blossomed in our lives.
ii
Abstract
In a world where the online space gains gradually more territory and becomes a central part of people’s lives, it is evident that e-commerce will continue to grow and become a natural form of shopping. Equally to its traditional variant, e-commerce is not free from failures, and has in fact the additional disadvantage of not featuring human physical interactions. That is why it is so important for e-retailers to learn about their consumers’ preferences and shopping behaviors, which will allow them to adapt and improve their services and recovery strategies.
After an extensive literature review related to the study’s main subjects, it appeared to be extremely pertinent and valuable to study a Portuguese consumer sample, allowing its characterization. This study provides an understanding of consumers’ behavior regarding their online shopping attitudes, their failure experiences and their recovery preferences. It is therefore a useful tool for service providers who seek to improve their customer service and consumer satisfaction.
Results show that delivery service variants play an important role when it comes to the experience of delivery failures and consumer satisfaction. Through this study, it is also possible to see how there are a few indicators that do not exclude the possibility of the existence of the phenomenon called recovery paradox, controversial concept regarding consumer post-failure satisfaction.
Key-Words: E-commerce, Retail, Consumer Satisfaction, Purchasing Behavior. JEL classification: L81; M19
iii
Resumo
Num mundo onde o espaço online conquista cada vez mais território e se torna numa parte central da vida das pessoas, é natural que o comércio eletrónico tenha, a curto-prazo, um grande crescimento e se estabeleça como uma forma natural de comércio. Tal como a sua variante tradicional, o retalho eletrónico não está livre de falhas. Tem, na verdade, a desvantagem adicional de não contemplar qualquer interação presencial, que representa muitas vezes uma ferramenta de recuperação de falhas valiosa. Por essa razão, é importante que os retalhistas conheçam as preferências e os comportamentos dos seus consumidores, permitindo-lhes adaptar e melhorar os seus serviços e as suas estratégias de recuperação de falhas.
Após uma extensa revisão de literatura relacionada com os temas principais deste estudo, tornou-se claro que seria pertinente estudar uma amostra de consumidores portugueses, com o objetivo de fazer a sua caracterização. Este estudo permite conhecer os consumidores portugueses no que diz respeito ao seu comportamento de compra, à sua experiência de falhas e às suas preferências de recuperação das mesmas. É, por isso, uma ferramenta útil para retalhistas que pretendam melhorar o seu serviço e a satisfação dos seus consumidores.
Os resultados indicam que as variantes do serviço de entrega têm influência na experiência de falhas e na satisfação dos consumidores. Foi também possível observar que determinados fatores não excluem a possibilidade de existência do fenómeno paradoxo de recuperação da
falha, conceito controverso acerca da satisfação do consumidor após ter experienciado uma
falha e a sua consequente recuperação.
Palavras-chave: E-commerce, Retail, Consumer Satisfaction, Purchasing Behavior. Classificação JEL: L81; M19
iv
Index
1. Introduction ... 1 1.1 – Context... 1 1.2 – Objectives ... 2 1.3 – Structure... 2 2. Literature Review ... 4 2.1 – E-commerce ... 4 2.2 – Online consumer ... 5 2.3 – E-commerce in Portugal ... 62.4 – Portuguese online consumer ... 7
2.5 – Service Failure and Service Recovery ... 7
2.5.1 – Demography factors ... 10
2.6 – The Recovery Paradox ... 10
2.6.1 – Distributive Justice, Procedural Justice and Interactional Justice ... 11
2.6.2 – Mixed Findings ... 12
2.7 - Research question and hypotheses ... 15
2.7.1 – Hypotheses regarding e-service failures and consumers’ characteristics ... 15
2.7.2 – Hypotheses regarding e-service failures and online consumers’ behavior ... 16
2.7.3 – Hypotheses regarding the online consumers’ satisfaction and behavior ... 16
2.7.4 – Hypotheses regarding the online consumers’ satisfaction and e-service failures . 17 2.8 – Conceptual Map ... 17 3. Methodology ... 19 3.1 – Theoretical Research ... 19 3.2 – Questionnaire ... 19 3.3 – Data Analysis ... 20 3.4 – Conclusions ... 22 4. Data Analysis ... 23
v
4.1 – Sociodemographic characterization of the Respondents ... 23
4.1.1 - Gender ... 25
4.1.2 - Age ... 25
4.1.3 - Monthly Net Income ... 25
4.1.4 - Place of Residency ... 26
4.1.5 - Level of Education ... 26
4.1.6 - Technological ability ... 26
4.2 – Online shoppers ... 26
4.2.1 – Delivery service failures ... 27
4.2.2 - Online preferences and behavior ... 28
4.2.3 – Consumers’ behavior regarding delivery service failures ... 32
4.2.4 - Satisfaction ... 35
4.3 – Validation of hypotheses ... 36
4.3.1 – Hypothesis regarding e-service failures and consumers’ characteristics ... 36
4.3.2 – Hypotheses regarding e-service failures and online consumers’ behavior ... 36
4.3.3 – Hypotheses regarding online consumers’ satisfaction and behavior ... 40
4.3.4 – Hypotheses regarding online consumers’ satisfaction and e-service failures ... 42
4.4 – Summarized results from the hypotheses ... 43
5. Conclusions ... 46
5.1 – Main conclusions ... 46
vi
Figure Index
Figure 1 - Conceptual map (hypotheses) ... 18
Figure 2 - Distribution of the respondents regarding the Use of Online Shops ... 27
Figure 3 – Distribution of experience of Online Delivery Failures ... 27
Figure 4 - Distribution of delivery failure experience ... 28
Figure 5 – Distribution of communication of the Failure to the Company ... 33
Figure 6 – Distribution of frequency of measures taken by Consumers upon a Failure Occurrence ... 34
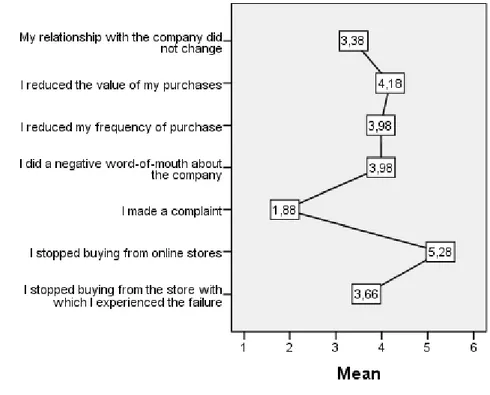
Figure 7 – Distribution of Most Valued Measures by Consumers Upon a Failure Occurrence ... 34
Figure 8 – Distribution of Compensation Actions by Consumers' Preference ... 35
Figure 9 - Distribution of Level of Satisfaction after a Failure ... 36
Figure 10 - Results from hypotheses testing ... 45
Table Index
Table 1 - Types of E-commerce Transactions (Chaffey, 2009) ... 5Table 2 - e-CAM's factors that influence Consumers' behavior online and subsequent sub-factors (Lee et al., 2001) ... 6
Table 3 - Retail and e-tail failures (Hoffman et al., 2005: 3) ... 8
Table 4 - Retail and e-tail recovery strategies (Hoffman et al., 2005: 3) ... 8
Table 5 - Authors' findings on the recovery paradox ... 12
Table 6 - Questionnaire structure division ... 20
Table 7 - Statistical tests used in this study's hypotheses ... 20
Table 8 - Comparison of the sociodemographic data between consumers who have experienced service failures and consumers who have not ... 24
Table 9 – Distribution of shopping frequency of products ... 29
Table 10 – Distribution of performance of online shopping criteria ... 30
Table 11 – Distribution of importance of online delivery service variants ... 31
Table 12 – Distribution of preferred delivery method ... 32
Table 13 - Summarized results from statistical tests applied to verify validity of H2 ... 37
Table 14 - Summarized results from statistical tests applied to verify validity of H3 ... 38
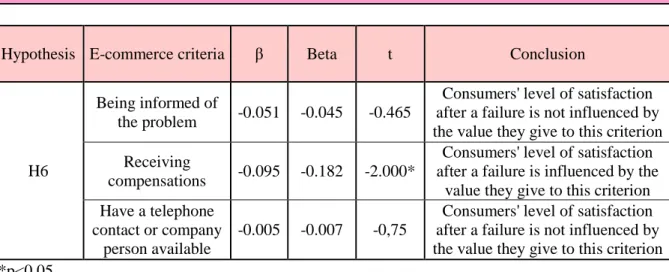
vii Table 16 - Summarized results from statistical tests applied to verify validity of H5 ... 40 Table 17 - Summarized results from statistical tests applied to verify validity of H6 ... 41 Table 18 - Summarized results of the hypotheses testing ... 43
1
1. Introduction 1.1 – Context
In the world of business, service failures happen all the time; they are common phenomenons. When we talk about human-based processes and physical interactions, the failure risk is inevitable because of the flawed nature of human beings. If we look at it this way, then the next logical step is to assure proper failure management. Companies and service providers have all the interest in recovering from a failure, guaranteeing customer satisfaction, and even foreseeing future failures. It gives them the opportunity and the power to control, or at least mitigate, the chances of losing unsatisfied customers over errors.
The risk of leaving a customer unsatisfied is even greater when we talk about e-commerce. Since e-commerce is mainly done virtually, the service failures that happen can be even harder to recover from than if it is in a brick-and-mortar organization. This is due to the inexistence of immediate physical interaction between the service provider and the customer, thus eliminating the advantage of having a social engagement between both which could potentially ease the tension. Furthermore, e-commerce customers often fail to give companies their feedback, even in service failure situations, making it harder for those companies to understand customers’ expectations, needs and wants. That is why service failure recovery is so important for businesses, especially in e-commerce, and represents such a great opportunity for thorough investigation.
Customer retention is, and always will be, a fundamental subject for service providers because it is what drives their commerce and their purpose. Most of them are aware of that and have defined customer retention strategies, including recovery measures in cases of service failures. However, it is possible that after a successful service recovery, customers demonstrate a higher satisfaction than if a failure had not occurred in the first place.
This concept is called the recovery paradox and it represents an opportunity for close study. Several researchers have written about the recovery paradox, however the different findings are mixed, some defending its existence and others arguing the lack of evidence to support it. This phenomenon is both a controversial and interesting subject to research, representing an opportunity for progress and development for service providers.
The focus of this study is to understand the online Portuguese consumer, in particular their preferences regarding service failures and recoveries, taking into account their
2 sociodemographic characteristics. Special attention will also be given to the existence or absence of the recovery paradox phenomenon within this target to further investigate the question “How can e-retailers improve their service?”.
1.2 – Objectives
Since the main objective of the current study is to profile the Portuguese online consumer by their social and demographic characteristics and understand how they perceive service failures and recoveries, several sub-objectives are outlined, additionally to the research question “How
can e-retailers improve their service?”. Its answers are a useful and resourceful tool for service
providers to recover successfully from their failures, engage and retain customers and, possibly, learn how to take advantage of their mistakes.
In order to achieve that, a review is made on the existing literature about this subject, with the following structure:
• Development of the e-commerce concept, the difference from e-business, and the existing types of e-commerce transactions;
• An online consumer characterization, using the Technology Acceptance Model (TAM) and the e-Commerce Adoption Model (e-CAM);
• A closer and contextual approach on e-commerce in Portugal and the Portuguese online consumer;
• Review about service failure and service recovery, including the different existing types, and the need of understanding the satisfaction concept;
• Explanation of the recovery paradox phenomenon and how distributive justice, procedural justice and interactional justice can improve its understanding;
• A review on the many mixed findings about the recovery paradox, summarizing and explaining the different authors’ investigations and conclusions.
1.3 – Structure
First and foremost, in the second chapter of this thesis, a literature review is presented focusing on the main concepts in order to understand the core subject. The second chapter gives the basic theoretical knowledge and represents the foundations of such important concepts, such as e-commerce, online consumer and recovery paradox.
3 The research methodology is explained in the third chapter, where the various methodological steps are described and the research hypotheses enumerated. Results from the data analysis are presented in chapter four.
The conclusions and findings of this study are outlined and explained in the last chapter, as well as some discussion on the topic.
4
2. Literature Review 2.1 – E-commerce
The concept of electronic commerce (e-commerce) has been referred to in different perspectives. The communications perceptive, in which e-commerce is the delivery of information, products or services or payment by electronic means; a business process perspective, in which it is the application of technology towards the automation of business transactions and workflows; a service perspective, enabling cost cutting at the same time as increasing the speed and quality of service delivery; and finally an online perspective, being the buying and selling of products and information online (Kalakota and Whinston, 1997). As defined by Turban et al. (2015), e-commerce is the purchase, sell, transport, or trade data, goods, or services through the Internet. E-commerce ultimately represents “all electronically
mediated transactions between an organization and third party it deals with” (Chaffey, 2007:
8).
E-commerce is often confused with e-business, but the two are distinct concepts. E-business is a much broader definition that not only includes the selling of goods and services online, but all kinds of businesses such as the servicing of customers, collaborations with business partners, learning and electronic transactions with organizations (Turban et al., 2015). In that sense, e-commerce can be considered as a subset of e-business, narrowing down the definition.
There are several types of electronic commerce, depending on how the order, payment, fulfillment and delivery (shipment) are made. If these procedures are made physically and not digitally, then there is no e-commerce at all. However, if at least one of the activities is digital, then we can consider that there is e-commerce, but only partially. It will be considered pure when all the process activities are done digitally (Turban et al., 2015).
As for companies or organizations that make the commerce possible, they are also divided in various types. The companies that exist in a purely physical manner are called brick-and-mortar organizations, and the ones that exist only digitally are called virtual organizations. Those that combine the two, virtual and physical, are the so-called click-and-mortar organizations. Usually these companies are those using the virtual component as an extra channel besides their traditional physical establishment (Turban et al., 2015).
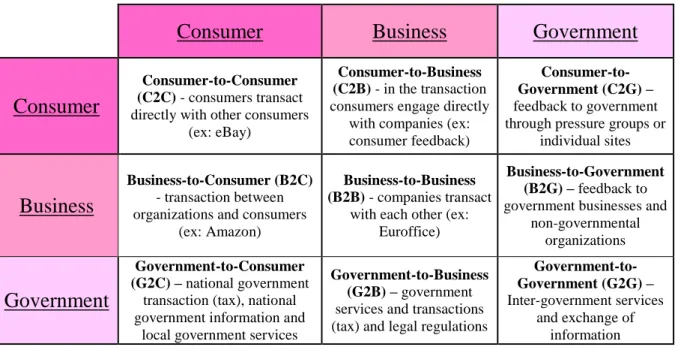
As for the participating actors involved in this type of commerce, they can also define the type of e-commerce transaction that is being registered. The two main players are Consumers and
5 Businesses, and they can either transact within one another or with each other. Table 1 illustrates this categorization.
Table 1 - Types of E-commerce Transactions (Chaffey, 2009)
Consumer
Business
Government
Consumer
Consumer-to-Consumer (C2C) - consumers transact
directly with other consumers (ex: eBay)
Consumer-to-Business (C2B) - in the transaction
consumers engage directly with companies (ex: consumer feedback)
Consumer-to-Government (C2G) –
feedback to government through pressure groups or
individual sites
Business
Business-to-Consumer (B2C)
- transaction between organizations and consumers
(ex: Amazon)
Business-to-Business (B2B) - companies transact
with each other (ex: Euroffice)
Business-to-Government (B2G) – feedback to
government businesses and non-governmental
organizations
Government
Government-to-Consumer (G2C) – national government
transaction (tax), national government information and
local government services
Government-to-Business (G2B) – government
services and transactions (tax) and legal regulations
Government-to-Government (G2G) – Inter-government services and exchange of information 2.2 – Online consumer
In order to provide a service, a product or an experience, an online business needs to understand what the consumers want, their preferences and what they value. To respond to consumer demand, marketers must first understand the consumer (Peppard and Buttler, 1998).
The technology acceptance model (TAM model), which studies the acceptance of information technology (IT) and the factors that influence it, predicts user acceptance based on two important factors: perceived ease of use (PEU) and perceived usefulness (PU). These two factors consequently determine an individual’s behavior intention (BI) to use an information technology.
Throughout the years, the TAM model has been deeply analyzed and adapted to other realities. Researchers have taken it and used it to study users’ behavior on the Internet, eventually having to adapt it. Lee et al. (2001) used and adapted the TAM model in order to focus on consumers’ usage on e-commerce, leaving BI out of the original model. Their new proposed model is the e-Commerce Adoption Model (e-CAM), “which attempts to examine the important factors that
predict consumers’ online purchasing behavior” (Lee et al., 2001: 3), namely: perceived ease
of use, perceived usefulness, perceived risk with products/services (PRP), and perceived risk in the context of online transaction (PRT) (Lee et al., 2001).
6 For each one of these factors, a number of sub-factors were attributed, as Table 2 indicates.
Table 2 - e-CAM's factors that influence consumers' behavior online and subsequent sub-factors (Lee et al., 2001)
Results from their study conclude that perceived usefulness, perceived risk in online transaction and perceived risk with product/service all have a significant impact on consumers’ online behavior, influencing it somehow. Predictably, the most influential factor that influenced negatively the B2C commerce turned out to be the perceived risk regarding online transactions. Another conclusion draws attention to the little connection and influence PRP and PU have on each other, and instead shows us that PRP has a strong relationship with e-commerce adoption. Without surprise, consumers’ perceived usefulness on e-commerce is much more affected by the risk linked to online transactions, such as privacy and security related issues, rather than the risk associated to the product/service itself.
2.3 – E-commerce in Portugal
In 2012, there were 2.5 billion internet users in the world and about 250 billion euros spent online. Portugal is no exception of this rising tendency, as there was a more than 30% increase from 2009 to 2012 in internet users and projections of 26% more until 2017. The Portuguese internet penetration is estimated to get closer and closer to the U.S.’s until 2017, and between 2009 and 2012, online shoppers almost doubled in Portugal, being that in the latter year, one fourth of the Portuguese population bought something online. The volume of B2C business online actually doubled (52%) in four years, and when summed up with the volume of business of B2B and B2G e-commerce, it turns into a 70% rise (IDC/ACEPI, 2013). In fact, in 2014, 41
Factors Sub-factors
PEU ease of information search, ease of ordering, ease of using customer service, and overall ease of use
PU saving of money, saving of time, vast selection of products/services, and overall
usefulness
PRP functional loss, financial loss, time loss, opportunity loss, and overall perceived
risk with product/service
PRT privacy, security (authentication), nonrepudiation, and overall perceived risk on
7 companies participated in a research where 66% said they had increased their sale volume and 71% the number of clients, when comparing to the homolog period (Netsonda/ACEPI, 2014).
Revealed by a study made in 2013, 23% of the Portuguese population were going to buy their Christmas gifts online (Netsonda, 2013). There are about 5.64 million internet users in Portugal, meaning that 2 in every 3 Portuguese citizens have experimented the online world (Marktest, 2015).
2.4 – Portuguese online consumer
According to INE (2011), the average online consumer lives in Lisbon, is in the age interval between 25 and 34 years (19%), graduated and is generally a student. On a more specific note, and still according to the same report, the greatest portion (14%) of e-commerce consumers live in Lisbon, followed by the 12% that live in Algarve. The online consumer is greatly represented by an educational and academic universe, due to the fact that 28% of e-commerce consumers are graduates, 21% are in high school and the main job occupation of 16% of those types of consumers is being a student (Almeida, 2012).
2.5 – Service Failure and Service Recovery
Although e-commerce service failures are less likely to occur than in traditional commerce due to the less heterogeneous process caused by a technology-based encounter, service failures are seen as unavoidable in the world of service delivery due to their inevitable human-based nature, because of its absence of perfection (Hoffman et al., 2005; Bowen and Lawler, 1992; Hoffman
et al., 2016). In fact, according to market research, “one out of every four online shoppers perceive that there are “major” problems associated with online shopping, ranging from confusing information, long upload sessions, and payment difficulty”, which comes to show
how vulnerable e-commerce is and how likely service failures are to occur (E-Marketer, 2001b; Hoffman et al., 2005). Due to this, it is important for service providers to develop strategies to recover from the failures their services might produce, especially in e-commerce since generally there is no human factor involved in a physical interaction recovery (Hoffman et al., 2005; Hoffman et al., 2016).
Previous Critical Incident Technique research has indicated that brick-and-mortar service failures can be classified through 15 types of failures, whereas the service recoveries can be
8 identified by 12 types (Kelley et al., 1993; Hoffman et al., 2005). These types of failures and recoveries can easily be applied to the virtual organization reality, as exemplified by Hoffman
et al. (2005) in their research on the typologies of e-commerce failures and recovery strategies
using the CIT methodology (which was also used by brick-and-mortar authors Kelley et al., 1993).
Table 3 - Retail and e-tail failures (Hoffman et al., 2005: 3)
Failure Type
Group 1 - Response to service delivery/product failure
Group 2 - Response to customer needs and requests
Group 3 - Unprompted and unsolicited actions
Policy failure Special order/request Mischarged
Slow/unavailable service Customer error Accused of shoplifting
System pricing Size variation Embarrassments
Packaging errors Attention failures
Out of stock Product defect
Hold disaster Altercations and repairs
Bad information Website system failure
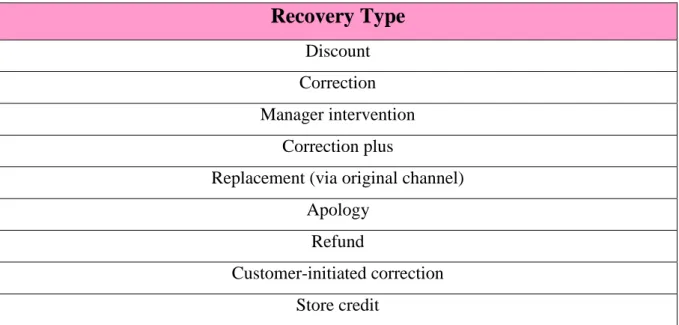
Table 4 - Retail and e-tail recovery strategies (Hoffman et al., 2005: 3)
Recovery Type
Discount Correction Manager intervention
Correction plus
Replacement (via original channel) Apology
Refund
Customer-initiated correction Store credit
9 Unsatisfactory correction
Failure escalation Nothing
Replace at brick-and-mortar
Many studies have been made in the effort to help companies achieve successful recovery strategies, and it has been demonstrated by some that an appropriate recovery strategy can uplift a customer’s satisfaction level after experiencing a service failure. Service recovery is defined by Hess et al. (2003: 129) as the “actions and activities that the service organization and its
employees perform to “rectify, amend, and restore the loss experienced” by customers from deficiencies in service performance”, and can be described in a simpler way as the “service provider’s action when something goes wrong” (Grönroos, 1988; Michel, 2008).
It is important to clarify the notion of satisfaction, as it is the main factor of influence in service failure and service recovery. Usually the concept of satisfaction is described using the expectancy disconfirmation paradigm (Oliver, 1977, 1988), which states that “positive
disconfirmation will lead to customer’s satisfaction, if perceived performance of specific product or services are able to exceed customer’s satisfaction” (Elkhani and Bakri, 2012).
Many factors can be aggravating to the decrease of customer satisfaction when experiencing a service failure, such as severity (the most influential factor), controllability and frequency of service failure. It is crucial for enterprises to invest in selective employee recruitment as well as in training, in order to assure that they present a high quality customer service, controlling service failures and presenting satisfying service recoveries (Yaping et al., 2009; Hoffman et
al., 2016). It has been shown that both physical (discounts, gifts, among others) and
non-physical (recognition of the failure, apologies, among others) recoveries are equally important, enhancing the fact that service providers should make an effort to seek the best solution adapted to each customer, searching what type of recovery is best for each situation. Furthermore, the strength of the relationship between the customer and the enterprise can also influence the gravity of the service failure in the customer’s eyes. The stronger the relationship, the less effort the enterprise has to invest to recover from the service failure. If, on the contrary, the relationship isn’t too strong, recovery will be harder to achieve and, preferably, through physical compensation (Yaping et al., 2009). It is therefore advisable for companies to develop strategies to straighten close relationships and ties with customers, so that in the long term they can recover from service failures in a smoother way and, consequently, retain more customers
10 and increase their satisfaction level. As said by Hoffman et al. (2016: 8), “business is not a
perfect science, and every organization needs a service recovery plan”.
It is also important for enterprises to track and categorize service failures, rather than simply recovering punctually from a failure and moving on. By keeping track of the failures over the time, the enterprise is able to see if there is a pattern in past service, prepare and mitigate similar issues and obtain the tools to understand the causes of those failures, correct them and train their personnel to prevent them from happening and also apply the best recovery strategies instead of letting them figure out the best way out in the moment (Hoffman et al., 2016).
2.5.1 – Demography factors
Studies show that age, gender and ethnicity are some of the demographic factors that can strengthen and ease relationships and interactions, due to the correlation felt by individuals (Lincoln and Miller, 1979; Jones et al., 1998). Hess et al. (2010) studied the importance that demographic factors play in service encounters, as it represents the ideal moment to observe the pure and unpredicted interaction between customer and service provider due to the fact that many times the service failure and service recovery happen simultaneously, in real-time. The authors believed that some customers who experienced unsatisfactory levels of service attributed the cause of the failure they experienced to the demographic differences between the service provider and themselves. Their findings showed results related only to the age factor, in which customers who found a larger age gap between themselves and the service provider, perceived the failures as more severe.
2.6 – The Recovery Paradox
The term “paradox” was first used by McCollough and Bharadwaj (1992) to describe situations in which, after a service recovery practiced by the enterprise that produced a service failure, customers’ satisfaction was higher than if the service failure had not occurred in the first place, or in other words higher than the customers who did not experience any failure. In reality, the concept appeared far back, when Etzel and Silverman (1981: 128) stated that “it may be those
who experience the gracious and efficient handling of a complaint who become a company’s best customer”. Further studies recognize the existence of the recovery paradox, noting that it
11 recovery management, as it affects directly customer satisfaction after a failure and hence influencing the happening of the paradox. Although many acknowledge its existence, the
recovery paradox is a very rare event to observe, and for researchers to validate its existence,
they need to have a large study sample to produce significant results. Thus, and despite everything said above, the evidence mounting to the service recovery paradox is mixed, possibly due to a methodological issue caused by the dozen of different approaches made by different authors, or by the fact that the recovery paradox is considered a phenomenon itself, very difficult to observe (Michel et al., 2008).
Assuming the recovery paradox does exist, service providers can take advantage of this situation, in order to increase customer loyalty and customer retention, by having a higher control of their service failures and recoveries.
2.6.1 – Distributive Justice, Procedural Justice and Interactional Justice
It is important to understand the meaning of the three dimensions of perceived justice theory due to their importance and role played in cases of service failure.
Distributive justice, based on Homans’ (1961) theory of distributive justice, is focused on the perceived fairness that a customer sees regarding the service recovery attempted by the service provider (Blodgett et al., 1993). It all depends heavily on the customers’ expectations of what a reasonable recovery is, depending on the failure’s gravity and magnitude. Each customer experiences a service failure differently and perceives their failure to be more or less severe. This leads them to have different expectations of a fair recovery for each failure. How the customer perceives the distributive justice depends on the recovery meeting their expectations or not (Hocutt et al., 2006).
Thibault and Walker’s (1975) theory of procedural justice was the pillar for Goodwin and Ross’s (1992) manipulation of the concept and consequent further use by others, bringing it closer to a service recovery context. Procedural justice focuses on exactly what it describes: procedures. A service provider is expected to have good procedures when providing their service(s) to a customer, like for example giving timely feedback about decisions in a service recovery situation (Hocutt et al., 2006).A service provider that is quick to act, makes on-the-spot decisions and is accessible after a service failure, has a better chance of winning customers’ perception of fairness in their procedures than one that doesn’t keep its customers up-to-date
12 on the conflict’s resolution and that isn’t agile in the recovery. This last hypothesis happens often when unexperienced employees have to fend for themselves when recovering from a service failure, taking longer to arrange the best solution for the customer, eventually leading to additional customer dissatisfaction.
Interactional justice was introduced in 1986 by Bies and Moag (1986: 44) when illustrating customers’ sensitivity regarding “the quality of interpersonal treatment they receive during the enactment of organizational procedures”. Throughout the late eighties and early nineties, many researchers realized that customers referred to interactional features a lot more than structural ones, such as procedures (Greenberg, 1996). Distributive justice and procedural justice began to fall short on explaining customers’ perceived fairness because they didn’t regard social interactions in service failures and recoveries. Interactional justice focuses on the whole service recovery interaction, taking into account the social factors, the way customers are treated and their feelings and perceptions. Hocutt et al. (2006) base their research on two main interactional factors regarding the service recovery context, empathy and courtesy (2006: 201), as they believe these two factors play a big part in the customer’s perception of interactional justice and how they view the encounter’s outcome.
2.6.2 – Mixed Findings
Given that there is not a consensus regarding the recovery paradox phenomenon, it is pertinent to gather the findings of some of the authors that have studied this subject. Their studies have produced such different conclusions, that same authors have taken different positions at different times regarding the paradox, such as Mary Ann Hocutt (1997; 2006).
Table 5 - Authors' findings on the recovery paradox
Authors Findings
McCullough, 2000; McCullough et al., 2000 Recovery paradox can happen if the failure is recoverable
Hocutt et al., 1997
Recovery paradox can happen if the
customer assumes that the failure was his own fault
Maxham and Netemeyer, 2002 a, b Recovery paradox can happen if the failure happens only once
13 Bolton and Drew, 1992; Boshoff, 1997;
Hocutt et al., 2006
Recovery paradox can happen if one
compares a relatively small group of customers who received an outstanding
service recovery with a large group of satisfied customers
While studying overbooking situations and the impact they have on customer service and service quality, McCollough (2000) concluded that the managements in the hotel industry can overcome overbooking failures and leave customers even more satisfied as if they had never experienced it, by upgrading the same customers to suites with no additional charge when the economy room is unavailable. Having already found in 1997 that a recovery paradox was possible in cases which the service failure caused low harm, he defends that occasions in which customers get upgraded to suites due to overbooking, customers’ satisfaction would be significantly higher than as if the failure hadn’t happened at all. McCollough also highlights the fact that whether the failure had a bigger or smaller impact and made more or less harm depends greatly on the customer, because it all comes down to how he or she perceives the magnitude of the failure and respective recovery from the service provider. Despite all of this, McCollough’s research also concludes that although a recovery paradox is likely to happen in these specific situations, it is not as if they are “no harm, no foul” situations, as depicted by hotel managements, because customers’ opinions depend on “failure and recovery attributions,
perceived interactional justice, and outcome (room) satisfaction”. Meaning that it will always
be a hard task to walk out of a service failure looking good (McCollough, 2000).
In a different study, McCollough et al. (2000) researched the failure of a 3-hour delay and a $150 ticket voucher and a “smooth and professional” approach recovery, only to conclude that no evidence to support the recovery paradox was found. The authors determined that the magnitude of the failure must be considered and even though the recovery was adequate for the customers and mitigated the failure, it did not completely erase the harm done. Once again, two important factors play their part in the existence or absence of the recovery paradox: the impact of the failure and the level of recovery, all through the eyes of the beholder (McCollough et al., 2000).
In addition to finding that whether the customers found the failure and recovery outcomes to be fair influenced their level of satisfaction, Hocutt et al. (1997) made another curious finding.
14 Through an experiment in the restaurant business involving a failure and recovery attempt, the authors were able to observe that if the customers considered the failure to be their own fault and perceived a high interactional justice in the recovery attempt, their post-recovery satisfaction level would be superior to as if the failure had not occurred, confirming the existence of the recovery paradox. This finding brought a completely different perspective to the research on this phenomenon, bringing a whole new story of the customers’ failure and recovery experience, in which the customers blame themselves for the failure occurrence (Hocutt et al., 1997).
Maxham and Netemeyer (2002), on the other hand, also made an interesting discovery by finding that the recovery paradox was prone to happen after a single failure and its satisfactory recovery, but not after a second failure. The damage of a second failure on a customer’s satisfaction levels are so deep that not even a satisfactory second recovery could make “paradoxical increases”.
The last of the findings illustrated on Table 5 is based on the idea that the recovery paradox can happen when comparing a small group of customers that experienced an outstanding recovery to a large group of satisfied customers, supported by several authors such as Boshoff (1997) and Hocutt et al. (2006). Boshoff (1997) noted that in his experiment involving a service failure and respective recovery in an airline context, only one scenario out of the total 27 showed evidence of the recovery paradox. In that scenario, the customer was quickly offered by the airline supervisor a refund for his/her expenses as well as an additional free airline ticket, rising his initial satisfaction.
Hocutt et al. (2006) executed a study on service failure and recovery, experimenting within the restaurant industry and confirming that their results showed partial support for the recovery
paradox. Considering the best recovery in case of service failure, where the service provider
demonstrates “high redress, high responsiveness, and high empathy/courtesy”, the customer’s satisfaction levels seem to be in fact higher than as if the failure hadn’t occurred in the first place (2006: 204). The authors also found that the factor with highest influence on the customer’s satisfaction levels and word-of-mouth intentions is the service provider’s empathy/courtesy, given that in scenarios where the restaurant management was less empathic and courteous, the customer’s satisfaction was lower than their initial satisfaction and their negative word-of-mouth intentions were higher.
15 These are just some of the theories that have, one way or another, supported the existence of the recovery paradox. There are several studies investigating this phenomenon, some supporting its existence, some disregarding it, but all of them chose different investigation approaches. Whether it was tested through a survey or an experiment, preferring a cross-sectional or a longitudinal study, different authors tried out different methods. This, added to the fact that the recovery paradox itself is a unique and rarely observable phenomenon, justifies why there are so many mixed findings about it.
2.7 - Research question and hypotheses
In order to provide answers to the main research question of this study, “How can e-retailers
improve their service?”, a number of hypotheses are described in order to be tested.
As the focus of this study is to understand the online consumer and online service failures, data regarding the consumer’s personal, social and demographic characteristics, as well as the consumer’s online behavior and preferences, and everything that might influence the experience of online service failures and consumer’s satisfaction with e-commerce are analyzed.
2.7.1 – Hypotheses regarding e-service failures and consumers’ characteristics
First and foremost, the characterization of the online consumer and their service failure preferences is made alongside their sociodemographic traits. The sociodemographic and personal traits analyzed are gender, age, monthly net income, place of residency, education level and technological abilities. Therefore, the following hypotheses are described:
• H1a – The communication of failures to the e-service company is influenced by the consumer’s age.
• H1b – The communication of failures to the e-service company is influenced by the consumer’s gender.
• H1c – The communication of the failures to the e-service company is influenced by the consumer’s monthly net income.
• H1d – The communication of the failures to the e-service company is influenced by the consumer’s place of residency.
16 • H1e – The communication of the failures to the e-service company is influenced by the
consumer’s education level.
• H1f – The communication of the failures to the e-service company is influenced by the consumer’s technological abilities.
2.7.2 – Hypotheses regarding e-service failures and online consumers’ behavior
The experience of failures and frequency of those failures alongside consumers’ online behavior could be different according to the type of products bought, as well as the performance of certain e-commerce criteria such as immediate expedition availability of the product and meeting the delivery deadline, so the following hypotheses are outlined:
• H2 – The experience of delivery failures is influenced by the performance of certain e-commerce criteria.
• H3 – The amount of delivery failures experienced is influenced by the performance of certain e-commerce criteria.
• H4 – The amount of delivery failures experienced is influenced by the type of products bought online.
2.7.3 – Hypotheses regarding the online consumers’ satisfaction and behavior
It is also pertinent to analyze consumers’ satisfaction level after an online service failure alongside their personal preferences and behavior regarding e-service. Thus, the following hypothesis are described:
• H5 – The consumers’ level of satisfaction after a delivery failure is influenced by the performance of e-commerce criteria.
• H6 – The consumers’ level of satisfaction after a delivery failure is influenced by the given importance of e-commerce variables.
• H7 – The consumers’ level of satisfaction after a delivery failure is influenced by the preferred delivery method.
17
2.7.4 – Hypotheses regarding the online consumers’ satisfaction and e-service failures
Since consumers’ satisfaction level after an e-service failure highly depends on the nature the failure itself, it is also important to consider the relationship between these two variables. Therefore, H8 and H9 are defined as follows:
• H8 – The consumers’ level of satisfaction after a delivery failure is influenced by the value they give to post-failure actions.
• H9 – The consumers’ level of satisfaction after a delivery failure is influenced by the preference they give to compensation actions.
2.8 – Conceptual Map
A conceptual map is available to facilitate the understanding of the concepts that are being studied in this investigation and how they are related. As Figure 1 shows, there are four main subject areas: online consumers’ sociodemographic characteristics; online consumers’ behavior; online failures; and satisfaction. (Presented in Annex I)
18
19
3. Methodology
In this chapter the study methodology will be thoroughly outlined. This study is based on an extensive literature review that complemented the statistical data analysis made to a Portuguese consumer sample. The statistical outputs and the theoretical information allow the understanding of the online consumer and the presentation of areas in which e-retailers could focus on developing or improving.
3.1 – Theoretical Research
Firstly, an approach is made on theoretical concepts that help us understand the subject being studied. Amongst the different concepts, a literature review of the e-commerce concept is made, as well as how it is different from e-business, and the different existing types of transactions. A characterization of the online consumer, a more specific approach about e-commerce in Portugal and the Portuguese online consumer are also briefly reviewed. Afterwards, an analysis of the different perspectives of authors on service failures and service recoveries is made, making it essential to understand the concept of satisfaction as well. At the end of the literature review, an introduction is made to the very debated knowledge about the service paradox and the several mixed findings about it from the several authors.
3.2 – Questionnaire
To assess the hypotheses and to the answer the research question, data was collected from a questionnaire, previously structured and applied by a Faculty alumni, Mafalda Galego, in the context of her Master Dissertation in Management, entitled “Development of E-service in
Electronic Retail” (Galego, 2014). (Annex I)
The questionnaire has 24 questions, and is composed by 5 different subjects as described by Table 6.
20
Table 6 - Questionnaire structure division
Questionnaire
Subjects Number of questions
Respondent characterization 9
Buying process 3
E-service 4
E-service failures 7
Respondents that do not use online stores 1
Total 24
The questionnaire was applied during September of 2014, through a convenience sample limited to the online population. It was disclosed through email to employees from several companies, as well as through Facebook to a non-random sample. The questionnaire had 578 valid answers.
3.3 – Data Analysis
Data is analyzed according to the objectives and research hypotheses. Descriptives, hypotheses’ tests and regressions are applied using the statistical software SPSS. The analyses’ outputs are presented in Annex II.
For each hypothesis, an adequate analysis is performed. Table 7 presents which statistical test is used per hypothesis or regression analysis and a brief definition of their procedure.
Table 7 - Statistical tests used in this study's hypotheses
Hypotheses Statistical tests Procedures
H1a H2 H7
Independent samples t-test Test for a quantitative variable, it tests the equality of means in two independent groups.For this test, it is necessary that the following assumptions are gathered: the dependent variable should be
approximately normally distributed for each group of the independent variable.
21 The test statistic is different according to Levene’s test for homogeneity of
variances. Groups are approximately normal if the group size is bigger than 30 (Central Limit Theorem). Otherwise, the Kolmogorov-Smirnov test for the
normality should be applied. Levene’s test for homogeneity of variances:
H0: The populations under consideration have equal variances.
H1: The population has different variances.
If sig.<0.05, the null hypothesis is rejected and it can be concluded that the two populations have different variances. Independent samples t-test:
H0: The population means from the two unrelated groups are equal.
H1: The population means from the two unrelated groups are not equal.
If sig.<0.05, the null hypothesis is rejected and it can be considered that the
population means are not equal. H1b | H1c |
H1d | H1e | H1f |
Chi-square test For this test, it is necessary that the
following conditions are verified: no more than 20% of the expected value below 5, and no expected value below 1.
Chi-square test:
H0: The two variables are independent. H1: The two variables are not independent. If sig.<0.05<, the null hypothesis is
22 H3 | H4 | H5 |
H6 | H8 | H9
Linear regression For this test, it is necessary that the assumptions of the Multiple Linear Regression Model are gathered: linearity of the relationship between each
independent variable X and the dependent variable Y; the mean of the residual component of the model is zero; the independent variables are not correlated with the residual terms; there is no correlation among the residual terms; the variance of the random term is constant; normality of the residuals; there is no correlation among the independent variables X.
An independent variable X influences the dependent variable Y if its coefficient is significantly different from zero. Thus, tests to the coefficients B are necessary. For each independent variable X, the hypotheses are:
H0: the coefficient is zero. H1: the coefficient is not zero.
If sig < 0,05, H0 is rejected and it can be concluded that the variable related with this coefficient influences the dependent variable Y.
3.4 – Conclusions
Last, but not least, in the final chapter of this thesis the research conclusions can be found. These conclusions derive from the research made previously and describe the answers to the hypotheses and research question.
23
4. Data Analysis
4.1 – Sociodemographic characterization of the Respondents
It is pertinent to start by characterizing the consumer by comparing two different samples: the consumers that have experienced delivery service failures and the consumers that have not experienced delivery service failures, as well as the complete sample of respondents. This will help analyze and characterize the different types of respondent samples and validate if the differences they have in terms of social and demographic characteristics influence the existence of online service failures.
Comparing these two different consumer samples can help identify important differences between them that might have influence on the subject in analysis. By analyzing both of them separately, it is easier to identify any significant differences, and consequently understand the reason for them.
24
Table 8 - Comparison of the sociodemographic data between consumers who have experienced service failures and consumers who have not
Consumers who have experienced delivery service failures Consumers who have not experienced delivery service failures All consumers who use online
shops (for shopping and research) N= 129 (35.1% of 435) 238 (64.9% of 435) 435 (95.8% of 538) Age Mean Standard deviation 32.1 10.6 32.4 12.1 30.3 12.9 <21 10.1% (n=13) 8.8% (n=28) 10.1% (n=44) 21 to 25 19.4% (n=25) 34.5% (n=82) 28.5% (n=124) 26 to 35 42.6% (n=55) 21% (n=50) 28.5% (n=124) 36 to 45 14.7% (n=19) 19.3% (n=46) 18.2% (n=79) 46 to 55 9.3% (n=12) 11.8% (n=28) 10.8% (n=47) >56 3.9% (n=5) 4.6% (n=11) 3.9% (n=17) Gender Female 55% (n=71) 60.1% (n=143) 58.9% (n=256) Male 45% (n=58) 39.9% (n=95) 41.1% (n=179) Monthly Net Income <700€ 27.9% (n=36) 38.7% (n=92) 35.2% (n=153) 700€-1400€ 35.7% (n=46) 37.8% (n=90) 37.9% (n=165) 1400€-2100€ 20.2% (n=26) 12.2% (n=29) 5.3% (n=23) >2100€ 16.3% (n=21) 11.3% (n=27) 7.1% (n=31) Place of Residency Metropolitan areas 69.8% (n=90) 75.2% (n=179) 73.8% (n=321) Rural areas 7% (n=9) 8.8% (n=21) 8.5% (n=37) Other cities 23.3% (n=30) 16% (n=38) 17.7% (n=77) Level of Education Higher education 91.5% (n=118) 87.4% (n=208) 87.4% (n=380) Highschool 8.5% (n=11) 12.2% (n=29) 12.4% (n=54)
Basic education N/A 0.4% (n=1) 0.2% (n=1)
Technological Abilities Very good 32.6% (n=42) 25.6% (n=61) 28.3% (n=123) Good 52.7% (n=68) 58% (n=138) 54.7% (n=238) Average 13.2% (n=17) 16% (n=38) 15.9% (n=69) Bad/very bad 1.6% (2) 0.4% (n=1) 1.1% (n=5)
25
4.1.1 - Gender
The questionnaire applied by Mafalda Galego for her Master’s dissertation (2014) had 578 valid answers, of which 95.8% (n=435) were of consumers that use online shops for both shopping and research, as shown by Figure 1. Of the 435 respondents, almost 59% (n=256) are female and 41.4% (n=179) are male. From the same sample, 35.1% (n=129) were from consumers that have experienced delivery service failures and 64.9% (n=238) were from consumers who have not experienced any of those failures. In both the samples of consumers, more than 50% are female.
4.1.2 - Age
The ages of the sample of online shoppers vary between 14 and 73 years, with an average of 30 years and a standard deviation of 12.9 years. The majority of the respondents, representing 28.5% (n=124), are in the age groups between 21 to 25 years and 26 to 35 years. Only 3.9% (n=17) of the respondents of the questionnaire are older than 56, representing the sample’s smallest age group.
Regarding the sample of consumers that have experienced failures (n=129), 42.6% (n=55) are in the age group between 26 and 30 years, representing the largest portion of the sample. The second largest percentage belongs to the age group between 21 and 25 years, representing 19.4% (n=25). In the sample of respondents that have not experienced any delivery service failure it is the exact opposite and the 21 – 25 age group is the most representative with 34.5% (n=82), followed by the 26 – 35 age group with 21% (n=50). The least representative age group in both samples is the group of consumers older than 56 years.
4.1.3 - Monthly Net Income
From the sample of respondents who use online shops, almost 38% (n=165) have a monthly net income between 700€ and 1400€, while 35.2% (n=153) earn less than 700€. 12.4% (n=54) have a monthly net income above 1400€. This means that more than half of the respondent sample earn a value between the first two groups, which extends until 1400€, as shown by Table 8. From the 129 respondents that have experienced delivery service failures, 35.7% (n=46) earn between 700€ and 1400€, being the most representative income group in the sample. As for the 238 respondents that have not experienced an online failure, the income group with the biggest percentage is the very first, showing that 38.7% (n=92) earn less than 700€, although 37.8% (n=90) of the 238 respondents earn between 700€ and 1400€.
26
4.1.4 - Place of Residency
Regarding the place of residency of the respondents, about 74% (n=321) are from Lisbon or Porto, cities which represent the Metropolitan Areas. Only 8.5% (n=37) are from Rural Areas. As for both the samples of consumers that have and have not experienced service failures, they both have relatively similar representations of all three categories, given that most the respondents (more than 65% in both cases) are from Metropolitan Areas and less than 10% are from Rural Areas.
4.1.5 - Level of Education
A big portion of the total number of online shopping respondents, namely 87.4% (n=380), have higher education, above high school. Only less than 1% (n=1) have not studied beyond basic education.
From the respondents that have experienced failures, 91.5% (n=118) have higher education, while the remaining 11 respondents have not pursued studies beyond high school. Of the consumers’ sample that did not experience failures, 87.4% (n=208) have higher education, 12.2% (n=29) have completed their studies until high school and 0.4% (n=1) did not study further than basic education.
4.1.6 - Technological ability
Table 8 shows that most part of the online shopping respondents have technological abilities above average and 54.7% (n=238) classify their technological abilities as good. 28.7% (n=123) say their technological abilities are very good.
In the two samples of respondents that have and have not experienced delivery service failures, most of them state that they have good technological abilities and more than 25%, in both cases, claim they have very good technological abilities. Less than 20% think they have average technological skills and an insignificant number have bad or very bad technological skills.
4.2 – Online shoppers
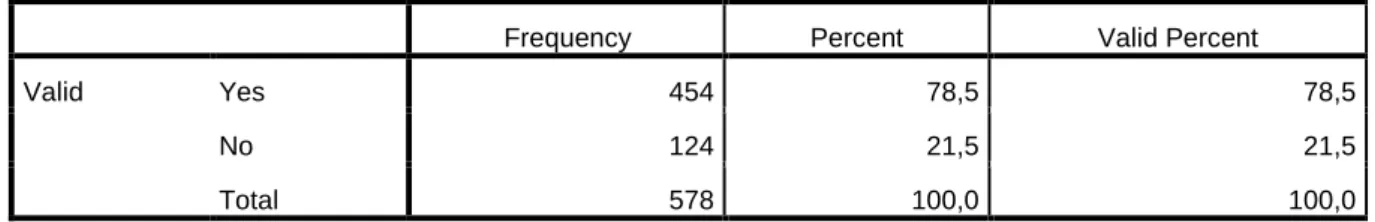
Regarding the use of online stores, 78.5% (n=454) of the respondents say they use them. Of the 454 respondents that use online stores, only 4.2% (n=19) use them only for research purposes. All the other respondents use online stores for shopping (8.1%, n=37) and for both research and shopping (87.7%, n=398).
27
Figure 2 - Distribution of the respondents regarding the Use of Online Shops
4.2.1 – Delivery service failures
Most of the respondents have not experienced any online delivery failure, yet a large 35% (n=129) have, as shown by Figure 3.
Figure 3 – Distribution of experience of Online Delivery Failures
4.2%
8.2%
87.7%
Respondents use online shops for:
Only Research Shopping Both
35.1%
64.9%
Have respondents experienced delivery failures:
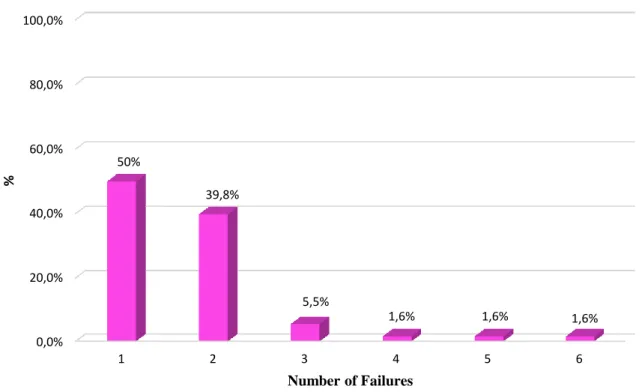
28 For the respondents who have experienced online delivery failures, half of them (n=64) have experienced only one, while 39.8% (n=51) have experienced two. The remaining 10.2% (n=13) of respondents claimed to have experienced at least three online delivery failures.
Figure 4 - Distribution of delivery failure experience
4.2.2 - Online preferences and behavior
The respondents of the questionnaire were asked to evaluate how often, from a scale of 1 (never) to 5 (frequently), certain products they bought online. The products that are most bought online by consumers are clothes and accessories (M=2.78; SD=1.39), followed by accessories for electronic products (ex: cellphone cases, headphones) (M=2.62; SD=1.42). The third most bought products are books (M=2.52; SD=1.32), like Table 9 shows.
0,0% 20,0% 40,0% 60,0% 80,0% 100,0% 1 2 3 4 5 6 50% 39,8% 5,5% 1,6% 1,6% 1,6% % Number of Failures
29
Table 9 – Distribution of shopping frequency of products
Consumers who have experienced delivery service failures Consumers who have not
experienced delivery service failures Total Respondents N 129 238 418 Clothes and Accessories Mean 2.71 2.86 2.78 Std. Deviation 1.38 1.40 1.39 House products (ex: furniture. decoration) Mean 1.54 1.45 1.50 Std. Deviation 0.85 0.85 0.88 Food and consumer products Mean 1.81 1.65 1.71 Std. Deviation 1.24 1.15 1.17 CD's, DVD's and console games Mean 2.07 1.85 1.98 Std. Deviation 1.35 1.21 1.29 Books (except digital formats) Mean 2.83 2.39 2.52 Std. Deviation 1.36 1.26 1.32 Electronic products (ex: smartphones, gadgets, household appliances) Mean 2.72 2.28 2.45 Std. Deviation 1.32 1.29 1.34 Accessories for electronic products (ex: cellphone cases, headphones) Mean 2.88 2.50 2.62 Std. Deviation 1.48 1.39 1.42 Cosmetics Mean 1.61 1.66 1.63 Std. Deviation 0.98 1.05 1.02 Car/Motorbike products Mean 1.47 1.31 1.38 Std. Deviation 0.88 0.71 0.80 Other Mean 1.74 1.49 1.57 Std. Deviation 1.33 1.16 1.22 Valid N (listwise) 129 238 418
As for consumers who have experienced delivery service failures, the products that are most bought online are accessories for electronic products (M=2.88; SD=1.47), followed by books (M=2.83; SD=1.36). The third most bought products by this respondent sample are electronic products (ex: smartphones, gadgets, household appliances) (M=2.72; SD=1.32). The least bought products by all the respondents are cars and motorbike products. However, those who have not experienced delivery service failures buy more frequently clothes and accessories (M=2.86; SD=1.40).
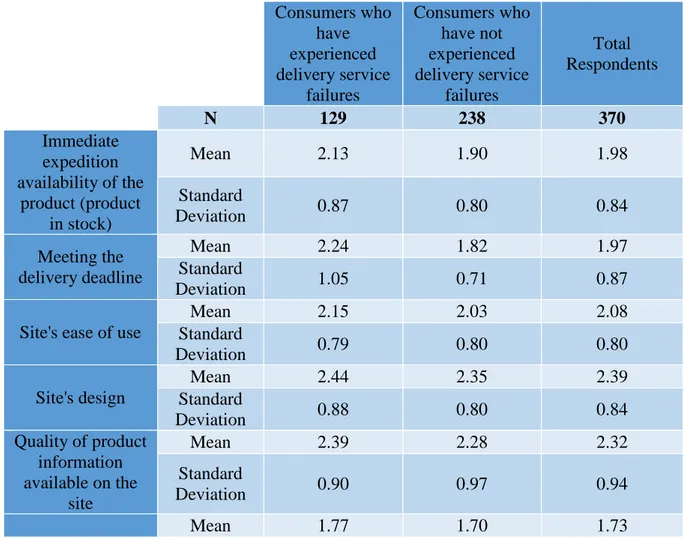
30 Respondents were also asked to classify, according to their shopping experience, the performance of certain online shopping criteria, from a scale of 1 (very good) to 6 (very bad). Table 10 compares, once more, the two different samples of respondents that have experienced delivery service failures and those who have not. For both respondent samples, the best evaluated online criteria according to its performance is the Privacy and Security on Purchase. The second best evaluated online shopping criteria, for respondents who have experienced delivery service failures is the Immediate Expedition Availability of the Product (product in stock) (M=2.13; SD=0.87), followed by the Site’s Ease of Use (M=2.15; SD=0.79). For consumers who have not experienced online service failures, the second best evaluated criteria is Meeting the Delivery Deadline (M=1.82; SD=0.70), followed by the Immediate Expedition Availability of the Product (product in stock) (M=1.90; SD=0.80).
For the consumers that have experienced delivery failures, the Guarantees of Compensation and Liability for Delivery Problems is the worst evaluated criteria according to its performance (M=2.44; SD=1.33).
Table 10 – Distribution of performance of online shopping criteria
Consumers who have experienced delivery service failures Consumers who have not experienced delivery service failures Total Respondents N 129 238 370 Immediate expedition availability of the product (product in stock) Mean 2.13 1.90 1.98 Standard Deviation 0.87 0.80 0.84 Meeting the delivery deadline Mean 2.24 1.82 1.97 Standard Deviation 1.05 0.71 0.87
Site's ease of use
Mean 2.15 2.03 2.08 Standard Deviation 0.79 0.80 0.80 Site's design Mean 2.44 2.35 2.39 Standard Deviation 0.88 0.80 0.84 Quality of product information available on the site Mean 2.39 2.28 2.32 Standard Deviation 0.90 0.97 0.94 Mean 1.77 1.70 1.73
31 Privacy and Security on Purchase Standard Deviation 0.83 0.70 0.76 Guarantees of compensation and liability for delivery problems Mean 2.44 2.26 2.32 Standard Deviation 1.33 1.12 1.18 Valid N (listwise) 129 238 370
As for the classification of delivery service variants according to their importance, respondents were asked to classify them from 1 (very important) to 6 (not important at all). For both samples, as illustrated by Table 11, the most important online delivery service variant is getting the Right Product and in Good Conditions. Consumers who have experienced online service failures value, secondly, the Delivery Time (M=1.34; SD=0.54), while consumers who have not experienced any failures value the Service Price (M=1.37; SD=0.59) more.
The least valued online delivery service component by consumers who have experienced failures is the product Availability in Stock (M=1.64; SD=0.684), while for the others it is the Ease of Communication with the Delivery Provider (M=1.66; SD=0.76).
Table 11 – Distribution of importance of online delivery service variants
Consumers who have experienced delivery service failures Consumers who have not experienced delivery service failures Total Respondents N 129 238 367 Delivery place Mean 1.37 1.39 1.39 Standard Deviation 0.60 0.63 0.62 Delivery time Mean 1.34 1.38 1.37 Standard Deviation 0.54 0.57 0.56 Availability in stock Mean 1.64 1.63 1.63 Standard Deviation 0.68 0.76 0.73 Ease of communication with the delivery
provider Mean 1.57 1.66 1.63 Standard Deviation 0.77 0.76 0.76 Service price Mean 1.44 1.37 1.40 Standard Deviation 0.72 0.59 0.64 Mean 1.13 1.16 1.15
32 Right product and
in good conditions
Standard
Deviation 0.36 0.40 0.39
Valid N (listwise) 129 238 367
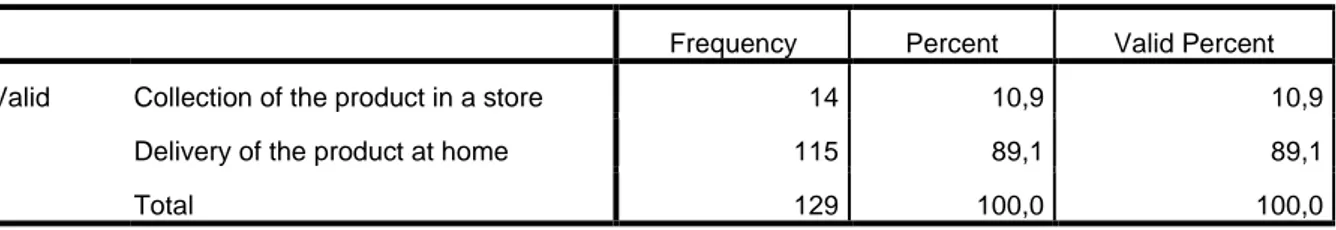
Online delivery service at home is the most preferred delivery method by all respondents, representing in both respondent sample cases more than 85%.
Table 12 – Distribution of preferred delivery method
Consumers who have experienced delivery service failures Consumers who have not
experienced delivery service failures Total Respondents N 129 238 367 Collection of the Product in a Store N 14 34 48 Percentage 10.9% 14.3% 11% Delivery of the Product at Home N 115 204 319 Percentage 89.1% 85.7% 73.3%
4.2.3 – Consumers’ behavior regarding delivery service failures
As illustrated by Figure 5, almost 90% (n=115) of the respondents that have experienced online delivery failures reported them to the online store company, leaving a remaining 10.2% (n=13) of respondents who did not provide any feedback of the failure to the company.