Received December 17, 2007 and accepted April 15, 2009. Corresponding author: marcela-correa@seapa.rs.gov.br
www.sbz.org.br
Genetic evaluation of Devon Cattle using a reaction norms model
1Marcela Bicca Bragança Corrêa2, Nelson José Laurino Dionello3, Fernando Flores Cardoso4
1Pesquisa financiada pela Embrapa (processo: 03.04.3.26) e pelo CNPq (processo 481565/2004-3). 2Doutoranda do Departamento de Zootecnia/FAEM/UFPEL.
3Departamento de Zootecnia/FAEM/UFPEL.
4Embrapa Pecuária Sul, Bagé/RS. Bolsista produtividade do CNPq.
ABSTRACT - The objective of this study was to evaluate differences in sire genetic values obtained by a conventional animal model (AM) and by a reaction norms hierarchical model (RNHM) that considers the genotype by environment interaction. A total of 25,500 records was used collected by PROMEBO – beef cattle improvement program of the National Breeders Association “Herd Book Collares” on Devon cattle born from 1980 though 2005. Post weaning gain 345 adjusted (PWG345) was the evaluated trait and the INTERGEN program was employed for data analysis. Reaction norms of the 25 sires with larger offspring showed ranking exchanges and scale effect in the environmental gradient. Spearman rank correlations between genetic values obtained by AM and RNHM at low, medium and high environmental levels were used to assess selection decision based on the different models. These correlations ranged from 0.12 and 0.99, therefore showing substantial changes in ranking, particularly between those genetic values obtained by the RNHM at low level compared to the same RNHM at medium and high levels and to AM, when considering the top 5% bulls. The results indicated that the selection process should consider the genotype by environmental interaction to maximize genetic gain and production of this population in each specific environment.
Key Words: genotype by environmental interaction, selection, sire ranking
Avaliação genética de bovinos da raça Devon utilizando-se um modelo de
normas de reação
RESUMO - Objetivou-se avaliar diferenças nas estimativas dos valores genéticos dos reprodutores obtidos por meio de um modelo animal (MA) e de um modelo hierárquico normas de reação (MHNR) que considera o efeito da interação genótipo-ambiente (G*A). Foram utilizados dados do PROMEBO – Programa de Melhoramento de Bovinos de Carne, conduzido pela Associação Nacional de Criadores – “Herd Book Collares” dos rebanhos da raça Devon que participaram do programa entre 1980 e 2005, num total de 25.000 registros, com 14.973 animais conectados. Foi avaliada a característica de ganho pós-desmama padronizada para 345 dias (GPD345) por meio do programa INTERGEN. As normas de reação dos 25 reprodutores com maior número de filhos avaliados apresentam alteração de ordenamento e efeito escalar no gradiente ambiental. Correlações de ordem de Spearman entre os valores genéticos obtidos pelo MA e pelo MHNR nos níveis ambientais baixo, médio e alto foram utilizadas para comparar decisões de seleção baseadas nos diferentes modelos. Essas correlações variaram entre 0,12 e 0,99 e apontam alteração considerável no ordenamento, especialmente entre aqueles valores genéticos obtidos pelo MHNR em ambientes menos favoráveis que os obtidos pelo mesmo MHNR nos ambientes médios e superiores e aos obtidos pelo MA, quando considerados os 5% melhores touros. Os resultados indicam que, no processo seletivo, deve-se considerar a interação G*A para aumentar o ganho genético dessa população em cada ambiente específico.
Palavras-chave: classificação de reprodutores, interação genótipo-ambiente, seleção
Introduction
With the constant quest for high quality production, animal breeding tools are increasingly being used by producers as a way of improving the genetic gain. Selection has made significant contributions in this context and is practiced by farmers in order to increase the frequency of desirable alleles in the population.
The phenotype of an individual is the result of its genotype, expressed according to the environment in which that individual is exposed. Both genotype and environment are important in the expression of most economic traits in beef cattle and a key issue in animal breeding is whether the selection of individuals in a particular environment results in genetic progress in a different environment.
The occurrence of the genotype-environment (G*E) interaction is characterized by a differential response of genotypes to environmental variations, which can cause changes in performance ranking of the genotypes in different environments (Falconer & Mackay, 1996).
The progeny of a single sire may not replicate the same performance of their parents if they are raised in different environments, which highlights the need for concern when buying seedstock animals and/or semen, due to the possible existence of genotype-environment interaction (Noble et al., 1987).
Recently, the existence of G*E interaction was verified in the Devon cattle population of Rio Grande do Sul State in Brazil (Corrêa et al., 2009). These authors observed that the reaction norms model with homogeneous residual variance was the best fit to the post-weaning gain data compared to the reaction norms model with heterogeneous residual variance and the animal model, traditionally used in genetic evaluations. Thus, they concluded that the genetic evaluation considering the G*E interaction, due to the higher heritability estimated by the reaction norms model, can increase the genetic progress in the studied population.
Nevertheless, before the practical implementation of reaction norms models for predicting breeding values in specific environments, it is necessary to assess the consequences of selection considering the environmental sensitivity. The objective of this study was to compare breeding values of Devon sires predicted using the animal model and the hierarchical reaction norms model, which considers the G*E interaction at different environmental levels in Rio Grande do Sul State.
Material and Methods
This study was based on data collected by PROMEBO – Beef Cattle Improvement Program led by the ANC – National Breeders Association “Herd Book Collares” and belonging to Devon breed cattle that participated in the program between 1980 and 2005. A total of 25,500 records were available, of which 14,973 pertained to animals that had connected records within 852 contemporary groups
and sired by 398 bulls. The evaluated trait was post-weaning gain adjusted to 345 days (PWG345).
Two models were compared for genetic evaluation: the conventional animal model (AM) and a hierarchical reaction norms model (HRNM), considering the genotype-environment interaction. The animal model, initially used to obtain contemporary group (CG) effects estimates and also as benchmark comparison for the reaction norms analysis, can be represented by:
where yij = production record of animal i belonging to the contemporary group j, µ = overall mean, cgj = effectof the
CG j; = vector of fixed
effects, in this case, age of dam linear (aod) and quadratic (aod2) coefficients and age of calf at yearling linear (a o c) and quadratic (a o c2) coefficients; = fixed effects incidence vector for animal i; ui = additive genetic effect of animal i; and eij = random error.
We used the following assumptions: ~
(
0, 2)
j cg
cg N σ for
all j, for u={ui}i=1,q, representing the random effects corresponding to q animals, we had that u~N
(
0 A, σu2)
and, finally, we presumed that ~( )
0, 2ij e
e N σ for all i and all j, where 2
cg σ , σu
2 and 2 e
σ represent variances, respectively, due to CG, additive genetic and residual terms and A represents the numerator relationship matrix.
Subsequently, the HRNM was implemented regarding the animal genetic value as a function of the average environmental level, which, in this study, corresponded to the CG solution pertaining to that particular record, obtained by the AM, Xˆ(AM j) . Thus, for each environmental
level, there is a specific genetic value of each animal i, given by ai+b Xi ˆ(AM j) , where aiand bi are respectively the intercept and the regression coefficient corresponding to the random reaction norm of animal i. Then, we have the following representation for the HRNM:
( ) ˆ
ij j i i i AM j ij
y = +μ cg +x′β+ +a b X +e ,
where yij = production record of animal i belonging to the contemporary group j, µ = overall mean, cgj = effectof the CG j; βββββ = vector of fixed effects ( age of cow and calf linear and quadratic coefficients), xi′= vector the incidence of effects, ai and bi = respectively, the intercept and the regression coefficient corresponding to the random reaction norm of animal i in the environment represented by Xˆ( )MA j, and eij = error term.
those ranked among the top 5% and the top 10% superior for PWG345 by the conventional animal model. These coefficients were obtained by the SAS program (SAS, 2000).
Results and Discussion
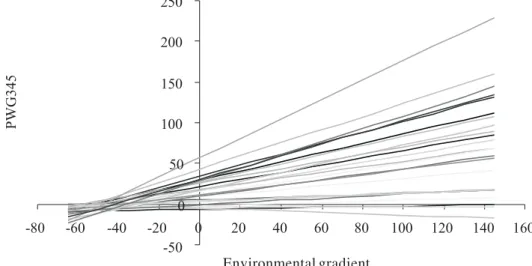
The environmental gradient for PWG345 obtained by contemporary group solutions from the animal model ranged between -73.6 and +243.1 kg, while 80% of these solutions were between -51.3 (percentile 0.10) and +71.4 (percentile 0.90). The first quartile was -36.5 kg (0.25 percentile) and third quartile or percentile 0.75 was equal to +21.8 kg.
The animals with higher overall breeding value level were those that most responded to environmental improvement and the breeding value dispersion increased proportionally to the environmental value (Figure 1). These results indicated the existence of genotype-environment interaction expressed by a scale effect, in which differences between animals were magnified as the environment improved and genetic variances were heteroskedastic (Falconer & Mackay, 1996). Similarly, a scale effect on the G*E interaction was observed in protein production in Nordic dairy cattle (Kolmodin et al., 2002) and post-weaning gain of Angus cattle in Rio Grande do Sul (Cardoso et al., 2005).
Moreover, in the adverse environmental gradient, i.e. the negative environmental values in Figure 1, the majority of crosses occurred between reaction norms (lines), indicating that most re-ranking of sires happened in restrictive environments. These changes in relative performance ordering of sires also confirmed the presence of the classic effect of genotype-environment interaction. Therefore, breeding programs designed for the Devon breed should consider the presence of the genotype-The random effects corresponding to q animals,
a={ai}i=1,q, b={bi}i=1,q, are assumed to have normal distribution with mean and covariance matrix represented as follows:
~ , a ab
ab b
N σ σ
σ σ
⎛ ⎡ ⎤ ⎞
⎡ ⎤ ⎜⎡ ⎤ ⎟
⊗
⎢ ⎥
⎢ ⎥ ⎜⎢ ⎥ ⎟
⎣ ⎦ ⎝⎣ ⎦ ⎢⎣ ⎥⎦ ⎠
a 0
A
b 0
2
2 ,
where, σa
2 e
b
σ2= additive genetic variance for the intercept
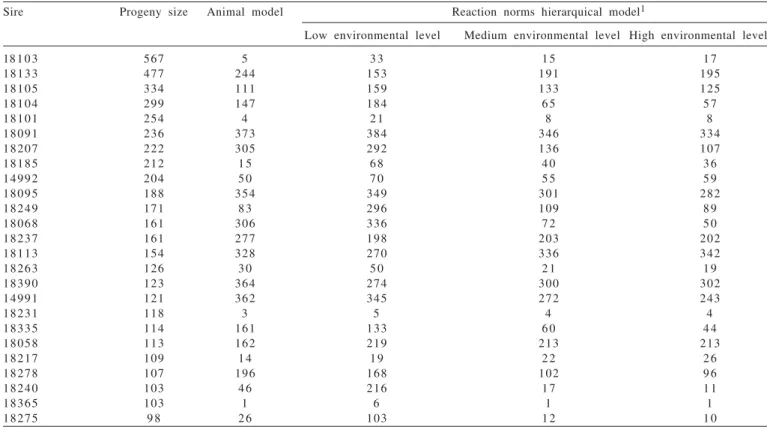
and linear coefficient, respectively; σab= covariance between the intercept and linear coefficient of the reaction norms, A = numerator relationship matrix, and ⊗ = Kronecker product. All other terms of the model follow the same description and assumptions as above for the animal model. Parameter estimates in both models were obtained by a Bayesian approach, using Markov chain Monte Carlo methods (MCMC) of 100,000 cycles after a burn-in period of 10,000 cycles and thinning interval of 10 cycles, implemented by the INTERGEN program (Cardoso, 2008). Sire genetic value estimates were compared by the rankings of the 25 animals (6% of 398 sires) with the largest progeny (between 567 and 98 calves), obtained by the AM and by the HRNM, for low, medium and high environmental levels. To this end, the first quartile of the distribution of solutions of contemporary group by the animal model, i.e. 25% of contemporary groups with the worst environmental values was considered as low environmental value, as a medium environmental value where X = 0 kg, i.e., the average environmental effect and, finally, third quartile of environmental distribution, which delimits the 25% of contemporary groups with the best environmental values, was regarded as high environmental level.
The ranking of sires for selection by the animal model and HRNM was also verified by the Spearman correlation between breeding values obtained for all sires and only to
environment interaction and heteroscedasticity of genetic variance to increase genetic gain in the population in the genetic merit predictions and the selection process (Correa et al ., 2009).
The validity of importing Devon genetic material such as semen, ova and embryos, should be carefully assessed when the selection conditions of the animals in the exporting countries are greatly superior to extensive conditions in southern Brazil. Otherwise, the offspring exposed to poor environments could frustrate the production expectations and hamper the herd genetic gain.
Rank comparisons of 25 sires with the largest progeny among all 398 evaluated (Table 1) showed that for some cases under the HRNM, in which the G*E interaction was considered, there was a significant difference in sire ordering, especially when the low and the high production levels were confronted. Some sires, such as identifications 18,275 and 18,240, were, respectively, placed in the 10th and 11th position in the high level, while in the low level of production their positions were 103rd and 216th. Furthermore, in the conventional animal model, which assumes absence of the G*E interaction, these bulls were respectively ranked as 26th and 46th.
The results above demonstrate that if these animals were selected to produce in an unfavorable environment according to their classification in the conventional genetic evaluation, ignoring the G*E interaction, most likely their progeny performance would be far from expected based on their breeding values predicted by the animal model. This suboptimal selection process would hinder herd productive performance and genetics, due to a mistaken choice of the sire to be used. On the other hand, some sires such as 18,231 and 18,365 were shown to be extremely robust to environmental variations, with superior performance in all environments (Table 1), which is desirable in the selection process.
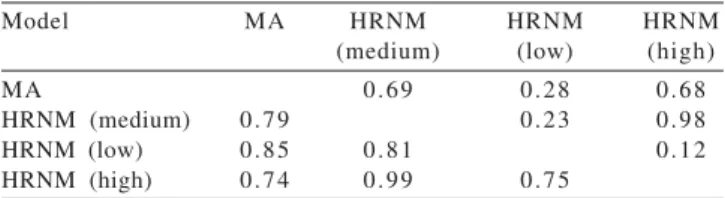
The Spearman correlation coefficient estimates between the ratings of sires obtained by the animal model and the reaction norms hierarchical model in different environmental levels ranged from 0.12 to 0.98 when only 5% of the best sires by the animal model were considered (Table 2, above the diagonal) and from 0.74 to 0.99 when 10% of the best bulls by the animal model (Table 2, below the diagonal) were selected. The magnitude of the estimated correlations, especially those involving predicted values by HRNM in low environmental value, confirmed the presence of the genotype-environment interaction.
1 Levels low, medium and high set, respectively, as the first quartile (-36.5 kg), average (0 kg) and third quartile (+21.8 kg) of the environmental gradient obtained from the contemporary group solutions for the model animal.
Sire Progeny size Animal model Reaction norms hierarquical model1
Low environmental level Medium environmental level High environmental level
18 1 0 3 567 5 3 3 1 5 1 7
18133 477 244 153 191 195
18105 334 111 159 133 125
18104 299 147 184 6 5 5 7
18101 254 4 2 1 8 8
18091 236 373 384 346 334
18207 222 305 292 136 107
18185 212 1 5 6 8 4 0 3 6
14992 204 5 0 7 0 5 5 5 9
18095 188 354 349 301 282
18249 171 8 3 296 109 8 9
18068 161 306 336 7 2 5 0
18237 161 277 198 203 202
18113 154 328 270 336 342
18263 126 3 0 5 0 2 1 1 9
18390 123 364 274 300 302
14991 121 362 345 272 243
18231 118 3 5 4 4
18335 114 161 133 6 0 4 4
18058 113 162 219 213 213
18217 109 1 4 1 9 2 2 2 6
18278 107 196 168 102 9 6
18240 103 4 6 216 1 7 1 1
18365 103 1 6 1 1
18275 9 8 2 6 103 1 2 1 0
There were remarkable differences between inferences on the top 5% of the sires and on the top 10% (Table 2). In the first case, the correlations were much lower than those estimated in the second, when a larger proportion of superior animals was considered for selection. When considering only the 5% best sires, the greatest difference in ranking of breeding values was observed between those obtained for the low and high environmental levels by HRNM (0.12), followed by the correlation between breeding values for medium and low environmental levels by HRNM (0.23) and by the correlation between the values of the animal model and the low environmental level by HRNM (0.28). These findings point out the importance of considering the G*E interaction on sire performance rankings, given that the magnitude of these correlations was extremely low.
However, when evaluating the 10% best sires, the correlations were much higher, ranging from 0.74 to 0.99, such that the greatest difference was found between rankings of predicted values using the animal model and the HRNM at high environmental level (0.74) and rankings between the high and low environmental levels by HRNM (0.75), which would be the most contrasting situations. These results indicated moderate changes in ranking and a decrease in the effect of the G*E interaction as selection intensity was reduced.
Lee & Bertrand (2002) found little difference in rankings for post-weaning gain of Hereford sires evaluated in Argentina, North America and Uruguay and obtained high genetic correlations between this trait in the different countries. Nevertheless, Kolmodin et al. (2002) reported via reaction norms ranking swaps of dairy sires and demonstrated that animals with performance records in poor environments would benefit if classifications were environment-specific. Moreover, Toral et al. (2004) observed major change in sire classification for yearling
weight and long-yearling weight of Nellore cattle in different environments.
In general, the Spearman correlation coefficient obtained in this study were lower than those estimated by Alencar et al. (2005) for weight gain from weaning to yearling age, which showed minor ranking changes of Canchin sires, when the genotype-environment interaction was evaluated by the genetic correlation between trait measurements in two environments. Using the reaction norms methodology, Cardoso et al. (2005) obtained Kendall correlations ranging from 0.74 to 0.91 between genetic values for post-weaning gain of Angus cattle obtained by an animal model and the reaction norms model, indicating a moderate effect of the G*E interaction on genetic merit rankings. These results, similarly to those obtained in the present study, indicated that the favorable gene combination to perform in restrictive environments is at least partially different from that needed to improve performance in high and medium environmental levels.
Conclusions
The post-weaning gain reaction norms of Devon sires showed changing of ranking and scale effect in the environmental gradient, which suggested the need to consider the presence of the genotype-environment interaction to increase genetic gain in this population in each particular environment. The greatest ranking changes were found in extremely restrictive environments, indicating that the genes for production under unfavorable conditions are essentially different from those for favorable breeding environments.
Acknowledgments
To Associação Nacional de Criadores Herd Book Collares and Mr. Leonardo Talavera Campos by providing the data used in this research. To CAPES, in particular, by granting the scholarship.
References
ALENCAR, M.M.; MASCIOLI, A.S.; FREITAS, A.R. Evidências de interação genótipo x ambiente sobre características de crescimento em bovinos de corte. R e v i s t a B r a s i l e i r a d e Zootecnia, v.34, n.2, p.489-495, 2005.
CARDELLINO, R.A.; ROVIRA, J. M e j o r a m i e n t o g e n e t i c o animal Montevideo: Editora Agropecuária Hemisfério Sur, 1987. 253p.
CARDOSO, F.F.; CAMPOS, L.T.; CARDELLINO, R.A. Caracterização de interação genótipo-ambiente no ganho pós-desmama de bovinos Angus via normas de reação “1”. In: REUNIÃO ANUAL DA SOCIEDADE BRASILEIRA DE
Model MA HRNM HRNM HRNM
(medium) (low) (high)
MA 0.69 0.28 0.68
HRNM (medium) 0.79 0.23 0.98
HRNM (low) 0.85 0.81 0.12
HRNM (high) 0.74 0.99 0.75
1 Levels low, medium and high set, respectively, as the first quartile (-36.5 kg), average (0 kg) and third quartile (+21.8 kg) of the environmental gradient obtained from the contemporary groups solutions for the model animal. Table 2 - Spearman correlations between breeding values
ZOOTECNIA 42., 2005, Goiânia. Anais... Goiânia: Sociedade Brasileira de Zootecnia, 2005. (CD-ROM).
C A R D O S O , F. F. M a n u a l d e u t i l i z a ç ã o d o p r o g r a m a I N T E R G E N – Ve r s ã o 1 . 0 e m e s t u d o s d e g e n é t i c a quantitativa animal. Bagé: Embrapa Pecuária Sul, 2008. p.74. (Documentos 74).
CORRÊA, M.B.B.; DIONELLO, N.J.L.; CARDOSO, F.F. Caracterização da interação genótipo-ambiente e comparação entre modelos para ajuste do ganho pós-demama de bovinos Devon via normas de reação. R e v i s t a B r a s i l e i r a d e Zootecnia, v.38, n.8, p.1468-1477, 2009.
FALCONER, D.S.; MACKAY, T.F.C. I n t r o d u c t i o n t o quantitative genetics. Harlow: Longman Group Ltda., 1996. 4 6 4 p .
KOLMODIN, R.; STRAMBERG, E.; MADSEN, P. et al. Genotype by environment interaction in Nordic dairy cattle studied using reaction norms. A c t a A g r i c u l t u re S c a n d i n a v i a , S e c t . A , A n i m a l S c i e n c e, v.52, p.11-24, 2002.
LEE, D.H.; BERTRAND, J.K. Investigation of genotype x country interactions for growth traits in beef cattle. J o u r n a l o f Animal Science, v.80, n.2, p.330-337, 2002.
NOBRE, P.R.C.; EUCLIDES FILHO, K.; ROSA, A. N. Repetibilidade e herdabilidade do peso ao nascer do gado Nelore por estação de nascimento. R e v i s t a B r a s i l e i r a d e Z o o t e c n i a, v.16, n.4, p.352-363, 1987.
RIBEIRO, S.; ELER, J.P.; BALIEIRO, J.C.C. et al. Influência da interação genótipo-ambiente sobre a classificação de touros Nelore selecionados para característica de peso ao sobreano. In: REUNIÃO ANUAL DA SOCIEDADE BRASILEIRA DE ZOOTECNIA 44., 2007, Jaboticabal. Anais... Jaboticabal: Sociedade Brasileira de Zootecnia, 2007.
STATISTICAL ANALYSIS SYSTEM - SAS. SAS/STAT. SAS Institute Inc., 2000. (CD-ROM).