Artificial neural networks for adaptability and stability evaluation
in alfalfa genotypes
Moysés Nascimento1*, Luiz Alexandre Peternelli1, Cosme Damião Cruz2, Ana Carolina Campana Nascimento1, Reinaldo
de Paula Ferreira3, Leonardo Lopes Bhering2 and Caio Césio Salgado2
Received 05 June 2012 Accepted 02 May 2013
Abstract – The purpose of this work was to evaluate a methodology of adaptability and phenotypic stability of alfalfa genotypes based on the training of an artificial neural network considering the methodology of Eberhart and Russell. Data from an experiment on dry matter production of 92 alfalfa genotypes (Medicago sativa L.) were used. The experimental design constituted of randomized blocks, with two repetitions. The genotypes were submitted to 20 cuttings, in the growing season of November 2004 to June 2006. Each cutting was considered an environment. The artificial neural network was able to satisfactorily classify the genotypes. In addition, the analysis presented high agreement rates, compared with the results obtained by the methodology of Eberhart and Russell.
Keywords: Bioinformatics, data simulation, Eberhart and Russell.
1 Universidade Federal de Viçosa (UFV), Departamento de Estatística, 36.570-000, Viçosa, MG, Brazil. *E-mail: moysesnascim@ufv.br
2 UFV, Departamento de Biologia Geral
3 Embrapa Pecuária Sudeste, Rod. SP-310, km 234, São Carlos, C.P. 339, 13.560-970, São Carlos, SP, Brazil INTRODUCTION
In plant breeding, when the purpose is to select or recommend genotypes for planting, a detailed study of the interaction between genotypes and environments is of extreme importance.
Several methodologies have been developed for this purpose. Some methods are based on regression models; for example, the methods of Eberhart and Russell (1966) and Cruz et al. (1989). The Bayesian method proposed by Nascimento et al. (2011) and non-parametric methods, such as Rocha et al.
(2005) and its subsequent modifications can also be employed
(Nascimento et al. 2009a, Nascimento et al. 2009 b). The use of the AMMI (Additive Multiplicative Models Interaction) (Gauch Junior 2006) model can also be mentioned.
The method of Eberhart and Russell (1966) is widely used today due to easy application and interpretation. The
use of this method can be verified in studies of Ferreira et al. (2004), which alfalfa cultivars were classified as adapt -ability and st-ability, and in Nascimento et al. (2010), which evaluated cultivars of coffee. However, a limitation of this
method is that genotype classification as for adaptability is done by a hypothesis test of angular coefficient (β1), in which the genotype is considered of specific adaptability to
a determined set of environments (favorable or unfavorable) when hypothesis H0: β1 = 1 is rejected. In studies where the number of evaluated environments is small (n<10) the applied test is not consistent, which can cause the non-rejection of false null hypotheses. Besides, the small number
of observations influences accuracy of estimates used for genotype classification.
As an alternative to solve this problem, artificial neural networks were used for genotypes classification in accordance
with the methodology of Eberhart and Russell (1966). In this approach, initially are simulated genotypes belonging
to classes defined by Eberhart and Russell (1966). Subse -quently, the simulated genotypes are used in the training and validation of neural networks. Thus, by the trained neural networks, the assessment of genotypes for stability and adaptability is not only performed based on the genotypes in the study, but by a large collection of simulated genotypes
in accordance with the predefined classes.
Crop Breeding and Applied Biotechnology 13: 152-156, 2013 Brazilian Society of Plant Breeding. Printed in Brazil
According to Barbosa et al. (2011) neural networks have been recently used in agriculture as a way of solving
problems associated with identification of early stages of pests or disease development and in the classification of
satellite images (França 2010). Nevertheless, in genetic improvement Barbosa et al. (2011) used a neural network as strategy for genetic diversity analysis.
This study aimed to propose a methodology for analysis of adaptability and phenotypic stability of alfalfa (Medicago
sativa L.) genotypes, based on the training of an artificial
neural network considering the methodology of Eberhart and Russell (1966).
MATERIALS AND METHODS
The data used for evaluation of the proposed methodology came from an experiment conducted by Embrapa Pecuária Sudeste, for the development of alfalfa genotypes adapted to the different Brazilian ecosystems. The experimental delineation constituted of randomized blocks with two repetitions, in which dry matter production of 92 alfalfa genotypes submitted to 20 cuttings, between November 2004 and June 2006 was evaluated. The cuttings were considered different environmental conditions, as they were carried out in different times. Furthermore, evaluation of the adaptability and stability of genotypes was also analyzed by the methodology Eberhart and Russell (1966).
The method proposed by Eberhart and Russell (1966) is based on the analysis of simple linear regression, which measures the answer of each genotype in face of environ-mental variations. Accordingly, for an experiment with g genotypes, e environments and r repetitions, the following
statistical model is defined:
Yij = β0i + β1i Ij + ψij (1)
in which: Yij: mean of genotype i in environment j; β0i:
linear coefficient referring to an i-th genotype; β1i: coefficient
of regression, which measures the answer of the i-th genotype to environment variation j; Ij: encoded environmental index
;
ψij: random errors, which can be decomposed as: ψij = δij + ε¯ij, where δij regression deviation and ε¯ij mean experimental error.
Estimates of Ij indicate environment quality. Negative values of Ij identify unfavorable environments; whereas positive values of Ij indicate favorable environments.
Estimators of adaptability and stability parameters are
given respectively as and ,
in which MSDi is the mean square deviation of genotype i; MSR is the mean square residue; and r is the number of repetitions.
The interest hypotheses are H0: β1i = 1 versus H1: β1i ≠ 1, and H0: σ2
di = 0 versus H1: σ 2
di > 0. These hypotheses are
evaluated by statistics t and F, respectively. After evaluation
of hypotheses, the genotypes in study can be classified in
one of the six classes described in Table 1.
For evaluation of the adaptability and stability of geno-types by a network, two sets of data are necessary: the training set and the test set. To obtain these sets in agreement with the
classes defined in Table 1, 1500 genotypes were simulated,
according to model 1, evaluated in 20 environments. More
specifically, parametric values used for classes 1, 2 and 3
(Table 1), each composed of 500 genotypes, were: Class 1:
β0i = X͞ G, β1i ~ U[0,90; 1,10] and σ 2
Ψ = 250 i.e., β1i is consid-ered equal to 1 if β1i ϵ [0,90; 1,10]; Class 2: β0i = X͞ G, β1i ~ U[1,11; 2,00] and σ2
Ψ = 250 i.e., β1i is considered greater to 1 if β1i ϵ [1,11; 2,00]; Class 3: β0i = X͞ G, β1i ~ U[0,00; 0,89] and σ2
Ψ = 250, σ2Ψ = 250, i.e., β1i is considered lower to 1 if β1i ϵ [0,00; 0,89]; in which U[a; b] represents distribution
of continuous uniform probability with parameters a and b.
These parametric values were selected to create the first three
mutually exclusive classes. To obtain the three remaining classes, using the same idea of Finlay and Wilkinson (1963), the simulated values were transformed to the logarithmic scale introducing a high linearization degree, in other words,
for classes 4, 5 and 6 σ2
Ψ = 0. Therefore, the stability concept is associated with the capacity genotypes have to present a predictable behavior towards stimulus of the environment. It must be emphasized that the simulation of sets is carried out taking into account environmental rate values of the evaluated set of data.
After obtaining the 3000 genotypes, representing the six classes, the set of data was divided in two: training set and test set of the network. The network training set, composed of 2400 genotypes, was obtained by random selection of 400 genotypes within each class. The test set, composed of the 600 remaining genotypes, with 100 of each class, was used for network testing.
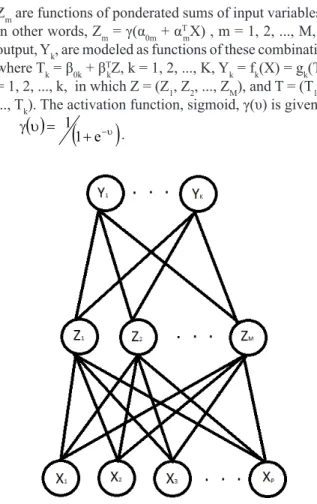
Zm are functions of ponderated sums of input variables Xi, in other words, Zm = γ(α0m + αT
mX) , m = 1, 2, ..., M, and
output, Yk, are modeled as functions of these combinations, where Tk = β0k + βT
kZ, k = 1, 2, ..., K, Yk = fk(X) = gk(T), k
= 1, 2, ..., k, in which Z = (Z1, Z2, ..., ZM), and T = (T1, T2, ..., Tk). The activation function, sigmoid, γ(υ) is given as:
( )
υ =(
+ −υ)
γe 1 1
.
Figure 1. Scheme of a single hidden layer back-propagationnetwork. The output function gk(T) allows a final transformation of output vector T. In regression studies, function gk(T) is
defined as the identity, in other words, gk(T) = T. However, when the network is used for classification, purpose of the
present study, in one of the k groups, the softmax function is used,
( )
∑
== K
1 l
T T
k
l k
e e T
g , which produces positive estimates
whose sum is one (Hastie et al. 2009).
The estimate of the set of all parameters of the network
(ϴ), known as weights, {α0m, αm; m = 1, 2 ..., M} and {α0k, αk; k = 1, 2 ..., K}, is carried out by minimization of the
sum of square errors, , and the
corresponding classifier is given as: G(ϴ) = arg maxk fk (x).
The function minimization is carried out by application of the descending gradient algorithm, known as back-propa-gation (Hastie et al. 2009).
To initialize the training process of the network, i.e., to
obtain the weights, it is necessary to define initial values.
According to Venables and Ripley (2002) the initial values of the process should be chosen randomly in the range, where their limits must satisfy the equation LS* max(| x |) ≈ 1, where LS denotes the upper limit of the range and max (| x |) is the largest absolute value the set of training data.
After the network training and test stage, where it was considered a maximum error of 2% for test set, the set of data of alfalfa genotypes was presented to the network for
classification.
The classification as for adaptability was carried out based on the classification in one of the first three classes
(Table 1). As to stability, considering Finlay and Wilkinson (1963) concept, the genotype is described as high stability
if, after its linearization the classification for adaptability is
not altered and, as low stability if it is altered. The evalu-ation of adaptability and stability of genotypes was also carried out by the methodology proposed by Eberhart and Russell (1966).
To evaluate adaptability and stability of the 92 alfalfa genotypes in study, using concepts presented in the meth-odology of Eberhart and Russel (1966), through a neural network, the nnet function of the nnet package (Venables and Ripley 2002) implemented in software R (R Develop-ment Core Team 2010) was used, whose codes are available at: http://www.det.ufv.br/~moyses/links.php. The analysis regarding the methodology of Eberhart and Russell (1966) was performed using the Genes software (Cruz 2006).
RESULTS AND DISCUSSION
Significant differences were observed between genotypes
(Table2), indicating the existence of genetic variability be-tween genotypes for dry matter production. The existence of the genotype x cutting interaction (P ≤ 0.01) was also verified, indicating that the genotypes present distinguishedperfor-mance in face of the different environmental conditions. Therefore, the necessity of further studies on the behavior of cultivars towards these variations by adaptability and stability analysis is observed.
Initial values for network weights (ϴ) were randomly
chosen between interval
[-2, 207295x10-4; 2, 207295x10-4].
Out of the 92 genotypes, 74 were classified as general
adaptability, out of which 45 have higher mean than the general average (1176.84 kg ha-1) and are described as high
LE N 1, Siriver 2, Monarca INTA, Hunterfield, WL 442,
Primavera 1, 5 683, Califórnia 50, Sutter, Victoria INTA, Medina, Perla, Activa, P 30, 58 N, 5, Express, 13 R Supreme, Aca 900, Maxidor, Diamind, Victoria, Florida 77, DK 194, Sequel HR, Barbara INTA, Pecos, Aurora, LE N 2,
Ameri-graze 701, Costera INTA, LE N 4, Springfield, LE N 3, WL
612, Sequel 2, Sundor, Cuf 101, Maricopa, Trindade 87, Califonia 60, 5 939.. Out of these 74 genotypes, 89 and 77%
presented, respectively, same classification as for adaptability
and stability, by the methodology of Eberhart and Russell
(1966) (Table 3). Among the discordant classifications, the Rio genotype was classified by neural networks the similar
way than in study of the Ferreira et al. (2004).
Moreover, the Rocio and WL 612 genotypes, classified as general adaptability by network have been classified as specific adaptability to unfavorable environments by the
method of Eberhart and Russell (1966), while in Vasconcelos
et al. (2008) these same genotypes were classified as specific
adaptability to favorable and unfavorable, respectively. Nine genotypes (Primavera, Topper, Candombe, WL 516, F 686, Barbara, Lujan, WL 525, Sequel) were
classi-fied as specific adaptability to unfavorable environments
and nine (Activa, Aurora, Sundor, Prointa Patricia, Prointa
Lujan, Platino, Kern, Key II, Aca 901) as specific adapt
-ability to favorable environments. Percentage agreements for adaptability and stability were respectively, 89 and 78% and 100 and 100% regarding results obtained by Eberhart and Russell methodology (1966), for genotypes described
as specific adaptability to unfavorable and favorable envi -ronments respectively (Table 3).
Ventura et al. (2009) calculated percentage of coincidence among breeding values for weight at 205 days in cattle Ta-bapuã, originating from the neural networks and the values
predicted by BLUP. Considering the first hundred animals, the percentage was 66% and for subsequent classifications
matching the value was even lower (26%). Guided by results the authors did not recommend the use of neural networks in genetic evaluations when to insert new animals in the future that are not contained in the database trained.
Due the high agreement rates in relation to the results, as adaptability, obtained by the methodology of Eberhart and Russell (1966), the neural networks showed an
alter-native to classification of genotypes. Regarding stability,
the lowest percentage of agreement can be explained by the concept of used in the network. This concept is based
Table 1. Possible genotype classes by Eberhart and Russell methodology (1966) and respective parametric values
Classes Practical classification Parametric values
1 General adaptability low predictability β1i = 1 and σ2
di > 0 2 Specific adaptability to favorable environments and low predictability β1i > 1 and σ2
di > 0
3 Specific adaptability to unfavorable environments and low predictability β1i < 1 and σ 2 di > 0
4 General adaptability high predictability β1i = 1 and σ2
di = 0 5 Specific adaptability to favorable environments and high predictability β1i > 1 and σ2
di = 0
6 Specific adaptability to unfavorable environments and high predictability β1i < 1 and σ 2 di = 0
Table 2. Joint analysis of variance, general means and coefficients of variation of 92 alfalfa genotypes, for dry matter production in 20 cuttings conducted in growing seasons of November 2004 to June 2006
Sources of variation df Mean squares
Blocks 1 2,002,415.43
Cultivar (Cv) 91 1,384,475.75*
Error a 91 574,269.72
Cutting (C) 91 62,331,022.56*
Error b 91 946,917.67
Interaction (Cv x C) 1729 60,682.46**
Error c 1729 55,851.26
Mean (kg ha-1) 1176
** and *: significant at 1 and 5% probability, respectively by F test.
Table 3. Mean, maximum, minimum and rangeof dry matter production (kg ha-1), and agreement percentages with the results obtained by trained neural network
Statistics Dry matter production (kg ha-1)
Mean (kg ha-1) 1176.83
Maximum 1622.76
Minimum 651.02
Range 971.74
Agreement percentages between ER and ANN
General Adaptability 89%
Stability 77%
Unfavorable Adaptability 89%
Stability 78%
Favorable Adaptability 100%
Stability 100%
on the work of Finlay and Wilkinson (1963), which differs from Eberhart in considering stability as invariance and not which previsibility.
Another point interesting is the possibility of simula-tion of the genotypes based in different methodologies of adaptability and phenotypic stability in which it is possible create classes of responses.
Despite the satisfactory results obtained by the network, it is important to mention that further studies are needed to
evaluate the real efficiency of the technique in such situa -tions. These studies, based on simulation, would clarify if
the neural networks are more efficient than other adaptability
and stability methodologies.
In future studies we intend to perform simulations for different scenarios in order to verify if the neural networks can be useful to work around problems related to the small number of environments and loss of observations.
Besides, due to the non-linear structure (Bishop 1995), neural networks capture more complex characteristics per-taining to the set of information and do not require detailed information of the process to be modeled the neural networks has great potential in plant breeding.
REFERENCES
Barbosa CD, Viana AP, Quintal SSR and Pereira MGP (2011) Artificial
neural network analysis of genetic diversity in Carica papaya L.. Crop
Breeding and Applied Biotechnology 11: 224-231.
Bishop CM (1995) Neural networks for pattern recognition. Oxford University Press, New York, 482p.
Cruz CD, Torres RA and Vencovsky R (1989) An alternative approach to the stability analysis proposed by Silva and Barreto. Revista
Brasileira de Genética 12: 567-80.
Eberhart SA and Russel WA (1966) Stability parameters for comparing varieties. Crop Science 6: 36-40.
Ferreira RP, Botrel MA, Ruggieri AC, Pereira AV, Coelho ADF, Lédo FJS and Cruz CD (2004) Adaptabilidade e estabilidade de cultivares de alfafa em relação a diferentes épocas de corte. Ciência Rural 34: 265-269.
Finlay KW and Wilkinson GN (1963) The analysis of adaptation in a plant-breeding programme. Australian Journal of Agricultural
Research 14: 742-754.
França MM (2010) Análise do uso da terra no município de Viçosa-MG
mediado por classificações supervisionadas com redes neural artificiais
e Maxver. Revista Brasileira de Geografia Física 2: 92-101.
Gauch Junior HG (2006) Statistical analysis of yield trials by AMMI and GGE. Crop Science 46: 1488-1500.
Hastie T, Tibshirani R and Friedman J (2009) The elements of statistical
learning: data mining, inference, and prediction. Springer, New
York, 745p.
Nascimento M, Ferreira A, Campana ACM, Salgado CC and Cruz CD (2009a) Multiple centroid methodology to analyze genotype adaptability. Crop Breeding and Applied Biotechnology 9: 8-16.
Nascimento M, Cruz CD, Campana ACM, Tomaz RS, Salgado CC and Ferreira RP (2009b) Alteração no método centroide de avaliação da adaptabilidade genotípica, Pesquisa Agropecuária Brasileira 44: 263-269.
Nascimento M, Ferreira A, Ferrão RG, Campana ACM, Bhering LL, Cruz CD, Ferrão MAG and Fonseca AFA (2010) Adaptabilidade e estabilidade via regressão não paramétrica em genótipos de café.
Pesquisa Agropecuária Brasileira 45: 45-48.
Nascimento M, Silva FF, Sáfadi T, Nascimento ACC, Ferreira RP and Cruz CD (2011) Abordagem bayesiana para avaliação da adaptabilidade e estabilidade de genotypes de alfafa. Pesquisa Agropecuária
Brasileira 46: 26-32.
R Development Core Team (2010) R: A language and environment for statistical computing. R Foundation for Statistical Computing, Vienna, Austria (http://www.r-project.org).
Rocha RB, Abad JIM, Araujo EF and Cruz CD (2005) Avaliação do método centróide para estudo de adaptabilidade ao ambiente de clones de
Eucalyptus grandis. Ciência Florestal 15: 255-266.
Vasconcelos ES, Barioni Júnior W, Cruz CD, Ferreira RP, Rassini JB and Vilela D (2008) Seleção de genótipos de alfafa pela adaptabilidade e estabilidade da produção de matéria seca. Acta Scientiarum.
Agronomy 30: 339-343.
Ventura RV, Silva MA, Medeiros TH, Dionello NL, Madalena FE, Fridrich AB, Valente BD, Santos GG, Freitas LS, Wenceslau RR,
Felipe VPS and Corrêa GSS (2012) Uso de redes neurais artificiais
na predição de valores genéticos para peso aos 205 dias em bovinos da raça Tabapuã. Arquivo Brasileiro de Medicina Veterinária e
Zootecnia 64: 411-418.