Conductive Composites Based on Polyurethane and Nanostructured Conductive Filler of
Montmorillonite/Polypyrrole for Electromagnetic Shielding Applications
Patricia Cristine Vargasa, Claudia Merlinia,b, Sílvia Daniela Araújo da Silva Ramôaa,
Rafael Arenharta, Guilherme Mariz de Oliveira Barraa* , Bluma Guenther Soaresc
Received: January 05, 2018; Revised: April 27, 2018; Accepted: July 09, 2018
In this study, composites based on polyurethane (PU) derived from castor oil and montmorillonite/ polypyrrole doped with dodecylbenzenesulfonic acid (MMt-PPy.DBSA) were developed. In order to investigate the potential use of these materials for electromagnetic shielding applications, the electrical and mechanical properties of PU/MMt-PPy.DBSA composites were determined and compared with composites containing neat PPy.DBSA. The electrical conductivity of PU/MMt-PPy.DBSA composites
was found to be higher than those for PU/PPy.DBSA with a similar filler content. Additionally, with a higher conductive additive content, significant increases in the tensile stress (σ) and elastic modulus
(E) were observed, suggesting that MMt-PPy.DBSA acts as reinforcing agent for the PU matrix. The
electromagnetic interference shielding effectiveness (EMI SE) of composites is mainly dependent on the morphology and filler content. The PU/MMt-PPy.DBSA composite containing 25 wt % of
MMt-PPy.DBSA showed a maximum EMI SE of -21 dB, which is similar to the value required for commercial applications (-20 dB). The results revealed that PU/MMt-PPy.DBSA composites are promising materials for electromagnetic shielding applications.
Keywords: Polypyrrole, montmorillonite, polyurethane derived from castor oil, electromagnetic interference shielding application.
*e-mail: [email protected]
1. Introduction
Due to the development of sophisticated and ever smaller electronic devices, electromagnetic interference has become an environmental problem in the modern world1,2. Nowadays, electrically conductive polymer composites (ECPCs) are being extensively studied as alternatives to metals, since they
offer lower density, easier processing and lower cost. The
ECPCs are formed by a conductive additive dispersed in an insulating matrix. Several conductive additives can be used
to produce ECPCs, but scientific interest in the use of the
intrinsically conducting polymers (ICPs) has been increasing due to their potential in various technological applications. Polypyrrole (PPy) is one of the most widely studied ICPs because of its remarkable and well-known properties, such as high electrical conductivity, chemical and environmental stability, low ionization potential and ease of synthesis3,4.
In ECPCs, the electrical conductivity and the electromagnetic
interference shielding effectiveness (EMI SE) are dependent
on the formation of a conducting network in the insulating polymer matrix. The minimum amount of conductive additive incorporated into the insulating matrix that causes the abrupt increase in electrical conductivity and electromagnetic
shielding is known as the percolation threshold. This parameter
is dependent on the properties of the conductive filler, such
as the surface area and aspect ratio and the properties of the insulating polymer matrix. The percolation threshold
is also affected by the interaction between the conductive filler and the polymer matrix, manufacturing process and
processing conditions5-7.
A major challenge in developing ECPCs filled with ICPs
is to reduce the percolation threshold, in order to minimize the processing costs and the reduction in the mechanical properties of the host-insulating polymer. One of the most commonly employed techniques used for this purpose is the
preparation of a nanostructured conductive filler through the
in situ polymerization of pyrrole in the presence of nanometric materials. In this regard, montmorillonite (MMt) is a promising
candidate for obtaining a nanostructured conductive filler due
to its layered structure, large surface area, high aspect ratio and chemical and thermal stability. In addition, MMt is a natural material associated with low cost8,9. Many techniques have been applied to produce nanostructured conductive
fillers, but one of the most widely studied consists of inserting
PPy into MMt layers through the chemical polymerization of pyrrole in an MMt suspension. This method allows the formation of an exfoliate structure, which results in strong aDepartamento de Engenharia Mecânica, Universidade Federal de Santa Catarina - UFSC,
Florianópolis, SC, Brasil
bDepartamento de Engenharia, Universidade Federal de Santa Catarina - UFSC, Blumenau, SC, Brasil cDepartamento de Engenharia Metalúrgica e de Materiais, Universidade Federal do Rio de Janeiro -
interaction between the nanostructured conductive additive and the insulating matrix10-12.
Furthermore, the insulating polymer matrix plays an important role in the production of highly electrically conducting polymer composites. Polyurethane (PU) has been widely used to develop ECPCs because of its excellent processability, resistance to solvents and good mechanical
properties, which can be adjusted by using different amounts
and types of diisocyanates and polyols13. Moreover, PU can be synthetized through the polycondensation reaction between diisocyanate and polyol derived from vegetable oils, such as castor oil13,14,15, soybean oil and passion fruit oil16. Castor oil is of particular interest due to the presence of ricinoleic acid (12-hydroxy-(cis)-9-octadecenoic acid)
which represents more than 90 % of the fatty acids in its
structure15. Moreover, the PU synthesis can be performed at room temperature without the use of solvents or melting.
Several studies have been reported on the synthesis of
nanostructured conductive fillers based on MMt-PPy10,11,17,18
and its use as a conductive filler for an insulating polymer
matrix19-20. However, few authors21 have reported the
preparation of MMt-PPy-filled nanocomposites for application
in electromagnetic shielding, or discussed the correlation between the structure and the electromagnetic shielding properties of such nanocomposites.
In this context, the focus of this study was to investigate the structure and properties of polyurethane derived from castor oil and MMt-PPy (PU/MMt-PPy.DBSA) nanocomposites and their potential use for electromagnetic shielding applications.
2. Experimental
2.1 Materials
Natural sodium bentonite clay (MMt-Na+), (VULGEL CN 45), produced by Aliança Latina Indústria e Comércio Ltda, was kindly supplied by the company Ioto International. According to the manufacturer, the MMt displays high-purity, pH of 5.5 and electrical conductivity of 10-6 S.cm-1.
Pyrrole (Sigma-Aldrich; 98 %) was distilled under vacuum
and stored in a refrigerator. Iron (III) chloride hexahydrate (FeCl3.6H2O) (analytical grade, Sigma-Aldrich) and surfactant dodecylbenzenesulfonic acid (DBSA) (Sigma-Aldrich) were
used without further purification. The company IMPERVEG®
Comércio e Prestações de Serviço Ltda supplied the PU
derived from castor oil (PU) (IMPERVEG® UG 132 A). The
PU is composed of two components: a polyol derived from castor oil (trifunctional polyester) and a prepolymer, which was synthesized by reacting diphenyl methane diisocyanate (MDI) with polyol, but keeping three percent of the free isocyanate for later reaction.
2.2 Preparation of montmorillonite/polypyrrole
(MMt-PPy)
Nanostructured conductive filler was prepared according
to the method described by Ramoa et al.11. Firstly, 1 g of MMt was dispersed in 100 mL of aqueous solution containing DBSA and stirred for 2 h under magnetic stirring at room temperature (molar ratio surfactant/PPy = 1:5). This suspension was then sonicated in an ultrasonic processor
(Sonics VCX 750) with 35 % power (263 W) for 20 min.
In the next step, FeCl3.6H2O (0.0264 mol dissolved in 50 mL of distilled water solution) was added slowly to the MMt/surfactant suspension under magnetic stirring at room temperature. After 15 min, pyrrole (0.0115 mol) dispersed in 20 mL of distilled water (molar ratio MMt/PPy = 1:5) was added dropwise. The polymerization was carried out for 1 h under magnetic stirring at room temperature. After 24 h, the nanostructured conductive additives (MMt-PPy.DBSA)
were filtered, washed with distilled water and dried at 60ºC.
The synthesis of neat PPy.DBSA was carried out following the same procedure, but without the presence of MMt.
2.3 Preparation of PU/MMt-PPy.DBSA
composites
The prepolymer (component A) and the polyol derived from castor oil (component B) were blended in a mass
ratio of 1:2, respectively. Subsequently, different weight
concentrations of MMT-PPy.DBSA were then manually blended into the PU mixture for 5 min. The mixtures were placed in a metallic mold, left for 2 h at room temperature and then subjected to compression molding at 10.7 MPa for 4 h. After 6 h, the compression stress was released and the composites kept at room temperature in vacuum desiccator for 24 h to complete the cure. The whole procedure was
performed at room temperature (23 ± 2ºC). PU/PPy.DBSA
composites were prepared using the same procedure.
2.4 Characterizations
The electrical conductivity of the conductive fillers
and high-conductivity composites was measured using a Keithley 6220 current source to apply the current and a Keithley Model 6517A (Oklahoma, U.S.A.) electrometer to
measure the potential difference. The PU and low-conductivity
composite measurements were performed using a Keithley
6517A electrometer connected to a Keithley 8009 test fixture.
Elemental analysis (carbon, hydrogen and nitrogen) was performed with a Perkin-Elmer CHN 2400 analyzer,
at 95ºC using oxygen (99.995 %). The PPy.DBSA content
The specific surface areas (SSAs) of the conductive fillers
were determined by the BET nitrogen adsorption method (Quantachrome Instruments - Autosorb-1). Physisorption tests were performed to determine the area by BET following the ASTM D 6556. The samples were previously dried at
70ºC under vacuum (10-7 torr) and then the nitrogen gas adsorption was measured at 77K in relative pressure values in the range from 0 to 1.0.
Transmission electron microscopy (TEM) was carried out on a Jeol JEM-1100 microscope operating at an accelerating voltage of 100 kV. The composites were cut into ultrathin slices (~80 nm thick) using a diamond knife in an ultramicrotome (RMC Boeckeler) and deposited on a 200-mesh copper grid for subsequent observations.
The X-ray diffraction (XRD) patterns of MMt, MMt-PPy. DBSA and composites with 5 and 20 wt % of MMt-PPy.DBSA were obtained on an X'pert (Philips) X-ray diffractometer with CuKα radiation (λ = 0,154 nm) at 40 kV and 30 mA. The samples were evaluated from 2º to 10º (2θº) with 0.05º
steps and a 1s time step.
Thermogravimetric analysis (TGA) was carried out using a STA 449 F1 JupiterVR (Netzsch) thermogravimetric
analyzer. The analyses were performed at 10ºC min-1 from
35ºC to 950ºC under an air flux of 50 mL min-1.
The tensile properties of the neat PU and the composites were determined using a dynamic mechanical analyzer (DMA
Q-800, TA Scientific) in the tensile mode on rectangular
specimens with a 5 mm width, 35 mm length and 0.2 mm thickness. The mechanical tests were performed at a test speed of 3 mm.min-1 in the range of 0 to 18 N.
The electromagnetic interference shielding effectiveness
(EMI SE) of neat PU and the composites was measured using an Agilent Technology PNA series network analyzer (N5230C Agilent PNA-L) and a standard rectangular waveguide in the X-band frequency range (8.2-12.4 GHz). EMI SE measurements were performed on rectangular specimens with 10 mm width, 23 mm length and 2.0, 5.0 or 8.0 mm thickness.
3. Results and Discussion
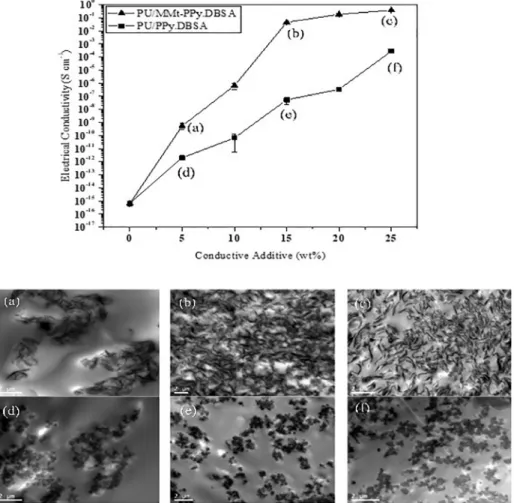
Figure 1 shows the curves of the electrical conductivity of PU/MMT-PPy.DBSA and PU/PPy.DBSA as a function of the
filler content and type, and TEM micrographs of composites.
On increasing the MMt-PPy.DBSA concentration, the electrical
conductivity of the PU/MMt-PPy.DBSA composites increased due to the formation of a conducting polymer network in the insulating polymer matrix. Analogous behavior was observed for the PU/PPy.DBSA composites; however, this polymer system presented lower electrical conductivity than that found for the PU/MMt-PPy.DBSA nanocomposite. For 25
wt % of conductive filler, the electrical conductivity of PU/
MMt-PPy.DBSA was 3.79x10⁻¹ S cm-1, while PU/PPy.DBSA reached a value of 2.77x10⁻⁴ S cm-1, these values being 15 and 12 orders of magnitude higher, respectively, than the neat PU (6.63x10⁻¹⁶ S cm-1). These results are consistent with the TEM micrographs of composites with 5, 15 and
25 wt% of MMt-PPy.DBSA and PPy.DBSA, (Figure 1). In
these images it can be observed that the MMt-PPy.DBSA is well-dispersed while PPy.DBSA agglomerates are observed in the PU matrix.
Moreover, the MMt-PPy.DBSA is comprised of a layered structure (MMt layers coated with PPy), intercalated and
partially exfoliated, as showed in the Figure 2, which result in a large surface area (3.52 m2 g-1) that enable the formation
of a conductive network in the PU matrix at lower filler
content than in the case of PU/PPy.DBSA (surface area of 2.06 m2 g-1). Similar results have been reported by Ramoa et al.10, for thermoplastic polyurethane/montmorillonite-polypyrrole nanocomposites.
The percolation thresholds of PU/MMt-PPy.DBSA and PU/PPy-DBSA were calculated according to the model proposed by Kirkpatrick22 (Eq. 1) in which σ is the conductivity, σc a constant, t a critical exponent, f the fraction
of the conductive filler and fp the fraction at the percolation threshold, expressed as a weight fraction:
(1)
The values of percolation threshold (fp), were determined through the plot of log σ versus log(f - fp), of PU/MMt.PPy.DBSA and PU/PPy.DBSA, resulted to be 1
wt % and 5 wt %, respectively. The percolation threshold of PU/MMt-PPy.DBSA is significantly lower than those
reported by Ramoa et al.10 for nanocomposites based on thermoplastic polyurethane (TPU) and MMt-PPy.DBSA
This difference can be mainly attributed to the distribution of the filler in the matrix and better interaction between the
thermoset PU and MMt-PPy.DBSA. Moreover, the use of
high process temperature (170ºC)18 can compromise the electrical properties of the composites. In our work, the composites was prepared at room temperature that also can contribute to the superior electrical properties.
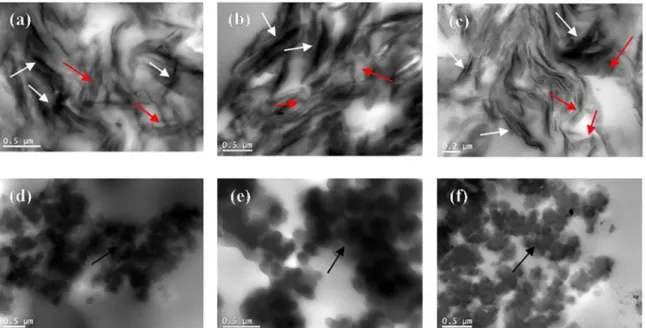
Figure 3 illustrates the TEM micrographs with a higher
magnification for both the polymer systems. The TEM images
reveal an intercalated structure for neat MMt-PPy.DBSA Figure 2. TEM micrograph of nanostructured conductive filler of
MMt-PPy.DBSA.
Figure 3. TEM micrographs of PU/MMt-PPy.DBSA composites (a, b and c) and PU/PPy.DBSA composites (d, e and f), with 5, 15 and 25 wt % of filler.
f f
c p
t
(white arrow). This behavior can be attributed to the fact that during the synthesis, the monomer is able to penetrate between the MMT layers, and the the PPy chains allow to
increase the distance between the MMt sheets. When the
MMt-PPy.DBSA is introduced into PU matrix, is possible to note that composites exhibits an intercalated and partial exfoliated (red arrow) morphology (Figure 3(a, b and c)). On
the other hand, the PU/PPy.DBSA composites with different filler amounts (Figure 3 (d, e and f)) exhibited agglomerated
particles of PPy.DBSA (black arrow) which are poorly distributed in the PU matrix. This microstructure explains the lower electrical conductivity and higher percolation threshold observed for the PU/PPy.DBSA when compared to the PU/MMt-PPy.DBSA.
The intercalated and partially exfoliated structure of
MMt-PPy.DBSA in the PU matrix was confirmed by the XRD curves (Figure 4). The 001 reflection of the neat MMt
(Figure 4(a)) and its d-value were 2θ=8.57º and 1.03 nm, respectively. On the other hand, MMt-PPy.DBSA (Figure 4(b))
did not show this diffraction peak (001). According to Ray
and Okamoto23, this behavior indicates an intercalated/ partially exfoliated structure formation. The same behavior was observed for the PU/MMt-PPy.DBSA composites, as shown in Figure 4(c) and 4(d), suggesting an intercalation/ partial exfoliation of MMt-PPy.DBSA in the PU matrix.
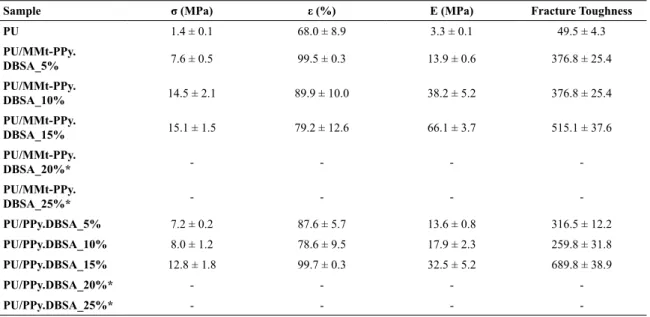
The addition of MMt-PPy.DBSA and PPy.DBSA changes the mechanical properties of PU, as can be seen in the representative stress versus strain curves (Figure 5). The tensile properties of the neat PU and composites are shown
in Table 1. When the PU is subjected to tension, it displays a ductile and flexible behavior, with a tensile stress of 1.4
MPa and elastic modulus of 3.3 MPa, respectively. It can be noted that when the MMt-PPy.DBSA content is increased, the tensile stress values and elastic modulus increase and the
composites become stiffer, indicating that the nanostructured
Figure 4. XRD diagrams: (a) neat MMt, (b) MMt-PPy.DBSA and PU/MMt-PPy.DBSA with nanostructured conductive additive content of (c) 5 wt % and (d) 20 wt %.
Figure 5. Representative stress versus strain curves: (i) neat PU and PU/MMt-PPy.DBSA with 5, 10 and 15 wt % of MMt-PPy. DBSA and (ii) neat PU and PU/PPy.DBSA with 5, 10 and 15 wt % of PPy.DBSA.
conductive additive is acting as a reinforcement agent. Similar behavior can be observed for the PU/PPy.DBSA composites, where the tensile stress and elastic modulus also increase with increasing PPy.DBSA content, but the variation is not
as significant as that observed for the PU/MMt-PPy.DBSA composites. The reinforcement effect of PPy.DBSA may be
caused by chemical bonding between the N-H in the pyrrole ring (amine groups) and polyurethane (C=O groups), that enhance the adhesion in the interface. The better properties of the PU/MMt-PPy.DBSA when compared to the PU/ PPy. DBSA may be related to the better dispersion, higher aspect ratio and larger surface area of the nanostructured conductive
additive, which result in a more effective interaction between
the phases. Furthermore, the clay layer dispersion in the PU matrix leads to improvements in the tensile strength and elasticity modulus19. It is important to highlight that mixtures
containing 20 and 25 wt % of MMt-PPy.DBSA and PPy.
conducting polymer to a polymeric matrix generally leads
to a significant reduction in the mechanical properties10. Figure 6 shown the TG curves of neat MMt, PPy.DBSA and MMt-PPy.DBSA. The MMt present two steps of weight
at 100ºC and 600ºC. The first event observed for the MMt
correspond to the elimination of water and the second is related to aluminum silicate dehydroxylation11. PPy exhibits
a continuous weight loss starting at 220ºC that is assigned to
the polymer chain degradation16. The TG curve for MMt-PPy. DBSA is similar to that observed for the neat PPy; however, the nanoestrucuted conductive additive has enhanced thermal stability, since the degradation onset temperatures was higher than for the neat PPy. This behavior can be associated
to the barrier effect of the clay layer and formation of an
intercalated/partially exfoliated structure11. The amount of residues generated in the TGA was used to estimate the PPy
and MMt content in the nanostructured conductive filler that was of 88 wt% and 12 wt %, respectively.
Figure 7 illustrates the weight loss curves obtained by
TGA and the first derivative (DTG) for PU, PU/MMt-PPy.
DBSA and PU/PPy.DBSA. The neat PU presents 4 steps of
weight loss: i) the first at Tmax at 317ºC is related at breakage of urethane bonds; ii) the second at Tmax at 389ºC is related to breaking esters bonds which are present in the prepolymer; iii) both stages at Tmax at 458ºC and Tmax at 590ºC correspond to the degradation of polyol16. It is possible to note that the composites display a similar behavior that those to neat PU. However, in the composites the initial temperatures of degradation was shifted to lower temperatures, due to the
presence of PPy. The amount of residue at 900ºC for the PU/ MMt-PPy.DBSA composites ranged from 2.9 to 4.8 wt %
due to the presence of MMT that display thermal stability at this temperature.
The electromagnetic interference shielding effectiveness (EMI SE) of a material can be defined as the ratio between
the incident (I) and transmitted (T) power, and is calculated by Eq. 213:
(2)
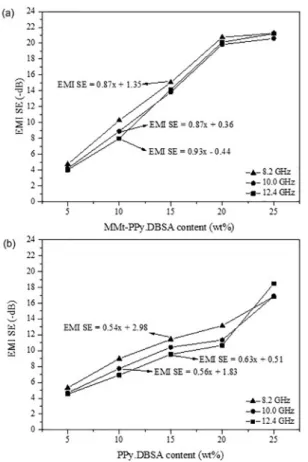
Figure 8 shows the plot of EMI SE as a function of the
type and content of the conductive filler for samples with a thickness of 2 mm. With increasing filler content the EMI
SE values for PU/MMt-PPy.DBSA and PU/PPy.DBSA increased, due to the formation of a conductive network that induces higher electrical conductivity and interaction of the additives with electromagnetic radiation. In general, the PU/ MMt-PPy.DBSA composites showed higher EMI SE values when compared to the PU/PPy.DBSA. This behavior may be associated with the higher aspect ratio and better distribution of MMt-PPy.DBSA in the PU matrix when compared to PPy. DBSA4. The PU/MMt-PPy.DBSA composite with 25 wt % Table 1. Tensile properties of neat PU, composites and blends with different conductive additives content
Sample σ (MPa) ε (%) E (MPa) Fracture Toughness
PU 1.4 ± 0.1 68.0 ± 8.9 3.3 ± 0.1 49.5 ± 4.3
PU/MMt-PPy.
DBSA_5% 7.6 ± 0.5 99.5 ± 0.3 13.9 ± 0.6 376.8 ± 25.4
PU/MMt-PPy.
DBSA_10% 14.5 ± 2.1 89.9 ± 10.0 38.2 ± 5.2 376.8 ± 25.4
PU/MMt-PPy.
DBSA_15% 15.1 ± 1.5 79.2 ± 12.6 66.1 ± 3.7 515.1 ± 37.6
PU/MMt-PPy.
DBSA_20%* - - -
-PU/MMt-PPy.
DBSA_25%* - - -
-PU/PPy.DBSA_5% 7.2 ± 0.2 87.6 ± 5.7 13.6 ± 0.8 316.5 ± 12.2 PU/PPy.DBSA_10% 8.0 ± 1.2 78.6 ± 9.5 17.9 ± 2.3 259.8 ± 31.8 PU/PPy.DBSA_15% 12.8 ± 1.8 99.7 ± 0.3 32.5 ± 5.2 689.8 ± 38.9
PU/PPy.DBSA_20%* - - -
-PU/PPy.DBSA_25%* - - -
-*Samples not broken.
Figure 6. TG curves for MMt, PPy.DBSA and MMt-PPy.DBSA.
log
of the composites increases up to 20 wt % of MMt-PPy.
DBSA and then remains practically constant. The EMI SE of the PU/PPy.DBSA also increases with increasing PPy.
DBSA content, but the most significant change occurs at a content of 20 wt % PPy.DBSA.
The linear regression model for the EMI SE as a function
of the conductive filler content for each frequency is also
shown in the Figure 9. This model can be used to predict the MMt-PPy.DBSA or PPy.DBSA content (X) which will
provide a desired EMI SE value, at a specific frequency, or to estimate the EMI SE for a mixture with a specific
MMt-PPy.DBSA or PPy.DBSA content13. For example, PU/
MMt-PPy.DBSA with 34.16 wt % of MMt-PPy.DBSA has
an EMI SE value of -30 dB at 10 GHz. On the other hand, the same EMI SE value can be achieved with the addition
of 50.3 wt % of PPy.DBSA to the PU matrix.
In order to evaluate the reflection and absorption
contributions to the total EMI SE of the composites, the
transmitted (T), reflected (R) and absorption (A) powers
were calculated using the complex scattering parameters
that represent the reflection S11 (S22) and transmission S12 Figure 7. TG and DTG curves for: (a) PU/MMt-PPy.DBSA and
(b) PU/PPy.DBSA composites.
Figure 8. EMI SE of neat PU, PU/MMt-PPy.DBSA and PU/PPy. DBSA composites with different filler contents
of additive displays an average EMI SE of -20.9 dB in the frequency range of 8.2 to 12.4 GHz, which corresponds to
99.1 % of radiation attenuation. On the other hand, for the
same PPy.DBSA content, the maximum EMI SE value was
-17.2 dB (97.8 % of radiation attenuation). It is interesting
to note that the composites produced in this work manifest
EMI SE significantly higher than other composites containing
PPy.DBSA, MMt-PPy.DBSA or PAni.DBSA. Thermoplastic
polyurethane‐filled montmorillonite‐polypyrrole (TPU/MMt‐
PPy.DBSA) and with neat PPy.DBSA display total EMI SE of -16.6 dB and -7.2 dB, respectively, for nanocomposites
containing 30 wt % of Mt‐PPy.DBSA20. For SBS/PAni.
DBSA blends the EMI SE of blend containing 30 wt % of
PAni.DBSA is round -14 dB 24.
The EMI SE values for PU/MMt-PPy.DBSA and PU/
PPy.DBSA are not influenced by the frequency, except for the polymer systems with 20 and 25 wt % of conductive filler. These results can be attributed to the formation of a
conducting network and the higher electrical conductivity values of the composites with MMt-PPy.DBSA contents of
20 and 25 wt %1.
Figure 9. EMI SE as a function of (a) MMt-PPy.DBSA and (b)
PPy.DBSA content. Figure 10. Influence of absorption and reflection mechanisms on the EMI SE of (a) PU/MMt-PPy.DBSA and (b) PU/PPy.DBSA composites with different filler contents and thicknesses. (S21) coefficients (collected directly by the instrument used
to measure the EMI SE of the samples) and Equations (3), (4) and (5), respectively, according reported by Merlini et al., 2017 6, Ramoa et al., 201820 and Merlini et al., 201713.
(3)
(4)
(5)
The reflection (SER) and absorption (SEA) contributions were calculated using the incident (I), transmitted (T) and
reflected (R) powers and Equations (6) and (7), respectively:
(6)
(7)
T ET EI S S
2
122 21 2
= = Q= V
R ER EI S S
2
11 2 222
= =
Q
=V
A=1-R-T
log
SER=10 I I-R
log
SEA= 10 I-R T
Figure 10 shows the reflection and absorption contributions
to the total EMI SE for the PU/MMt-PPy.DBSA (Fig. 10a)
and PU/PPy.DBSA composites (Fig. 10b) with different filler contents and thicknesses. The results are reported as
average values in the frequency range of 8.2 to 12.4 GHz. It is important to highlight that the total EMI SE increases
significantly with increasing of filler content and sample
thickness for both composites PU/MMt-PPy.DBSA and PU/PPy.DBSA. However, PU/MMt-PPy.DBSA composites display higher EMI SE values than those found for PU/PPy. DBSA due to the high aspect ratio of MMt-PPy.DBSA, which facilitates the formation of a conductive network, contributing with the electromagnetic radiation interaction. Besides that, the shielding by absorption increases with increasing conductive filler and thickness, while the
shielding by reflection remains practically constant. The
4. Conclusions
PU/MMt-PPy.DBSA composites were successfully obtained by the compression molding technique. The results observed in this study revealed that PU/MMt-PPy.DBSA composites show superior tensile properties, electrical conductivity and EMI SE compared with the composites prepared with neat PPy. The addition of MMt-PPy.DBSA to the PU matrix increases its electrical conductivity by 15 orders of magnitude, reaching similar values to the neat MMt-PPy. This behavior was assigned to the lamellar morphology of the nanostructured conductive additive, which allows the formation of conductive pathways with a low conductive additive content, due to its high aspect ratio. Moreover, the composites showed an intercalated/partially exfoliated structure, with a stronger interaction between the nanostructured conductive additive and the matrix. The
tensile stress (σ) and Young's modulus (E) increased with
the additive content, indicating that both additives acted as a reinforcing agent. PU/MMt-PPy.DBSA composites also showed electromagnetic radiation attenuation and the response
magnitude was influenced by the MMt-PPy.DBSA weight
fraction and sample thickness. The materials developed in this study demonstrated adequate properties for used
as effective and lightweight materials for electromagnetic
interference shielding.
5. Acknowledgements
The authors gratefully acknowledge the financial support
of the Brazilian governmental agencies Conselho Nacional
de Desenvolvimento Científico e Tecnológico (CNPq),
Coordenação de Aperfeiçoamento de Pessoal de Ensino Superior (CAPES) and Fundação de Amparo à Pesquisa e
Inovação do Estado de Santa Catarina (FAPESC). We also
thank the Central Electronic Microscopy Laboratory, Santa Catarina Federal University (LCME-UFSC).
6. References
1. Ramôa SDAS, Barra GMO, Oliveira RBV, Oliveira MG, Cossa M, Soares BG. Electrical, rheological and electromagnetic interference shielding properties of thermoplastic polyurethane/ carbon nanotube composites. Polymer International. 2013;62(10):1477-1484.
2. Wang Y, Jing X. Intrinsically conducting polymers for electromagnetic interference shielding. Polymers Advanced Technologies. 2005;16(4):344-351.
3. Kim BH, Hong SH, Joo J, Park IW, Epstein AJ, Kim JW, et al. Electron spin resonance signal of nanocomposite of conducting polypyrrole with inorganic clay. Journal of Applied Physics. 2004;95(5):2697-2701.
4. Letaïef S, Aranda P, Ruiz-Hitzky E. Influence of iron in the formation of conductive polypyrrole-clay nanocomposites.
Applied Clay Science. 2005;28(1-4):183-198.
5. Li J, Kim JK. Percolation threshold of conducting polymer composites containing 3D randomly distributed graphite nanoplatelets. Composites Science and Technology. 2007;67(10):2114-2120.
6. Merlini C, Pegoretti A, Vargas PC, Cunha TF, Ramôa SDAS, Soares BG, et al. Electromagnetic interference shielding effectiveness of composites based on polyurethane derived from castor oil and nanostructured carbon fillers. Polymer Composites. 2017 Jul 19. E-pub ahead of print.
7. Nasouri K, Shoushtari AM. Designing, modeling and manufacturing of lightweight carbon nanotubes/polymer composite nanofibers for electromagnetic interference shielding application. Composites Science and Technology. 2017;145:46-54.
8. Pojanavaraphan T, Magaraphan R. Fabrication and characterization of new semiconducting nanomaterials composed of natural layered silicates (Na+- MMT), natural rubber (NR), and polypyrrole (PPy). Polymer. 2010;51(5):1111-1123.
9. Thostenson ET, Li C, Chou TW. Nanocomposites in context.
Composites Science and Technology. 2005;65(3-4):491-516.
10. Ramoa SDAS, Barra GMO, Merlini C, Livi S, Soares BG, Pegoretti A. Novel electrically conductive polyurethane/ montmorillonite-polypyrrole nanocomposites. Express Polymer Letters. 2015;9(10):945-958.
11. Ramôa SDAS, Barra GMO, Merlini C, Schreiner WH, Livi S, Soares BG. Production of montmorillonite/polypyrrole nanocomposites through in situ oxidative polymerization of pyrrole: Effect of anionic and cationic surfactants on structure and properties. Applied Clay Science. 2015;104:160-167.
12. Shakoor A, Rizvi TZ, Hina M. Charge transport mechanism in intercalated polypyrrole aluminum-pillared montmorillonite clay nanocomposites. Journal of Applied Polymer Science. 2012;124(4):3434-3439.
13. Merlini C, Barra GMO, Cunha MDPP, Ramôa SDAS, Soares BG, Pegoretti A. Electrically conductive composites of polyurethane derived from castor oil with polypyrrole-coated peach palm fibers. Polymer Composites. 2017;38(10):2146-2155.
14. Merlini C, Barra GMO, Schmitz DP, Ramôa SDAS, Silveira A, Araujo TM, et al. Polyaniline-coated coconut fibers: Structure, properties and their use as conductive additives in matrix of polyurethane derived from castor oil. Polymer Testing. 2014;38:18-25.
15. Merlini C, Soldi V, Barra GMO. Influence of fiber surface treatment and length on physico-chemical properties of short random banana fiber-reinforced castor oil polyurethane composites. Polymer Testing. 2011;30(8):833-840.
16. Lopes RVV, Zamian JR, Resck IS, Sales MJA, Santos ML, Cunha FR. Physicochemical and rheological properties of passion fruit oil and its polyol. European Journal of Lipid Science and Technology. 2010;112(11):1253-1262.
17. Kassim A, Mahmud HNME, Adzmi F. Polypyrrole-montmorillonite clay composites: An organic semiconductor.
18. Boukerma K, Piquemal JY, Chehimi MM, Mravcáková M, Omastová M, Beaunier P. Synthesis and interfacial properties of montmorillonite/polypyrrole nanocomposites.
Polymer. 2006;47(2):569-576.
19. Gao JW, Li G, Yao YF, Jiang JM. Preparation and Characterization of Montmorillonite/Polypyrrole Nanocomposites by In-Situ Chemical Polymerization. Journal of Macromolecular Science, Part B: Physics. 2011;50(7):1364-1375.
20. Ramoa SDAS, Barra GMO, Merlini C, Livi S, Soares BG, Pegoretti A. Electromagnetic interference shielding effectiveness and microwave absorption properties of thermoplastic polyurethane/ montmorillonite-polypyrrole nanocomposites. Polymer Advanced Technologies. 2018;29(5):1377-1384.
21. Moucka R, Mravcáková M, Vilcáková J, Omastová M, Sáha P. Electromagnetic absorption efficiency of polypropylene/ montmorillonite/polypyrrole nanocomposites. Materials & Design. 2011;32(4):2006-2011.
22. Kirkpatrick S. Percolation and Conduction. Reviews of Modern Physics. 1973;45(4):574-588.
23. Ray SS, Okamoto M. Polymer/layered silicate nanocomposites: a review from preparation to processing. Progress in Polymer Science. 2003;28(11):1539-1641.