Contents lists available atScienceDirect
Journal of Chromatography A
j o u r n a l h o m e p a g e :w w w . e l s e v i e r . c o m / l o c a t e / c h r o m aComprehensive two-dimensional gas chromatography with time-of-flight
mass spectrometry combined with solid phase microextraction as a
powerful tool for quantification of ethyl carbamate in fortified
wines. The case study of Madeira wine
Rosa Perestrelo
a,b, Sílvia Petronilho
a, José S. Câmara
b, Sílvia M. Rocha
a,∗ aDepartamento de Química, Universidade de Aveiro, 3810-193 Aveiro, PortugalbCentro de Química da Madeira, Departamento de Química da Universidade da Madeira, Campus Universitário da Penteada, 9000-390 Funchal, Portugal
a r t i c l e i n f o
Article history:Received 10 February 2010
Received in revised form 12 March 2010 Accepted 16 March 2010
Available online 24 March 2010 Keywords: Ethyl carbamate Fortified wine Madeira wine HS-SPME GC× GC–ToFMS
a b s t r a c t
An analytical methodology based on headspace solid phase microextraction (HS-SPME) com-bined with comprehensive two-dimensional gas chromatography—time-of-flight mass spectrometry (GC× GC–ToFMS) was developed for the identification and quantification of the toxic contaminant ethyl carbamate (EC) directly in fortified wines. The method performance was assessed for dry/medium dry and sweet/medium sweet model wines, and for quantification purposes, calibration plots were performed for both matrices using the ion extraction chromatography (IEC) mode (m/z 62). Good linearity was obtained with a regression coefficient (r2) higher than 0.981. A good precision was attained (R.S.D. <20%) and low
detection limits (LOD) were achieved for dry (4.31g/L) and sweet (2.75 g/L) model wines. The quan-tification limits (LOQ) and recovery for dry wines were 14.38g/L and 88.6%, whereas for sweet wines were 9.16g/L and 99.4%, respectively. The higher performance was attainted with sweet model wine, as increasing of glucose content improves the volatile compound in headspace, and a better linearity, recovery and precision were achieved. The analytical methodology was applied to analyse 20 fortified Madeira wines including different types of wine (dry, medium dry, sweet, and medium sweet) obtained from several harvests in Madeira Island (Portugal). The EC levels ranged from 54.1g/L (medium dry) to 162.5g/L (medium sweet).
© 2010 Elsevier B.V. All rights reserved.
1. Introduction
Madeira wine is a fortified Portuguese wine made in Madeira Island over the last centuries, and plays an important role in the economy of the Island. The winemaking and ageing processes used for Madeira wines are unique. The fermentation process is stopped by the addition of natural grape spirit in order to obtain an ethanol content of 18–19% (v/v). Then, the wine is submitted to a baking process, i.e., the wine is placed in large coated vats and the temperature is slowly increased at about 5◦C per day and maintained at 45–50◦C for 3 months. After this treatment, the wine is allowed to undergo a maturation process in oak casks for a minimum of 3 years. Finally, some Madeira wines suffer an ageing process, from minimum of 3–20 years or longer, in cellars at 30–35◦C by sun influence, and a humidity degree higher than 70%[1]. Under these conditions, many reactions can occur
∗ Corresponding author. Tel.: +351 234401524; fax: +351 234370084. E-mail addresses:[email protected],[email protected](S.M. Rocha).
leading to significant changes in wine, some are crucial to the final remarkable characteristics of Madeira wine, however it may also cause production of ethyl carbamate (EC). According to Stevens and Ough[2], under fairly normal storage temperatures (13–24◦C), and not uncommon concentrations of urea (1–10 mg/L), a significant amount of EC will accumulate in wine.
EC, also known as urethane, is potentially toxic, and was re-classified in 2007 as probably human carcinogen compound (Group 2A) by the International Agency for Research on Can-cer (IARC) [3,4]. This compound occurs in many fermented foods (e.g. yoghurt, bread) and alcoholic beverages (e.g. wine, beer, whiskey)[3,5,6], being obtained from the reaction between ethanol and nitrogen-containing compounds (e.g. urea, citrulline, hydrogen cyanide, cyanogenic glycosides, and other N-carbamyl compounds), which has a moderate kinetic formation at room temperature. Nevertheless, not all nitrogen-containing compounds show the same kinetics when reacting with ethanol. For exam-ple, it has been demonstrated that EC formation from urea (which results from the degradation of arginine by yeasts) increases dramatically with temperature (for example in baking,
boil-0021-9673/$ – see front matter © 2010 Elsevier B.V. All rights reserved. doi:10.1016/j.chroma.2010.03.027
ing or toasting processes) [3,6,7], and more rapidly than from citrulline[8].
The study of toxic and carcinogenic substances in foods repre-sents one of the most demanding areas in food safety, due to their repercussions for public health. Apprehension related to EC occur-rence in alcoholic beverages arose in 1985, when relatively high levels were detected by Canadian authorities in brandies and others liquors[9,10]. Consequently, maximum level of EC was firstly estab-lished by Canada authorities for alcoholic beverages, according to the consumption patterns and ADI (acceptable daily intake) value evaluation: 30g/L for table wine, 100 g/L for fortified wines, 150g/L for distilled spirits, and 400 g/L for fruit brandies and liquors[11,12].
This regulation imposed by Canada to control the EC lev-els, appeared as a catalyst in the development of new methods. Several extraction methodologies have been used, such as con-tinuous liquid–liquid extraction[13], and solid phase extraction [7,14,15], combined with one-dimensional gas chromatography coupled with mass spectrometry detection (GC–MS). EC has been determined in fortified Madeira wines by SPE followed by GC–MS [15,16], and by derivatization with 9-xanthydrol, followed by high performance liquid chromatography (HPLC)[17]. More recently, a solvent-free methodology was used: solid phase microextraction (SPME)[9,18,19]. This methodology presents several advantages when compared with conventional solvent extraction procedures. SPME is rapid, easy to use, solvent-free, sensitive, and do not require any concentration step prior to analysis, preventing the produc-tion of artefacts[20]. The extraction step is followed mainly by GC–MS analysis[7,13,15,16]. To achieve the adequate sensitivity for EC detection, an injector equipped with a unit for large vol-ume injection[7], or MS-SIM (selected ion monitoring)[13,19]or MS–MS acquisition modes (GC–MS–MS)[9,14,21]were used. One-dimensional chromatographic processes are widely applied in the analysis of food products. In spite of the great separation power of conventional, one-dimensional modern chromatographic tech-niques, the accurate quantification of trace components requires a more sensitive methodology. Furthermore, deep analysis of the chromatograms frequently indicates that some peaks are the result of two or more co-eluting compounds. As a consequence of chromatographic co-elution, reliable MS identification and quan-tification is a very hard task[22], that can be overcome by tandem MS analysis [21]. Nevertheless, in the past years considerable research has been dedicated to the combination of independent methodologies with the aim of strengthening resolving power[23]. Comprehensive two-dimensional gas chromatography (GC× GC) that employs two orthogonal mechanisms emerged as an interest-ing alternative to analyse complex samples or analyse trace target analytes within a single analysis. The method is based on the appli-cation of two GC columns coated with different stationary phases, such as one apolar and one polar, connected in series through a spe-cial interface (modulator). The composition of the stationary phase of the first dimension is generally less polar than the one used in the second dimension, so that the separation is ruled by boiling point properties in the first and polarity in the second one[24,25]. Therefore, two-dimensional gas chromatography (GC× GC) offers faster run times, increased peak capacity, improved resolution and enhanced mass selectivity, good calibration linearity, more sensi-tivity and limits of detection are improved due to the focusing of the peak in the modulator when compared to the one-dimensional GC[24,26,27].
Since the second column produces peaks as narrow as 0.1 s, a detection technique must be fast enough to describe the peaks properly. This represents a problem for classical scanning mass spectrometers, which are capable of scanning rates up to 50 spectra/s. On the other hand, the high-speed time-of-flight mass spectrometry (ToFMS), with the maximum acquisition rates
of 500 spectra/s, provides sufficient data density to address the requirements of GC× GC separations [22]. Besides that, ToFMS brings other advantages compared to tandem MS analysis such as full mass spectra acquisition at trace level sensitivity and mass spectral continuity, which allows for deconvolution of spectra of co-eluted peaks. As far as we know, the GC× GC–ToFMS has not been applied in the determination of ethyl carbamate, namely in alcoholic beverages. EC is present in trace amounts (g/L), and the establishment of a suitable extraction procedure combined with an analytical methodology is an important challenge. Thus, the aim of this study is to develop a fast and simple methodology based on the headspace SPME (HS-SPME) combined with comprehensive GC× GC–ToFMS in order to quantify ethyl carbamate directly in the headspace of fortified wines. The performance of the methodology was evaluated in terms of linearity, limits of detection (LOD), limits of quantification (LOQ), precision and accuracy. Then, the method-ology was applied to the analysis of 20 fortified Madeira wines including different types of wine obtained from several harvests in Madeira Island (Portugal).
2. Materials and methods 2.1. Samples
Twenty monovarietal fortified Madeira wines, including differ-ent types of wine (dry, medium dry, sweet and medium sweet fortified wines), obtained from several harvests (1990–2006) were analysed. These wines were produced from different Vitis vinifera L. varieties (Tinta Negra, Sercial, Verdelho, Malvazia and Bual varieties). The samples were kindly provided by Madeira Wine Company, the most representative producer of Madeira wine, Madeira Island (Portugal). The ethanol content of the Madeira wines under study ranged from 17% to 19% (v/v).
2.2. Reagents and standards
Ethyl carbamate (99%) was purchased from Sigma–Aldrich (Madrid, Spain). A stock solution with 3.80 mg/L of EC was pre-pared in ethanol (99.5%, analytical grade, Panreac, Barcelone, Spain) and stored at 4◦C. The standard solutions, used to prepare the calibration curve, were prepared by dilution of stock solution in ethanol. Glycerol (99.5%) and glucose (99.5%) were purchased from Sigma–Aldrich Química S.A. (Madrid, Spain). Tartaric acid (foodstuff grade) and sodium chloride (99.5%, foodstuff grade) were pro-vided by José M. Vaz Pereira (Lisboa, Portugal) and Sigma–Aldrich (Madrid, Spain), respectively. Ultra pure water was obtained from a Milli-Q system from Millipore (Milford, MA, USA).
2.3. HS-SPME methodology
The SPME coating fibre and the experimental parameters were adopted from a methodology previously developed in our lab-oratory for wine analysis [28]. As previous tests indicated the potential of this methodology to detected EC, this methodology was adopted to EC determinations. According to Lachenmeier et al.[9], CW/DVB fibre present high extraction efficiency for EC, as nowadays this fibre is not commercially available, a SPME fibre presenting a wide range of applications, including the EC, was selected. The SPME holder for manual sampling and fibre were purchased from Supelco (Aldrich, Bellefonte, PA, USA). The SPME device included a fused silica fibre coating partially cross-linked with 50/30m divinylbenzene–carboxen–poly(dimethylsiloxane) (DVB/CAR/PDMS). DVB/CAR/PDMS coating (molecular weight ranging from 40 to 275) combines the absorption properties of the liquid polymer with the adsorption properties of porous particles, which contains macro (>500 Å), meso (20–500 Å) and microporous
(2–20 Å) and has bipolar properties. The mutually synergetic effect of adsorption and absorption of the stationary phase promotes a high retention capacity and, consequently, a higher sensitivity than fibres based on absorption (PDMS and PA). The SPME fibre was conditioned at 270◦C for 60 min in the GC injector, according to the manufacturer’s recommendations. Then, the fibre was daily conditioned for 10 min at 250◦C.
For HS-SPME assay, aliquots of 1 mL of sample (Madeira wine and model wine) were placed into a 5 mL glass vial. After the addi-tion of 0.5 g of NaCl and stirring (0.5× 0.1 mm bar) at 400 rpm, the vial was capped with a PTFE septum and an aluminium cap (Chro-macol, Hertfordshire, UK). The vial was placed in a thermostatted bath adjusted to 60.0± 0.1◦C for 5 min, and then the SPME fibre
was inserted in the headspace for 20 min. Each sample was anal-ysed, at least, in triplicate. Blanks, corresponding to the analysis of the coating fibre not submitted to any extraction procedure, were run between sets of three analyses.
2.4. GC× GC–ToFMS analysis
After the extraction/concentration step, the SPME coating fibre was manually introduced into the GC× GC–ToFMS injection port at 250◦C and kept for 3 min for desorption. The injection port was lined with a 0.75 mm I.D. splitless glass liner. Splitless injections were used (30 s). LECO Pegasus 4D (LECO, St. Joseph, MI, USA) GC× GC–ToFMS system consisted of an Agilent GC 6890N gas chro-matograph, with a dual stage jet cryogenic modulator (licensed from Zoex) and a secondary oven. The detector was a high-speed ToF mass spectrometer. An HP-5 30 m× 0.32 mm I.D., 0.25 m film thickness (J&W Scientific Inc., Folsom, CA, USA) was used as first-dimension column and a DB-FFAP 0.79 m× 0.25 mm I.D., 0.25 m film thickness (J&W Scientific Inc., Folsom, CA, USA) was used as a second-dimension column. The carrier gas was helium at a con-stant flow rate of 2.50 mL/min. The primary oven temperature was programmed from 40 (1 min) to 230◦C (2 min) at 10◦C/min. The secondary oven temperature was programmed from 70 (1 min) to 250◦C (3 min) at 10◦C/min. The MS transfer line tempera-ture was 250◦C and the MS source temperature was 250◦C. The modulation time was 6 s; the modulator temperature was kept at 20◦C offset (above primary oven). The ToFMS was operated at a spectrum storage rate of 125 spectra/s. The mass spectrom-eter was operated in the EI mode at 70 eV using a range of m/z 33–350 and the voltage was−1695 V. Total ion chromatograms (TIC) were processed using the automated data processing soft-ware ChromaTOF (LECO) at S/N threshold 10. Contour plots were used to evaluate the separation general quality and for manual peak identification. A signal-to-noise threshold of 50 was used. Two commercial databases (Wiley 275 and US National Institute of Science and Technology (NIST) V. 2.0 – Mainlib and Replib) were used. A mass spectral match factor, similarity >950, was used to decide whether a peak was correctly identified or not. Further-more, a manual inspection of the mass spectra was done, combined with the use of additional data, such as the retention index (RI) value. For the determination of the RI, a C8–C20n-alkanes series was
used.
2.5. Analytical plots
For quantification purposes, two analytical plots were per-formed for EC using two matrices with different glucose contents, representing the different types of fortified Madeira wines: 56.51 and 87.63 g/L for dry/medium dry and sweet/medium sweet for-tified wines, respectively (Table 1). From the stock solution of EC (3.80 mg/L), ethanolic standard solutions were prepared with the following concentrations: 25.50, 51.06, 102.42, 408.14, 765.46,
Table 1
Validation parameters for ethyl carbamate in headspace of dry/medium dry and sweet/medium sweet wine model solutions using HS-SPME/GC× GC–ToFMS methodology.
Parameters Wine model
Dry/medium dry Sweet/medium sweet
RI 842 1t R,2tR(s) 216, 5.064 Glucose (g/L) 56.51 87.63 Linear concentration range (g/L) 4.59–367.20 8.89–547.20 Calibration equation y = 530.37x + 25917.08 y = 503.22x + 12540.14 r2 0.981 0.991 LOD (g/L) 4.31 2.75 LOQ (g/L) 14.38 9.16 % recovery 88.6 (16) 99.4 (11) R.S.D. (%) 17.50 14.61
RI, retention index obtained through the modulated chromatogram; r2, correlation coefficients; LOD, limit of detection; LOQ, limit of quantification; R.S.D., repeatabil-ity, expressed as relative standard deviation (%).
1326.08 and 2040.07g/L for dry/medium dry, and 49.40, 76.32, 152.29, 418.17, 874.05, 1520.16, 3040.45g/L for sweet/medium sweet model wines. Model wines (total volume of 1 mL) with 18% (v/v), glycerol (5.1 g/L), glucose (56.51 or 87.63 g/L), tartaric acid (4.4 g/L), adjusted with NaOH at pH 3.5, and fortified with 180L of the EC ethanolic standard solutions previously described were prepared (seeTable 1for concentration range). Each one of these solutions were analysed by the HS-SPME/GC× GC–ToFMS method-ology reported above (Sections2.3 and 2.4).
Several analytical parameters of the proposed methodology were evaluated, such as linearity, limit of detection (LOD), limit of quantification (LOQ), precision (repeatability, expressed as relative standard deviation (R.S.D.)) and accuracy (recovery test). A mini-mum of seven concentration levels was used to build the analytical curve for both dry/medium dry and sweet/medium sweet wines. Linearity over the working range concentration was verified by regression analysis of total peak area vs concentration. The LOD and LOQ were defined as the lowest EC concentration with estimated peak height greater than 3 and 10 times of the noise levels (S/N >3 and 10), respectively. All the experiments were performed at least in triplicate. For recovery assay, dry and sweet wines were spiked with EC (97.14g/L), and six replicates of the original and spiked wines were done and analysed by HS-SPME/GC× GC–ToFMS. 3. Results and discussion
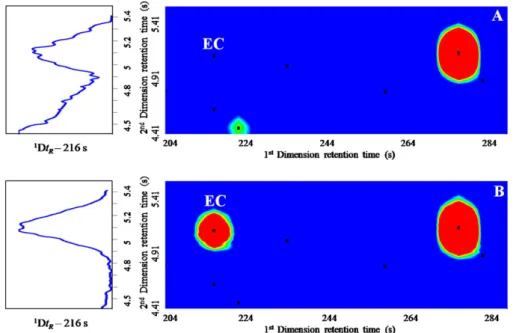
3.1. Quantification approach for assessment of ethyl carbamate Fig. 1shows the GC× GC total ion current (A) and extracted ion chromatogram contour plots of m/z 62 (B) obtained from Madeira wine, showing the corresponding EC spot (1Dt
R= 216 s; 2Dt
R= 5.064 s). The extracted ion chromatogram contour plot of m/z
62 (Fig. 1B) illustrates a good chromatographic resolution, no inter-fering peaks from other fortified wine components, and adequate trace level sensitivity. To assure the adequate detection and quan-tification of the target analyte, some strategies should be proposed, namely the use of the ion extraction chromatography (IEC) mode that increases the specificity and sensitivity. IEC allows the analy-sis of a global volatile profile by combining the spectral evidence with a target ion selection and retention time, thus minimizing the contribution of co-eluted compounds and increasing the peak area of the targeted compound[29]. This approach was combined with the developed HS-SPME/GC× GC–ToFMS methodology, which guarantees peak purity and selectivity.
For quantification of EC in fortified wine, calibration plots were performed using the IEC mode (m/z 62) for dry/medium dry and
Fig. 1. GC× GC total ion current (A) and extracted ion chromatogram contour plots of m/z 62 (B) obtained from Madeira wine, showing the corresponding ethyl carbamate spot (EC). The black points correspond to the peak markers.
sweet/medium sweet model wines, and the results are reported in Table 1. Good regression coefficients (r2) were obtained for
both analytical plots, 0.981 and 0.991 for dry/medium dry and sweet/medium sweet model wines, respectively. The limits of detection and quantification (LOD and LOQ) were calculated on the basis of the standard deviation of the replicate analyses concerning the EC standard with lowest concentration level, where LOD and LOQ are 3 and 10 times of standard deviation, respectively. There-fore, the LOD and LOQ were 4.31 and 14.38g/L for dry/medium dry model wines, whereas for sweet/medium sweet they were 2.75 and 9.16g/L, respectively. A lower LOD and LOQ values were obtained for sweet/medium sweet wine model solutions. The higher glucose content in this type of wines comparative to dry ones can explain these results, as a higher glucose content promotes the decreasing of EC solubility in wine (ethanolic/aqueous matrix), consequently increases its releasing to the headspace[30]. The LOD and LOQ val-ues, obtained for sweet/medium sweet model wines, were similar to those obtained by other authors employing HS-SPME/GC–MS-SIM (3 and 10g/L)[19]to determine EC in beers, red wines, white wines, grape brandies and Chinese rice wines. On the other hand, considerable higher LOD and LOQ values (30 and 110g/L) were obtained by Lachenmeier et al.[9]using HS-SPME/GC–MS–MS in stone-fruit spirits. These high values may be explained to the fact that stone-fruit spirits contain considerably higher levels of EC (in the mg/L range) and also contain much higher levels of alcohol, which interfere with SPME extraction, so that the samples have to be diluted. Furthermore, lower LOD and LOQ values (0.1 and 1g/L) were achieved by Jagerdeo et al.[7]to quantify EC table wines using SPE/LVI-MDGC–MS (solid phase extraction/large volume injection-multidimensional gas chromatography–mass spectrometry). This MDGC–MS is composed by two gas chromatographs and a mass spectrometer that allowed heart-cutting peaks of interest and disposal of the unwanted portion of the chromatogram. The heart-cutts of interest were then passed to the cryotrap and subsequently to the analytical GC for further separation and identification by the mass spectrometer. The previous selection of the heart-cutt of interest is a hard task, which is well addressed by the compre-hensive two-dimensional GC× GC combined with ToFMS, where the global sample components were analysed and good reso-lution, mass selectivity, and sensitivity are achieved. Thus, it is
important to point out that several methodological aspects are improved by the HS-SPME/GC× GC–ToFMS compared with pre-viously reported bibliography, such as (i) reduction in extraction and in GC analysis times, and (ii) ToFMS full-scan acquisition mode allowed more complete data compared to MS-SIM, and MS–MS. By GC× GC–ToFMS, full-scan acquisition mode was used that allows to achieve simultaneously data about the global volatile profile of wine plus the EC target analyte. The MS-SIM and MS–MS acqui-sition mode only permit the specific analysis of a target analyte related to the m/z selected ion.
In order to determine the accuracy of the analytical methodol-ogy, and to detect any matrix effect, the recovery efficiency was performed using the standard addition method, using dry and sweet Madeira wines. Both matrices were spiked with a known EC concentration (97.14g/L, final concentration of the wine), and the recoveries were 88.6% and 99.4%, for dry and sweet Madeira wines, respectively. Similar recoveries (92.8–94.3%) were obtained by Zhang and Zhang[19]. Finally, the precision of the methodol-ogy was determined by performing six consecutive extractions of the lower EC concentration (4.59 and 8.89g/L) in dry/medium dry and sweet/medium sweet model wines and the results, expressed as R.S.D., were 18% and 15%, respectively. Higher R.S.D. values were obtained for dry/medium dry wine model solutions, which can be associated to the lower glucose content. According to Robin-son et al.[30], a controlled increase in sugar content, improves the volatile compound in headspace partitioning without viscos-ity effect. Hence, a better linearviscos-ity, recovery and precision were expected in sweet/medium sweet model wines comparatively to dry/medium dry model wines.
3.2. Application to fortified wines
The validated analytical methodology was applied to quan-tify EC in 20 fortified Madeira wines: five dry, four medium dry, six sweet, and five medium sweet wines (Table 2). The EC levels obtained for dry and medium dry Madeira wines range from 54.1 to 146.2g/L, and for sweet and medium sweet wines from 64.2 to 162.5g/L. EC levels, in 50% of the Madeira wines under study, exceeded the international limit established by Canada (100g/L), and other country that adopted this guidelines (Czech Republic).
Table 2
Ethyl carbamate (EC) levels in fortified wines produced in Madeira Island.
Code Type of wine Year EC (g/L) R.S.D. (%)
A1 Dry 2006 86.2 17.84 A2 2004 66.6 12.52 A3 2004 141.5 3.41 A4 2001 146.2 13.03 A5 1999 125.8 14.58 A6 Medium dry 2004 91.1 9.59 A7 2004 134.9 7.11 A8 2001 58.1 18.09 A9 1999 54.1 18.34 A15 Sweet 2004 129.5 8.82 A16 1999 127.3 10.64 A17 1994 79.4 13.71 A18 1992 90.0 6.32 A19 2006 157.9 1.14 A20 2004 74.2 19.76
A10 Medium sweet 2004 83.6 8.58
A11 2004 108.2 8.27
A12 1999 64.2 12.38
A13 1993 162.5 8.89
A14 1991 135.9 11.42
These results are similar with other studies[31,32]carried out on fortified wines, where ca. 50% of the wines under study exceeded the international limit (100g/L). The same authors also analysed several table wines, and EC levels were under the respective limit (30g/L). These results suggest that winemaking procedure may influence the EC formation.
On average, the higher concentration of EC was accounted for dry (113.3g/L), medium sweet (110.9 g/L), and sweet fortified wines (109.7g/L), followed by medium dry (84.6 g/L) fortified Madeira wines. No significant relation was achieved between the EC level and the age of the wine. Considering the Madeira wine pro-cessing, several parameters should be considered, namely baking process (45–50◦C), barrel aging and grape brandy addition. Nev-ertheless, others parameters which effect the EC formation from nitrogen-containing compounds could be considered, namely pH, light, ethanol content, temperature, and concentration of catalytic metallic species (Cu(II), Fe(III))[3].
4. Concluding remarks
Comprehensive two-dimensional gas chromatog-raphy combined with solid phase microextraction (HS-SPME/GC× GC–ToFMS) is a potential useful tool for EC quantification directly in fortified wines that provides sig-nificant reduction in time of analysis compared to HPLC and one-dimensional GC methods. This methodology does not require a prior derivatization with 9-xanthydrol or any toxic solvent. The development of a methodology that allows the direct analysis of the sample without any previous handling is fundamental to avoid losses of analytes, and occurrence of artefacts. The use of GC× GC–ToFMS full-scan acquisition mode followed IEC mode allowed to achieve simultaneously quantification of EC target analyte, increasing specificity and sensitivity, and data about the global volatile profile of wine (in the present study, this data was not explored, but is available for future studies). The analytical methodology was validated using dry/medium dry and sweet/medium sweet wine models, and showed good results in
terms of linearity, LOD, LOQ, precision and accuracy. It is important to point out that better performance was attainted with sweet model wine, as increasing of glucose content improves the volatile compound in headspace, and a better linearity, recovery and precision was achieved.
The proposed methodology was applied to analyse 20 forti-fied Madeira wines. In the wines under study, EC levels ranged from 54.1 (medium dry) to 162.5g/L (medium sweet). The results showed that 50% of the analysed Madeira wines exceeded the inter-national limit established by Canada (100g/L) and other country that adopted these guidelines (Czech Republic). This data suggests the substantial role of the Madeira winemaking procedure on EC formation.
Acknowledgements
R. Perestrelo was supported by a Ph.D. grant from Fundac¸ão para a Ciência e Tecnologia (SFRH/BD/38855/2007). The authors thank the financial support of Research Unit 62/94, QOPNA, and Madeira Wine Company for kindly providing the samples used in this study. References
[1] J.S. Câmara, M.A. Alves, J.C. Marques, Anal. Chim. Acta 555 (2006) 191. [2] D.F. Stevens, C.S. Ough, Am. J. Enol. Viticult. 44 (1993) 309.
[3] J.V. Weber, V.I. Sharypov, Environ. Chem. Lett. 7 (2009) 233.
[4] D.W. Lachenmeier, F. Kanteres, T. Kuballa, M.G. López, J. Rehm, Int. J. Environ. Res. Public Health 6 (2009) 349.
[5] R.R. Madrera, B.S. Valles, Food Control 20 (2009) 139.
[6] I.C.C. Nóbrega, J.A.P. Pereira, J.E. Paiva, D.W. Lachenmeier, Food Chem. 117 (2009) 693.
[7] E. Jagerdeo, S. Dugar, G.D. Foster, H. Schenck, J. Agric. Food Chem. 50 (2002) 5797.
[8] S. Hasnip, A. Caputi, C. Crews, P. Brereton, Food Addit. Contam. A 21 (2004) 1155.
[9] D.W. Lachenmeier, U. Nerlich, T. Kuballa, J. Chromatogr. A 1108 (2006) 116. [10] C.A. Uthurry, F. Varela, B. Colomo, J.A. Suárez Lepe, J. Lombardero, J.R.G. Hierro,
Food Chem. 88 (2004) 329.
[11] S.M. Abreu, A. Alves, B. Oliveira, P. Herbert, Anal. Bioanal. Chem. 382 (2005) 498.
[12] S.N.F. Bruno, D.S. Vaitsman, C.N. Kunigami, M.G. Brasil, Food Chem. 104 (2007) 1345.
[13] C. Fauhl, R. Wittkowski, J. High Resolut. Chromatogr. Commun. 15 (1992) 203. [14] W.C. Bumley, B.J. Canas, G.A. Perfetti, M.M. Mossoba, J.A. Sphon, P.E.
Cor-neliussen, Anal. Chem. 60 (1988) 975.
[15] S. Hasnip, C. Crews, N. Potter, J. Christy, D. Chan, T. Bondu, W. Matthews, B. Walters, K. Patel, J. Agric. Food Chem. 55 (2007) 2755.
[16] M.A. Ferreira, J.O. Fernandes, Am. J. Enol. Viticult. 43 (1992) 339.
[17] P. Herbert, L. Santos, M. Bastos, P. Barros, A. Alves, J. Food Sci. 67 (2002) 1616. [18] R.S. Whiton, B.W. Zoecklein, Am. J. Enol. Viticult. 53 (2002) 60.
[19] Y. Zhang, J. Zhang, Anal. Chim. Acta 627 (2008) 212.
[20] F.M. Musteata, J. Pawliszyn, TrAC Trends Anal. Chem. 26 (2007) 36.
[21] D.W. Lachenmeier, W. Frank, T. Kuballa, Rapid Commun. Mass Spectrom. 19 (2005) 108.
[22] S.M. Rocha, E. Coelho, J. Zrostlíková, I. Delgadillo, M.A. Coimbra, J. Chromatogr. A 1161 (2007) 292.
[23] P.Q. Tranchida, P. Dugo, G. Dugo, L. Mondello, J. Chromatogr. A 1054 (2004) 3. [24] M. Herrero, E. Ibá ˜nez, A. Cifuentes, J. Bernal, J. Chromatogr. A 1216 (2009) 7110. [25] T. Górecki, O. Pani ´c, N. Oldridge, J. Liq. Chromatogr. Relat. Technol. 29 (2006)
1077.
[26] J. Zrostlíková, J. Hajˇslová, T. ˇCajka, J. Chromatogr. A 1019 (2003) 173. [27] S.M. Song, P. Marriott, A. Kotsos, O.H. Drummer, P. Wynne, Forensic Sci. Int. 143
(2004) 87.
[28] R. Perestrelo, J.M.F. Nogueira, J.S. Câmara, Talanta 80 (2009) 622.
[29] E. Coelho, M.A. Coimbra, J.M.F. Nogueira, S.M. Rocha, Anal. Chim. Acta 635 (2009) 214.
[30] A.L. Robinson, S.E. Ebeler, H. Heymann, P.K. Boss, R.S. Solomon, R.D. Heymann, J. Agric. Food Chem. 57 (2009) 10313.
[31] B.S. Clegg, R. Frank, B.D. Ripley, N.D. Chapman, H.E. Braun, M. Sobolov, S.A. Wright, Environ. Contam. Toxicol. 41 (1988) 832.