Analytical Methods
Dynamic headspace solid-phase microextraction combined with
one-dimensional gas chromatography–mass spectrometry as a powerful tool to
differentiate banana cultivars based on their volatile metabolite profile
Marisela Pontes, Jorge Pereira, José S. Câmara
⇑Centro de Química da Madeira, Centro de Ciências Exactas e da Engenharia, Universidade da Madeira, Campus Universitário da Penteada, 9000-390 Funchal, Portugal
a r t i c l e
i n f o
Article history:
Received 25 October 2010
Received in revised form 31 August 2011 Accepted 15 April 2012
Available online 21 April 2012
Keywords:
Banana cultivars
Solid-phase microextraction 1D-GC–qMS
Volatile organic metabolites Multivariate analyses
a b s t r a c t
In this study the effect of the cultivar on the volatile profile of five different banana varieties was evalu-ated and determined by dynamic headspace solid-phase microextraction (dHS-SPME) combined with one-dimensional gas chromatography–mass spectrometry (1D-GC–qMS). This approach allowed the def-inition of a volatile metabolite profile to each banana variety and can be used as pertinent criteria of dif-ferentiation. The investigated banana varieties (Dwarf Cavendish, Prata, Maçã, Ouro and Platano) have certified botanical origin and belong to the Musaceae family, the most common genomic group cultivated in Madeira Island (Portugal). The influence of dHS-SPME experimental factors, namely, fibre coating, extraction time and extraction temperature, on the equilibrium headspace analysis was investigated and optimised using univariate optimisation design. A total of 68 volatile organic metabolites (VOMs) were tentatively identified and used to profile the volatile composition in different banana cultivars, thus emphasising the sensitivity and applicability of SPME for establishment of the volatile metabolomic pat-tern of plant secondary metabolites. Ethyl esters were found to comprise the largest chemical class accounting 80.9%, 86.5%, 51.2%, 90.1% and 6.1% of total peak area for Dwarf Cavendish, Prata, Ouro, Maçã and Platano volatile fraction, respectively. Gas chromatographic peak areas were submitted to mul-tivariate statistical analysis (principal component and stepwise linear discriminant analysis) in order to visualise clusters within samples and to detect the volatile metabolites able to differentiate banana cul-tivars. The application of the multivariate analysis on the VOMs data set resulted in predictive abilities of 90% as evaluated by the cross-validation procedure.
Ó2012 Elsevier Ltd. All rights reserved.
1. Introduction
As aroma is one of the most appreciated fruit characteristics, volatile flavour compounds are likely to play a key role in deter-mining the perception and acceptability of products by consumers. Identification of key volatile flavour metabolites that carry the un-ique character of the natural fruit is essential, as it provides the principal sensory identity and characteristic flavour of the fruit (Augusto, Valente, dos Santos Tada, & Rivellino, 2000; Cheong et al., 2010; Navarro, De Lorenzo, & Perez, 2004).
Banana (genusMusaof the Musaceae family) is one of the most important crops in the world. According to the Food and Agricul-ture Organization of the United Nations (FAO) statistics estima-tions (Arias, Dankers, Liu, & Pilkauskas, 2003), the 10 major banana producing countries accounted for more than 75% of total banana production. Furthermore, India, China, the Philippines, Bra-zil and Ecuador alone produced more than 60% of total world
bana-na production. World exports of babana-nabana-nas also show a high level of concentration, with developing countries accounting for the bulk of exports. Only Latin America and the Caribbean supplied, in aver-age, about 70% of world exports. The four leading banana exporting countries in 2006 (Ecuador, Costa Rica, Philippines and Colombia) accounted for 64% of world exports with Ecuador alone provided more than 30% of global banana exports. From a consumer per-spective, the most appealing features of banana are their flavour, nutrition or health aspects and convenience for consumption ( Bou-dhrioua, Giampaoli, & Bonazzi, 2003). Is a fruit of high nutritional value, very rich in sugar, minerals, mainly potassium (very impor-tant to regulate blood pressure), magnesium, phosphorous, cal-cium, sodium, vitamins (C, pyridoxine and riboflavin, mainly) and dietary fibres (helpful to regulate bowel movement). Their typical aroma is characterised by the presence of a wide range of volatile metabolites, with different volatilities and concentrations, that can vary among the different cultivars, as the initial work of Cano and collaborators with Spanish and Columbian Enana cultivars showed (Cano et al., 1997). This volatiles belong to distinct chemical classes mainly ethyl esters (Jordan, Tandon, Shaw, & Goodner, 2001) and,
0308-8146/$ - see front matterÓ2012 Elsevier Ltd. All rights reserved.
http://dx.doi.org/10.1016/j.foodchem.2012.04.087
⇑ Corresponding author. Tel.: +351 291705112; fax: +351 291705149.
E-mail address:[email protected](J.S. Câmara).
Contents lists available atSciVerse ScienceDirect
Food Chemistry
to a lesser extent carbonyl compounds, monoterpenoids, C13-nori-soprenoids and furan compounds. According to Tressl et al., (Tressl & Albrecht, 1985) although the acetates and butyrate esters are the most abundant in bananas, some 3-methylbutyrate esters, 2-meth-ylpropionates and caproates are also produced in minor accounts. Acetates are of particular importance due to their high concentra-tions and low odour thresholds. The biosynthetic pathway for their formation in ripening climacteric fruits is well-established (Wyllie & Fellman, 2000; Yoshioka, Ueda, & Iwata, 1982). They are biosyn-thesized from long-chain fatty acid metabolism or formed by a complex group of chemical substances (e.g. aldehydes, alcohols, ketones, esters, lactones, terpenes), with a usually low concentra-tion (lg/L) and can be affected by a number of agronomical (variety, climatic conditions, ripening stage of the fruit) and tech-nological (harvest, post-harvest, treatments, storage and process-ing conditions) factors. However, these factors control the quantitative and qualitative composition of the ester profile, which in many cases determine the character and perceived quality of the fruits (Brat et al., 2004). Fruit esters also are formed by the reaction between alcohols and acyl CoA’s derived from both fatty acid and amino acid metabolism and are catalysed by the enzymeacyl alco-hol transferase(ATT) (Tressl & Drawert, 1973).
Boudhrioua et al. (2003)showed that 3-methylbutyl acetate, 3-methylbutyl butyrate and 3-methylbutyl-3-methyl butyrate, isoamyl acetate, pentan-2-one and isoamyl butyrate are character-istics of the geographic origin of the fruit. In addition, fatty acids, generated by the oxidative degradation of linoleic and linolenic acids, contribute to ester biosynthesis in fruit. Degradation of fatty acids results in the production of volatile aldehydes, which in turn are utilised by alcohol dehydrogenases generating alcohols, alde-hydes and branched/aromatic aliphatic acids. These compounds contribute, and in some cases are determining, to the primary aro-ma of aro-many fruits (Perez, Olias, Luaces, & Sanz, 2002). Moreover, some volatiles are particularly good indicators of the ripening stage of bananas. This is the case of hexanal and (E)-2-hexenal, charac-teristic of riped bananas, and isobutyl acetate and isopentyl ace-tate, more abundant in ripening bananas (Mayr, Märk, Lindinger, Brevard, & Yeretzian, 2003).
Increasing consumer demand for safety and nutritional excel-lence together with higher market competition underlines the importance of food analysis. This drives a need for analysts to devel-op rapid, reliable, less labour-consuming, and more accurate analyt-ical procedures. However, this is a daunting task as food stuffs contain a broad range of components. In the fruit-producing or -pro-cessing industry, good analytical methods are crucial to the success of any quality control during storage, processing, and/or product development studies. The most typically used methods for extrac-tion and pre-concentraextrac-tion are headspace techniques, purge-and-trap, liquid–liquid extraction, and simultaneous distillation and extraction. The majority of these methods present some drawbacks, such as the possibility of sample contamination, loss of analytes dur-ing the concentration step, it requires large amounts of toxic and expensive solvents that can be harmful to the operator and to the environment, are time-consuming and usually offers low recoveries. Considering the limitations of the traditional sampling tech-niques, headspace solid-phase microextraction (HS-SPME) emerges as an attractive alternative (Augusto et al., 2000). It is a solvent-free sample preparation technique that integrates sam-pling, isolation/extraction and concentration into a single uninter-rupted process, resulting in high sample throughput (Mendes, Gonçalves, & Câmara, 2012). Seems particularly appealing since it also eliminates problems associated with chemically and thermally unstable samples where generation of artefacts can be problem-atic. However, presents some disadvantages since (i) it works by equilibration thus gives incomplete recoveries; (ii) it only allows measurement of what partitions into the fibre phase; and (iii) it’s
partitioning is highly dependent on matrix. Nevertheless, its sim-plicity of use and fibre reusability had made SPME an attractive choice for many analytical applications (Coelho et al., 2008; Ferre-ira, Perestrelo, CaldeFerre-ira, & Camara, 2009; Ibáñez, López-Sebastián, Ramos, Tabera, & Reglero, 1998; Perestrelo, Nogueira, & Camara, 2009). In particular in combination with GC–MS, this technique have been largely used in environmental (Ternes, 1998), food ( Ca-mara, Alves, & Marques, 2006; Cheong et al., 2010; Pereira, Pereira, & Câmara, 2011; Pozo, Pueyo, Martin-Alvarez, & Polo, 2001), foren-sic (Chien, Uang, Kuo, Shih, & Jen, 2000; Kumazawa, Lee, Sato, & Su-zuki, 2003), pharmaceutical and biomedical (Deng, Li, & Zhang, 2004a; Deng, Zhang, & Li, 2004b; Silva, Passos, & Câmara, 2011, 2012) coffee (Risticevic, Carasek, & Pawliszyn, 2008) and biological (Moeder, Schrader, Winkler, & Popp, 2000) analysis.
The aim of the current research study is dedicated towards the development a simple, robust, reliable and solvent-free technique, without sample derivatization, based on the dHS-SPME combined with 1D-GC–qMS, in order to allow a qualitative and semi-quanti-tative screening of a broad range of VOMs in banana from different cultivars: Dwarf Cavendish, Prata, Maçã, Ouro and Platano, grow-ing at Madeira Island (Portugal), which could be used as cultivar markers. The main qualitative and semi-quantitative differences were established. In a previous step this work focuses on optimisa-tion of the most influencing factors of the dHS-SPME. The opti-mised method will be then applied to the analysis of real banana samples, after which the acquired data will be submitted to PCA statistical evaluation to establish an objective comparison among banana from different cultivars. To the best of our knowledge this is the first paper reporting the volatile composition of Prata (Musa balbisiana), Ouro (Musa paradisiaca), Maçã (Musa acuminate) and Platano (Musa paradisiaca) banana varieties growing at Madeira Is-land, as well as the first paper reporting differentiation among ba-nana cultivars based on their volatile metabolomic profile.
2. Material and methods
2.1. Chemicals and sample preparation
All chemicals used were analytical quality and all solvents were HPLC grade. Sodium chloride (99.5%) used to adjust the ionic strength (decrease the solubility of the VOMs which then partition more readily into the headspace improving the adsorption of ana-lytes by coating), was supplied by Merck (Darmstadt, Germany). Deionised water was obtained from Milli-Q water purification sys-tem (Millipore, Bedford, PA, USA). Then-alkanes mixture contain-ing C8–C20 straight-chain alkanes in hexane, and the internal standard, octan-3-ol, were purchased from Sigma–Aldrich (Spain). Helium, ultra-pure grade (Air Liquide, Portugal) was used as carrier gas in the GC system. The SPME fibre optimisation step was carried out by testing commercially available silica SPME fibres purchased from Supelco (Bellefonte, PA, USA) and coated with the following polymers: polydimethylsiloxane (PDMS, 100
lm), polyacrylate
(PA, 85lm), divinylbenzene/carboxen on polydimethylsiloxane
(DBV/CAR/PDMS; StableFlex, 50/30lm),
carboxen/poly-dimethylsiloxane (CAR/PDMS, 75lm) and polydimethylsiloxane/
divinylbenzene (PDMS/DVB, 65lm). Prior to their first use, all
fi-bres were conditioned according to the manufacturer’s instruc-tions by heating in the injection port of the GC. Before the initial application, blank runs were completed before each sampling to ensure no carry-over of analytes from the previous extraction. Clear glass screw cap vials for SPME with PTFE/silica septa were purchased from Supelco.room temperature during maturation. Fruits were selected at random, carefully hand-peeled, sliced and pureed at room temper-ature for 2 min in a blender to obtain a homogeneous paste. A small volume (1.5 mL) of methanol was sprayed onto the paste in order to avoid subsequent enzymatic activity. The banana puree was placed into glass vials and stored at 20°C until analysis. All
experiments and analytical determinations were carried out at least in triplicate.
2.2. dHS-SPME procedure
The handling of an SPME device is simple, and the analysis of volatile metabolites could be easy. However, the process becomes complex while analyzing sample matrices of heterogeneous nat-ure. The complexity also increases depending upon the nature of compounds to be extracted and matrix. Therefore, careful selection and optimisation of extraction parameters have to be undertaken to improve the sensitivity and the reproducibility of this method.
For this particular optimisation experiment Dwarf Cavendish banana was selected as the matrix. The analysis were carried out by placing 0.5 g portions of banana puree, previously homogenised, diluted with 1 mL ultra-pure water (Milli-Q) in a 4 mL headspace glass vial covered with a PTFE/silicone septum and containing a micro stirring bar (Supelco). As stirring of the solution usually im-proves the extraction, because the static layer resistant to mass transfer is destroyed (facilitate mass transport between the bulk of the aqueous sample and the fibre), all the experiments were per-formed under constant stirring velocity (750 min 1). After the addition of 0.3 g of NaCl, in order to improve the extraction effi-ciency by decreasing the solubility of hydrophilic metabolites in the aqueous phase and 1
lL of internal standard (octan-3-ol,
4.22 mg/L), the vials were immersed in a thermostat bath main-tained at the temperature selected for the extraction. Afterwards the SPME fibres were manually inserted into the headspace over the samples. In search of optimised conditions the (i) nature of the fibres; (ii) the exposure time (10–80 min) of the fibre to the headspace, and (iii) the extraction temperature, were tested and evaluated.After exposition period, the SPME fibres were withdrawn into the needle, removed from the glass vial and immediately inserted into the injection port of the gas chromatograph where the ex-tracted metabolites were thermally desorbed for 6 min and trans-ferred directly to the analytical column. Desorption temperatures, depending on the fibre used, 250°C for PDMS/DVB, PDMS and
Sta-bleFLex, 260°C for PA and 300°C for CAR/PDMS coating.
2.3. Selection of fibre coating
The polarity and volatility characteristics of the target metabo-lites are the primary issues addressed before selecting a fibre coat-ing. The most commonly used fibre coatings are: 100
lm PDMS;
65lm DVB/PDMS; 75
lm CAR/PDMS; and 85
lm PA.
Poly-dimethylsiloxane (PDMS) is the most widely used coating. The main advantage of using this coating is its ability to withstand high temperatures, up to about 300°C and its greater stability than CAR/PDMS and DVB/PDMS coatings. Another advantage of this fibre coating is its possibility of estimating the distribution constants for organic compounds from retention times on PDMS-coated GC columns.
In this step the extraction efficiency of five SPME fibres (Supe-lco, Bellefonte, USA), with different stationary phases and various film thicknesses, was evaluated and compared. The extraction pro-cedure is described in the above section. The extraction propro-cedures were carried out at 50°C for 40 min of exposure fibre (on all five
fibres). The analytes, being characterised by different volatilities and polarities, were selected across the GC chromatogram and
the total sum of their peak areas was used to select the SPME coat-ing havcoat-ing best performance characteristics. The 65
lm PDMS/DVB
coating fibre was found to give the best performance for the whole range of banana VOMs. Therefore this fibre was used in all further experiments. At least four replicates were done for each coating fibre.Different fibre coatings used influenced the chemical nature of the extracted metabolite depending on their characteristic polarity and volatility. In order to evaluate the effect of the nature of the fibre on the extraction efficiency of VOMs from bananas by dHS-SPME, and taking account the physical/chemical characteristics of the targets under consideration, a set of five coating fibres (CAR/PDMS, PDMS/DVB, PDMS, PA and StableFlex), covering a wide range of polarities and mechanisms, were used among those most routinely used for assaying volatiles. Each fibre was exposed to the headspace for the same time (40 min) at the same temperature (50°C). Blank runs were conducted between extractions with the
chosen fibre, to check for absence of carry-over which would cause memory effects and misinterpretation of results. All tests were carried out using the same banana cultivar (Dwarf Cavendish). The comparison of the SPME fibre performance was made in terms of extraction efficiency, number of identifiable metabolites in the extract and reproducibility.
2.4. Selection of extraction time and temperature
The extraction time profile was initially constructed at the extraction temperature of 50°C with 10, 20, 40, 60 and 80 min of
analysis isolation. An optimal extraction time of 60 min was se-lected for further studies. To select the temperature which gives the highest extraction efficiency, another experiment was carried out. A range of four different temperatures, 30, 40, 50 and 60°C
were tested using 60 min of analyses extraction. A temperature of 50°C was selected. Desorption time was 6 min and the GC liner
temperature varied according to fibre coating (Section2.2).
2.5. 1D-GC–MS analyses
The desorbed volatile metabolites were analysed in an Agilent Technologies 6890N Network gas chromatograph system (Palo Alto, CA, USA) equipped with a 30 m0.25 mm I.D., with a
0.25
lm film thickness, BP-20 fused silica capillary column, and
interfaced with an Agilent 5975 quadrupole inert mass selective detector. Helium (Helium N60, Air Liquid, Portugal) was used as carrier gas at a flow rate of 1 mL/min (column-head pressure: 89.6 kPa). The injector was operated in the splitless mode. The GC oven temperature program was set at an initial value of 40°C(1 min hold); increased to 150°C at 2.5°C/min, then raised to
220°C at 15°C/min and hold for 5 min (total GC run time of
54 min).
For the 5975 MS system, the temperatures of the transfer line, quadrupole and ionisation source were 270, 150 and 230°C
respectively; electron impact mass spectra were recorded at 70 eV ionisation voltages and the ionisation current was 10
lA.
The acquisitions were performed in Scan mode (35–300 m/z). The electron multiplier was set to the auto tune procedure. Agilent MS ChemStation Software, equipped with a NIST05 mass spectral library was employed for identification of the volatile metabolites extracted from real samples. A series of C8–C20n-alkanes were ana-lysed by dHS-SPME/1D-GC–qMS to establish the retention indices (RI), in order to tentatively identify the compounds by comparison with the literature. The relative amounts of individual metabolites are expressed as percent peak areas relative to the total peak area (RPA(%) =Ai/RAi100), where Ai is the GC peak area of iIdentification of volatile metabolites was achieved by: (1) com-parison of the mass spectrometric data and chromatographic retention of authentic standards, when available, (2) comparison the Kovats retention index (RI) value, which was determined according to the Van den Dool and Kratz RI equation (Van Den Dool & Kratz, 1963), and (3) similarity of mass spectrometric data. As generated by the NIST, 2005 software (Mass Spectral Search Pro-gram V.2.0d; NIST 2005, Washington, DC). For the determination of the RI, a C8–C20n-alkanes series was used, and the values were compared, when available, with values reported in the literature for similar chromatographic columns (Bianchi, Careri, Mangia, & Musci, 2007; Brat et al., 2004; Hognadottir & Rouseff, 2003). More than 60 VOMs distributed by different chemical groups were iden-tified to profile the global signature of the banana cultivars under study. In order to evaluate quantitative differences in the aromatic profile of the samples investigated, GC peak areas were calculated as total ion current for all the analytes.
2.6. Statistical analysis
Significant differences among banana cultivars were deter-mined by one-way analysis of variance (Anova) using a SPSS Pro-gram, version 16.0 (SPSS Inc., 2008). Principal component analysis (PCA) was performed using the same SPSS program. This technique was applied to the normalised total peak areas from dif-ferent chemical classes.
Principal component analysis (PCA) is an unsupervised tech-nique that reduces the dimensionality of the original data matrix retaining the maximum amount of variability (Forina, Armanino, Castino, & Ubigli, 1986), allowing the visualisation of the different banana cultivars in a two-dimensional space and identifying the directions in which most of the information is retained. It is there-fore possible to explain the differences between several cultivars by means of factors obtained from the data sets and, at the same time, to determine which variables contributed the most for such differences.
Stepwise linear discriminant analysis (SLDA) probably the most widely applied supervised pattern recognition method, searches for directions (discriminant functions) which achieve maximum separation among categories by maximising between the class variance relative to the within-class variance. SLDA renders a number of orthogonal linear discriminant functions equal to the number of categories minus one. This method minimises the var-iance within categories and maximises the varvar-iance between cat-egories (Powers & Keith, 1968). The variables included in the analyses are determined with a stepwise-LDA using a Wilk’s Lambda as a selection criterion and anFstatistic factor to establish the significance of the changes in Lambda when a new variable is tested. The prediction capacity of the discriminant models was studied by ‘‘cross-validation’’ in order to determine the stability of the model.
3. Results and discussion
The sequence followed in this study consisted of two steps. The first focused on obtaining the best experimental conditions to ex-tract VOMs from banana of different cultivars by dHS-SPME proce-dure combined with 1D-GC–qMS. In the second step an objective comparison among the investigated banana cultivars has been established in terms of qualitative and semi-quantitative differ-ences on volatile composition by using the optimised conditions. Different volatile patterns were observed according to banana cul-tivars. Among other metabolite classes, ethyl esters, acetates, iso-amyl esters, alcohols and phenols, were identified.
3.1. Optimisation of SPME conditions
To optimise dHS-SPME method some parameters controlling the performance of the extraction efficiency were taken into ac-count. This process has been conducted by considering one param-eter at a time keeping all other variables constant (univariate experimental design).
3.2. Evaluation of the fibre
The nature of the fibre is an important aspect for the pre-con-centration of the VOMs in Dwarf Cavendish banana since each fibre shows a different extraction profile. The volatile compounds iden-tified using the five fibres on the same Dwarf Cavendish sample, in rigorously reproduced temperature and exposure time conditions and the relative extraction efficiencies of the tested fibres are sum-marised inTable 1.
Altogether 64 VOMs were extracted and identified on the basis of their mass spectra (MS) and retention indices (RI) (Table 1). These included ethyl esters, isoamyl esters, acetates, higher alco-hols, ketones and phenols. The qualitative composition of banana volatiles and the number of identified metabolites using the five fi-bres under study is very different (Table 1).
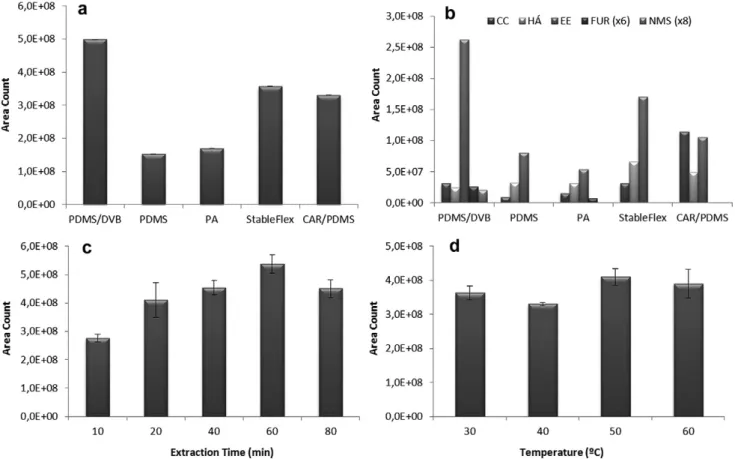
A comparison among the fibre’s performance is relative since it would have to be performed in the optimised conditions to each fi-bre. Nevertheless, among the five fibres, it clearly shows (Fig. 1a) that the semi-polar PDMS/DVB fibre, made of a mixture of solid DVB polymers coated with a PDMS liquid polymeric film, exhibited the highest efficiency in the extraction process of the banana VOMs, extracting around three times more than PA and PDMS, and around 1.5 times more than StableFlex and CAR/PDMS fibres. Similar amounts of volatiles (30.8–34.2%) were extracted by PDMS and PA fibres coating while 66.1–71.6% were extracted when using CAR/PDMS and StableFlex coatings. Based on the data evaluation completed within this particular optimisation experiment, PDMS/ DVB fibre provided the best sensitivity in terms of total compound peak areas, number of isolated metabolites (51) and high reproduc-ibility (lower than 7%), and therefore was utilised in all further optimisation/real analyses experiments.
Fig. 1b, illustrated that the fibres show different selectivity to volatile metabolites. PDMS/DVB coating have a larger affinity for ethyl esters (EE), furan compounds (FUR) and norisoprenoids/mon-oterpenoids/sesquiterpenoids (NMS) compounds. CAR/PDMS fibre shown to be relevant for the extraction of carbonyl compounds (CC) whereas StableFlex coating affords a higher extraction for higher alcohols (HA). According toFig. 1b, independent of the em-ployed fibre, ethyl esters (EE) showed the most intense signals which suggest that ethyl esters might be VOMs with higher concentrations.
3.3. Influence of extraction temperature and time
The extraction temperature and the exposure time of the fibre to the headspace are two important factors that control sample recovery by the fibres and consequently, must be studied in order to establish the optimum extraction conditions.
Table 1
Comparison of the relative extraction efficiencies of different SPME coatings for VOMs extraction from Dwarf Cavendish cultivar.
Peak number RTa(min) RIb Metabolite SPME fibre type
PDMS/DVBc PDMS PA StableFlex CAR/PDMS
2 2.408 906 Ethyl acetate 25 8 – 38 100
2.656 928 3-Methyl-butanal 100
3 3.333 979 Pentan-2-one 83 15 23 73 100
4 3.882 1013 Isobutyl acetate 100 20 20 44 31
5 4.287 1035 Ethyl butyrate 100 18 51 84
4.997 1070 Butyl acetate 100 34 22 67 81
8 5.206 1079 Hexanal 85 32 21 100 –
9 5.399 1087 2-Methyl-2-methylpropyl propanoate 97 – – 100 –
5.677 1098 2-Methyl propan-1-ol 100 – – 88 –
10 6.258 1120 Isoamyl acetate 100 35 25 58 42
11 6.569 1131 Pentan-2-ol – – – – 100
6.971 1144 Butyl isobutyrate 100 – – – –
7.062 1147 Butan-1-ol 68 – – – 100
12 7.386 1157 2-Methylpropyl butyrate 100 20 22 57 38
7.925 1173 2-Methyl-2-methylpropyl butyrate 100 – – 51 46
8.135 1179 Heptan-2-one 100 – – 66 86
14 8.481 1188 Isoamyl butyrate 100 – – 44 28
16 8.582 1191 2-Methyl-3-methylbutyl propanoate 100 – – – –
8.635 1192 4-Methyl heptane – – – 100 –
8.716 1194 2,3-Dimethyl hexane – – 100 – –
18 9.142 1204 3-Methylbutan-1-ol – 21 – 100 –
19 9.334 1206 1-Methylbutyl butyrate 100 11 – – –
21 9.494 1209 Butyl butyrate 37 10 10 28 100
10.017 1216 2-Methylpentyl butyrate 100 – – – –
10.720 1226 Isoamyl butyrate 5 100 – 2 2
10.841 1228 5-Hepen-2-one
11.385 1235 2-Methyl-3-methylbutyl propanoate – – 50 – 100
25 11.394 1236 3-Methylbutyl butyrate 100 – – 79 –
26 11.746 1239 Hexyl acetate 100 33 21 66 79
28 11.920 1241 2-Methyl-3-methylbutyl butyrate 100 39 34 87 66
30 12.730 1251 3-Methyl-3-methylbutyl butyrate 100 43 24 83 51
13.335 1258 (Z)-4-hexen-1-yl acetate – 100 – – –
31 13.544 1260 3-Hepten-1-yl acetate 100 – – – –
14.459 1269 (E)-3-methyl-1,3-pentadiene – – – 100 –
32 14.865 1273 (E)-4-hexen-1-yl acetate 100 – – 62 12
33 15.466 1279 Hexan-1-ol 100 54 38 97 68
15.469 1279 4-Methyl pentan-1-ol 100 – – – –
15.731 1281 3-Methylbutyl pentanoate 100 – – 99 –
17.999 1402 (E)-2-hexen-1-ol 100 – – 154 –
36 18.343 1410 Hexyl butyrate 100 38 – 87 82
18.890 1424 (Z)-4-hexen-1-ol – 100 – – –
18.986 1424 (E)-3-hexen-1-ol 93 – – 100 71
19.791 1442 3-Methylhexyl butyrate 100 47 33 86 81
37 19.987 1446 (Z)-2-Methyl cyclohexyl butyrate 100 47 – 83 82
38 20.428 1455 Isopentyl hexanoate 100 50 – 90 55
20.621 1459 Acetic acid – – – – 100
20.627 1459 Furfural 100 – – – –
40 21.791 1482 4-Hexen-1-yl butyrate 100 36 33 79 68
41 22.794 1500 Ethenyl cyclohexane 100 33 35 68 77
23.504 1516 Heptan-4-one 14 – 23 100 48
23.729 1521 2-Methylbutyl isobutyrate 100 – – 77 65
45 25.553 1559 Cycloocta-1,3-diene 100 – – – 53
25.592 1560 3-Ethenyl cyclohexene – 100 – – –
46 27.312 1594 3-Methyl bicyclo[4.1.0]heptane 100 – – – –
27.763 1603 Hexyl hexanoate – 100 – – –
47 28.439 1618 2-Methyl-1-methyl butyl propanoate 100 – – – 39
48 32.414 1702 2-Methyl ethyl propanoate 100 – – – –
34.890 1759 2-Methyl-1-nonen-3-one 100 – – – –
46.312 2028 Octanoic acid 100 – – – –
50 46.430 2030 5-Hydroxymethylfurfural 100 – – – –
51 46.717 2037 1,3-Dihydroxypropan-2-one 100 – – – –
47.907 2063 Eugenol 100 – – – 15
52 48.695 2080 Elemicin 100 44 85 48 48
53 49.156 2090 DDMPd 100 – 81 – –
Total compounds per fibre 51 28 19 36 34
a Retention time.
b Experimentally determined retention indices on the BP-20 column, relative to C
8–C20hydrocarbons. c The extraction efficiency of the PDMS/DVB fibre was set as 100%.
d DDMP: 2,3-dihydro-3,5-dihydroxy-6-methyl-4H-pyran-4-one.
extraction temperature on SPME extraction efficiency, PDMS/DVB fibre was exposed to the headspace at four different temperatures 30, 40, 50 and 60°C, for 60 min. The results of triplicate
experi-ments are summarised inFig. 1c. In general, as the temperature in-creases, the recovery of volatile compounds improves, since heating of solid samples help to release analytes into the head-space and facilitate the SPME process. The best recovery of vola-tiles was obtained at 50°C.
The time that the fibre was in contact with the headspace of the sample, had a significant effect on the chromatographic peak areas of the extracted metabolites, as is apparent from Fig. 1d. The adsorption time was evaluated by exposing the fibre into the head-space between 10 and 80 min (10, 20, 40, 60 and 80 min) at 50°C.
The influence of the fibre exposure time on the yield of microex-traction is displayed inFig. 1d.
For most metabolites the extraction efficiency increased with the extraction time, during the first 60 min of the fibre exposure decreasing thereafter (Fig. 1d). An exposure time of 60 min was chosen because fibre exposure times longer than 60 min were too long and the differences in response between 60 and 80 min were less than 10%. Taking these results into account the best re-sults were obtained using an extraction time of 60 min at 50°C.
3.4. Analyses of volatile metabolites in different banana cultivars
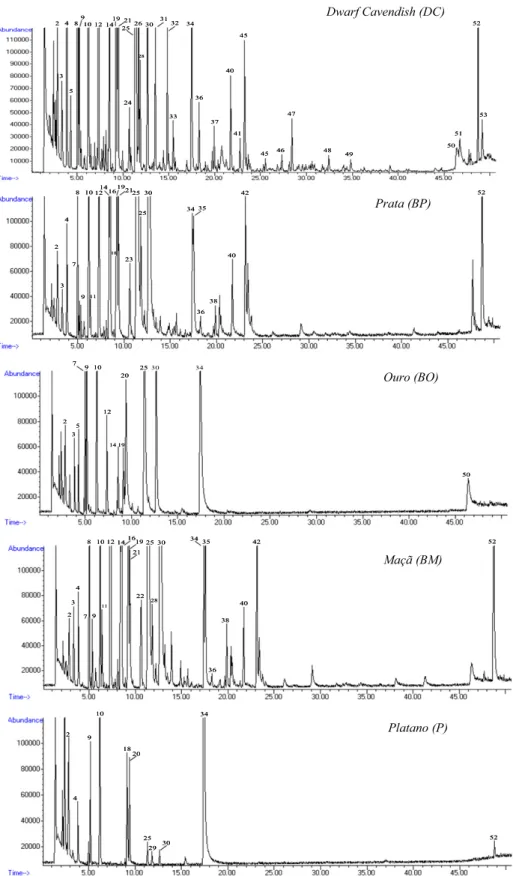
The optimised technique was applied to different banana culti-vars taken from commercial sources. Each banana sample was ana-lysed four times using the optimised extraction conditions described above (PDMS/DVB fibre; 50°C; 60 min; salt addition with
continuous stirring). A typical total ion current (TIC) chromatogram of the volatile constituents from different banana varieties
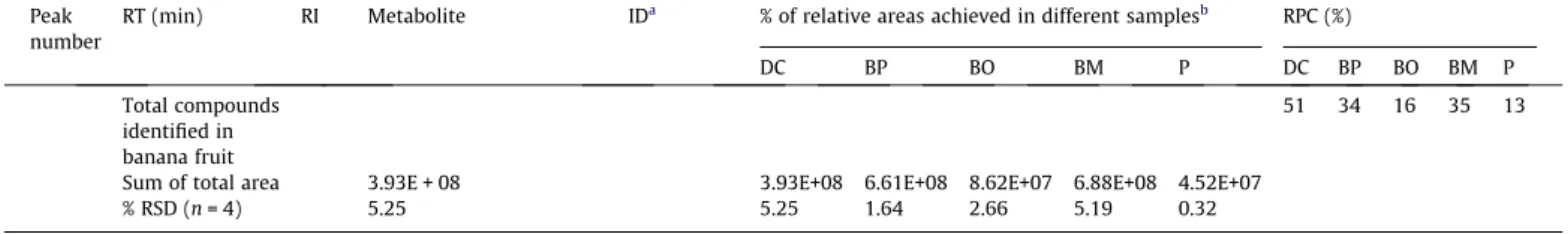
extracted by dHS-SPME is shown inFig. 2. The technique used made it possible to identify 68 VOMs in the investigated banana cultivars. The identified volatile metabolites are shown inTable 2where are listed in order of their elution on the BP-20 column together with their retention indices and percentage of relative area. Most of the volatile metabolites were tentatively identified by a library search NIST05. In some cases a comparison with authentic com-pounds was performed. The retention indices were calculated for each peak and compared with the literature in order to ensure the correct identification of the metabolites.Table 2summarises the average (n= 4) relative composition observed in the headspace of bananas from different cultivars studied. As previously reported to the common export banana cultivar Gran Enano, there is a great diversity in the aroma composition of bananas in different ripening stages and even in bananas in the same ripening stage treated or not with ethylene (Vermeir, Hertog, Vankerschaver, Swennen, Nic-olaï, & Lammertyn, 2009).
The relative composition of each flavour compound was calcu-lated as the percent ratio of the respective peak area relative to the total peak area (RPA,%) and relative to the compound with highest peak area (RPC,%) for each banana cultivar. Although com-parison of GC profiles showed qualitative differences, the quantita-tive relationship among different compounds in any flavour fraction may have a drastic effect on final aroma. In this sense, the headspace composition of cv. DC showed a richer aroma pro-file, with a higher number of metabolites contributing to the over-all aroma intensity.
According to their chemical structure, the compounds can be classified as monoterpenoids/C13-norisoprenoids (NMS), higher alcohols (HA), ethyl esters (EE), carbonyl compounds (CC) and fur-an compounds (FUR).
Fig. 1.Optimisation of the extraction-influencing factors which affect the efficiency of dHS-SPME: (a) effect of SPME fibre coating; (b) performance of SPME coatings on the extraction efficiency of higher alcohols (HA), carbonyl compounds (CC), ethyl esters (EE), furan compounds (FUR), and C13-norisoprenoids/monoterpenes/sesquiterpenes
2 4 3 8 9 10 12 14 19 21 16 2530
25 23 34 35 42 40 52 7 11 18 36 38 2 4 3 8 9 10 12 14 19 21 16 2530
25 23 34 35 42 40 52 7 11 18 36 38 2 14 3 5 10 25 12 20 7 9 50 19 2 14 3 5 10 25 12 20 30 34 7 9 50 19 2 9 4 10 18 20 25 29 30 34 52 2 9 4 10 18 20 25 29 30 34 52 2 4 3 8 16 11 14
10 12 25 3435
22 30 21 19 42 38 52 40 36 28 79 2 4 3 8 16 11 14
10 12 25 3435
22 30 21 19 42 38 52 40 36 28 79 Prata (BP) Ouro (BO) Maçã (BM) Platano (P) Dwarf Cavendish (DC) 2 4
3
5 8
9 10 12 1419 21
24 2526 28 30 31 32 33 34 36 37 40 45 41 46 47 48 49 51 52 53 45 50 2 4 3 5 8 9 10 12 1419 21
24 2526 28 30 31 32 33 34 36 37 40 45 41 46 47 48 49 51 52 53 45 50
Fig. 2.Representative chromatograms (fingerprint signals) obtained from the dHS-SPMEPDMS/DVB/1D-GC–qMS analysis of five samples corresponding to different banana
cultivars (Textraction: 50°C; textraction: 60 min; NaCl 0.3 g; 750 min1). Peak Identification:2:ethyl acetate;3:pentan-2-one;4:isobutyl acetate;5:ethyl butyrate;7:pentyl acetate;
8:hexanal;9:2-methyl-2-methylpropyl propanoate;10:isoamyl acetate;11:pentan-2-ol;12:2-methylpropyl butyrate;14:isoamyl butyrate;16:2-methyl-3-methylbutyl propanoate;18:3-methyl butan-1-ol;19:1-methylbutyl butyrate;20:(E)-hexen-2-al;21:butyl butyrate;22:2-pentyl pentanoate;23:butyl pentanoate;24:hexyl valerate;25: 3-methylbutyl butyrate;26:hexyl acetate;28:2-methyl-3-methylbutyl butyrate;29:2-methyl pyrrolidine;30:3-methyl-3-methylbutyl butyrate;31:3-hepten-1-yl acetate; 32:4-hexen-1-yl acetate;33:hexan-1-ol;34:octan-3-ol (Internal Standard);35:1-methylhexyl butyrate;36:hexyl butyrate;37:2-methylcyclohexyl butyrate;38:isopentyl
hexanoate;40:4-hexen-1-yl butyrate;41:ethenyl cyclohexane;45:cycloocta-1,3-diene;46:3-methyl bicycle[4.1.0] heptane;47:ethane-1,1-diol dibutyrate;48:ethyl isobutyrate;49:2-methyl-1-nonene-3-yene;50:5-hydroxymethylfurfural;51:1,3-dihydroxypropan-2-one;52:elemicin;53:2,3-dihydro-3,5-dihydroxy-6-methyl-4-pyrone.
Table 2
Volatile metabolites identified in banana fruits from different cultivars after dynamic dHS-SPMS/1D-GC-qMS using PDMS/DVB coating (extraction temperature: 50°C; extraction
time: 60 min; 750 min 1; 0.3 g NaCl).
Peak number
RT (min) RI Metabolite IDa % of relative areas achieved in different samplesb RPC (%)
DC BP BO BM P DC BP BO BM P
2 2.408 906 Ethyl acetate S, MS 0.82 – 4.64 – 19.59 36 – 45 – 100
3.193 969 n-Propyl acetate S, MS – – – – 1.87 – – – – 100
3 3.333 979 Pentan-2-one S, MS 0.93 0.34 1.98 0.36 – 100 61 47 67 –
4 3.882 1013 Isobutyl acetate S, MS 4.73 0.57 – 0.31 3.46 100 20 – 12 8
5 4.287 1035 Ethyl butyrate S, MS 0.54 – 2.47 – – 99 – 100 – –
4.883 1064 3-Methylethyl butyrate S, MS – – 0.68 – – – – 100 – –
4.915 1066 Butyl acetate S, MS 5.34 – – – 0.36 100 – – – 2
7 4.971 1068 2-Pentyl acetate S, MS – 0.73 1.72 0.56 – – 100 31 79 –
8 5.173 1079 Hexanal S, MS 1.70 0.18 5.91 0.03 8.63 100 18 76 3 58
9 5.399 1087 MMPPc MS 0.26 0.12 – 0.21 – 70 55 – 100 –
5.677 1098 2-Methyl propan-1-ol S, MS 0.22 0.15 – 0.15 – 84 97 – 100 –
10 6.258 1120 Isoamyl acetate S, MS 19.34 2.52 1.77 0.21 27.61 100 22 2 2 16
11 6.360 1124 Pentan-2-ol S, MS – 0.22 – 0.39 – – 55 – 100
6.971 1144 Butyl isobutyrate MS 0.18 – – – – 100 – – – –
7.062 1147 Butan-1-ol S, MS 0.18 – – – – 100 – – – –
12 7.386 1157 2-Methylpropyl butyrate MS 5.66 3.40 3.15 2.88 – 99 100 12 88 –
7.925 1173 2M2MPBd MS 0.22 0.07 – 0.05 – 100 51 – 37 –
8.135 1179 Heptan-2-one S, MS 0.29 0.12 – 0.14 – 100 70 – 84 –
14 8.481 1188 Isoamyl butyrate MS 2.71 2.55 2.78 0.88 – 7 100 2 36 –
16 8.582 1191 MMPBe MS 1.43 0.34 2.44 2.53 0.86 32 36 12 100 2
18 9.142 1203 3-Methyl butan-1-ol S, MS – 2.55 3.56 – 11.41 – 100 18 – 28
19 9.334 1206 1-Methylbutyl butyrate MS 3.95 3.48 1.40 8.16 – 28 41 2 100
20 9.406 1207 (E)-hexen-2-al S, MS – – 11.81 – 11.48 – – 100 – 51
21 9.494 1209 n-Butyl butyrate S, MS 7.41 1.09 – 0.90 – 100 25 – 21 –
10.017 1216 2-Methylpentyl butyrate S, MS 0.16 – – – – 100 – – – –
22 10.560 1224 2-Pentyl pentanoate S, MS – – – 0.33 – – – – 100 –
23 10.635 1225 n-Butyl pentanoate S, MS – 0.59 – – – – 100 – – –
24 10.639 1225 Hexyln-valerate S, MS 0.33 – – – – – – – 100 –
25 11.394 1235 3-Methylbutyl butyrate S, MS 28.30 37.85 50.01 34.35 – 1 100 17 55 –
26 11.746 1239 Hexyl acetate S, MS 1.53 – – – – 100 – – – –
11.832 1240 DMEHPf MS – 0.92 – – – – 100 – – –
28 11.920 1241 MMBBg MS 0.93 – – 0.46 – 100 – – 87 –
29 11.932 1240 2-Methyl pyrrolidine MS – – – – 0.59 – – – – 100
30 12.730 1251 3M3MBBh MS 2.75 32.02 4.57 34.23 0.88 5 90 2 100 5
13.152 1256 2-Methylbutyl butyrate S, MS – – – 0.32 – – – – 100 –
31 13.544 1260 3-Hepten-1-yl acetate S, MS 1.45 – – – – 100 – – – –
13.907 1264 Heptan-2-ol S, MS – 0.27 – 0.34 – – 76 – 100 –
32 14.865 1273 4-Hexen-1-yl acetate S, MS 1.38 – – – – 100 – – – –
15.26 1277 Butyl hexanoate S, MS – – – 0.05 – – – – 100 –
33 15.466 1279 Hexan-1-ol S, MS 0.49 – – – – 100 – – – –
15.643 1281 3M2MBBi MS – 0.19 – – – – 100 – – –
15.731 1281 3-Methylbutyl pentanoate MS 0.13 – – 0.10 – 72 – – 100 –
35 17.526 1297 1-Methylhexyl butyrate MS – 1.27 – 1.97 – – 62 – 100 –
17.999 1402 (E)-2-hexen-1-ol S, MS 0.08 – – – – 100 – – – –
36 18.343 1410 Hexyl butyrate S, MS 0.60 0.22 – 0.12 – 100 63 – 34 –
18.986 1424 (E)-3-hexen-1-ol S, MS 0.09 – – – – 100 – – – –
19.791 1442 3-Methylhexyl butyrate MS 0.19 0.08 – 0.09 – 100 72 – 89 –
19.879 1443 3-Methyl cyclohexanol S, MS – 0.22 – 0.46 – – 45 – 100 –
37 19.987 1446 MCHBjbutyrate MS 0.42 – – – – 100 – – – –
38 20.428 1455 Isopentyl hexanoate S, MS 0.11 0.29 – 0.33 – 20 85 – 100 –
20.627 1459 Furfural S, MS 0.36 – – – – 100 – – – –
40 21.791 1482 4-Hexen-1-yl butyrate S, MS 0.98 0.66 – 0.66 – 85 97 – 100 –
41 22.794 1500 Ethenyl cyclohexane MS 0.33 – – – – 100 – – – –
23.118 1508 4-Hexen-1-yl pentanoate MS – 1.24 – 1.61 – – 74 – 100 –
42 23.383 1514 Linalool S, MS – 0.79 – 0.45 – – 100 – 59 –
23.504 1517 Heptan-4-one S, MS 0.19 – – 0.26 – 42 – – 100 –
23.629 1524 Cyclooctene MS 0.18 – – – – 100 – – – –
23.736 1531 (Z)-2-hexenyl butyrate MS – 0.26 – 0.36 – – 70 – 100 –
45 25.553 1559 Cycloocta-1,3-diene S, MS 0.13 – – – – 100 – – – –
46 27.312 1594 MBCHl MS 0.22 – – – – 100 – – – –
47 28.439 1618 2M1MBPm S, MS 0.60 – – – – 100 – – – –
48 32.414 1702 MEPn S, MS 0.22 – – – – 100 – – – –
46.312 2028 Octanoic acid S, MS 0.28 – – – – 100 – – – –
50 46.43 2030 5-Hydroxymethylfurfural S, MS 0.67 – 3.54 – 11.74 49 – 58 – 100
51 47.725 2059 DHPo MS – 0.66 – – – – 100 – – –
47.907 2063 Eugenol S, MS 0.64 0.13 – – – 100 34 – – –
52 48.695 2080 Elemicin MS 1.61 3.27 – 5.41 1.73 17 58 – 100 2
The highest amount of volatile metabolites was obtained in ba-nanas from Prata and Maçã cultivars, followed by Dwarf Cavendish and Ouro cultivars. Contrarily bananas from Platano cultivar was found to had the lowest content of volatiles. Only four volatile metabolites among the total of 68 identified were found to be common to all studied cultivars: hexanal, isoamyl acetate, 2-methyl-3-methylbutyl propanoate and 3-2-methyl-3-methylbutyl butyrate (Table 2). Isoamyl acetate, considered the character impact metabolite in banana flavour (Nogueira, Fernandes, & Nascimento, 2003), is one of the few metabolites present in a higher amount in banana, mainly from Dwarf Cavendish and Plat-ano cultivars, while other short esters such as butyl acetate, with a fruity–estery odour description, are present only at low levels.
With exception of bananas from Platano cultivar, characterised by high levels of higher alcohols (54.6%), all other banana cultivars were largely dominated by ethyl esters which accounted for 90.1%, 86.5%, 80.9% and 51.2% in Maçã, Prata, Dwarf Cavendish and Ouro total GC peak areas, respectively. Carbonyl compounds followed by higher alcohols were found to be the second and third most abun-dant chemical groups. These impart green-woody notes that also contributed to banana flavour.
Among volatile metabolites identified in bananas from Dwarf Cavendish cultivar, the most dominant were found to be 3-meth-ylbutyl butyrate, isoamyl acetate, butyl butyrate, 2-methylpropyl butyrate, butyl acetate, isobutyl acetate and 1-methylbutyl buty-rate, constituting 72.6% of the total volatile composition. Banana
Table 2(continued)
Peak number
RT (min) RI Metabolite IDa % of relative areas achieved in different samplesb RPC (%)
DC BP BO BM P DC BP BO BM P
Total compounds identified in banana fruit
51 34 16 35 13
Sum of total area 3.93E + 08 3.93E+08 6.61E+08 8.62E+07 6.88E+08 4.52E+07
% RSD (n= 4) 5.25 5.25 1.64 2.66 5.19 0.32
a ID: reliability of identification: S-standard, MS-mass spectrum. b DC-Dwarf Cavendish; BP-Prata; BO-Ouro;BM-Maçã;P-Plátano. c MMPP: 2-methyl-2-methylpropyl propanoate.
d 2M2MPB: 2-methyl-2-methylpropyl butyrate. e MMBP: 2-methyl-3-methylbutyl propanoate.
f DMEHP: 2,2-dimethyl-2-ethylhexyl propanoate. g MMBB: 2-methyl-3-methylbutyl butyrate. h 3M3MBB: 3-methyl-3-methylbutyl butyrate.
i 3M2MBB: 3-methyl-2-methylbutyl butyrate. j MCHB:cis-2-methylcyclohexyl butyrate. l MBCH: 3-methyl-bicyclo[4.1.0]heptane. m2M1MBP: 2-methyl-1-methylbutyl propanoate.
n MEP: 2-methylethyl propanoate. o DHPo1,3-dihydroxy propan-2-one.
p DDMP: 2,3-dihydro-3,5-dihydroxy-6-methyl-4H-pyran-4-one.
a
b
Fig. 3.Results from PCA analysis. (a) Distribution of variables (loadings); and (b) projection of the samples (scores). Variable identification:EA: ethyl acetate;Pona: pentan-2-one;MEAC: isobutyl acetate;A2PEOL: 2-pentyl acetate;HEXAL: hexanal;M2MEPA: 2-methyl-2-methylpropyl propanoate;M2P1: 2-methyl propan-1-ol;MA1B: isoamyl acetate;PEOL: pentan-2-ol; MEBA: 2-methylpropyl butyrate;M2MEAB: 2-methyl-2-methylpropyl butyrate;HEPONE: heptan-2-one;M3MEPA: 2-methyl-3-methylbutyl propanoate;M1B: 3-methyl butan-1-ol;MbEBA: 1-methylbutyl butyrate;HEXEAL: hexen-2-al;BEBA:n-butyl butyrate;MbEBAC: 3-methylbutyl butyrate;M3MbEBA: 3-methyl-3-methylbutyl butyrate;HEPOL: heptan-2-ol;MbEPA: 3-methylbutyl pentanoate;MHEBA: 1-methylhexyl butyrate;MHEBAC: 3-methylhexyl butyrate;MCYCH: 3-methyl cyclohexanol;IPH: isopentyl hexanoate;HEXBA: (Z)-2-hexenyl butyrate;D17O16DIOL; linalool;HMF: 5-hydroxymethylfurfural;EUG: eugenol;ELMI: elemicin.
samples from Prata cultivar contained 3-methylbutyl butyrate, 3-methyl-3-methylbutyl butyrate, 1-methylbutyl butyrate, 2-methylpropyl butyrate, elemicin, 3-methyl butan-1-ol, isoamyl butyrate and isoamyl acetate, as the main volatile metabolites, whereas bananas from Ouro cultivars are largely dominated by 3-methylbutyl butyrate and hexen-2-al, accounting for 54.4% of the total volatile fraction. Other compounds, such as hexanal, 3-methyl-3-methylbutyl butyrate, ethyl acetate, isoamyl acetate and 3-methyl butan-1-ol, were also present at high levels. It is important to emphasise the lack of elemicin in this banana variety. Table 2illustrates that 35 volatile metabolites were identified in banana samples from Maçã cultivar, from which 24 tentatively identified, being a large number of them esters and carbonyl compounds. 3-Methylbutyl butyrate, 3-methyl-3-methylbutyl butyrate, and 1-methylbutyl butyrate, were the most abundant metabolites identified in these samples. Bananas from this cultivar are very rich in elemicin, in comparison to all other studied cultivars. In banana samples from Platano cultivar only 13 VOMs were identified being the higher alcohols and carbonyl compounds the most dominant groups. Isoamyl acetate and ethyl acetate were the major components. Other representative metabolites of this banana variety were identified as 5-hydroxymethylfurfural, (E)-hexen-2-al, 3-methylbutan-1-ol, and hexanal.
Some metabolites identified in the investigated banana varie-ties, like butyl acetate, hexan-1-ol, 3-methylbutyl butyrate and hexyl butyrate (Nogueira et al., 2003), 1-methylhexyl butyrate, 3-methylbutyl butyrate and octanoic acid (Wang, Li, Chen, Bao, & Yang, 2007), 3-methylbutan-1-ol and eugenol (Miranda, Nogueira, Pontes, & Rezende, 2001; Nogueira et al., 2003), butan-1-ol and hexanal (Mui, Durance, & Scaman, 2002; Nogueira et al., 2003), iso-butyl acetate and pentan-2-one (Salmon, Martin, Remaud, & Fou-rel, 1996), isoamyl acetate (Mui et al., 2002; Salmon et al., 1996) and isoamyl butyrate (Boudhrioua et al., 2003; Brat et al., 2004;
Mui et al., 2002; Salmon et al., 1996; Wang et al., 2007), have been reported as common components of several banana varieties. According to some authors, the banana aroma was particularly associated with methyl, 3-methylbutyl, 2-methylpropyl and iso-amyl esters of acetic, propanoic and butanoic acids. However, the volatile fraction produced by bananas from Dwarf Cavendish, Pra-ta, Ouro and Maçã cultivars, is dominated by 3-methylbutyl buty-rate which account for 28.3%, 37.8%, 50.0% and 34.5%, respectively, of total GC peak area, whereas isoamyl acetate (27.6%) present the highest level in bananas from Platano cultivar. In addition, Maçã and Prata banana varieties are richer in ethyl esters, carbonyl com-pounds and monoterpenoids, than Ouro, Dwarf Cavendish and Platano bananas (Table 2).
In comparison to banana cultivars from other geographical ori-gins some compositional differences could be observed. Pentan-2-one was reported as Pentan-2-one of major constituents in several banana cultivars from Spain and Philippines (Salmon et al., 1996; Shiota, 1993), but not in the cultivars investigated in this work. Another interesting difference is the substantial content of eugenol reported in bananas from Spain, Philippines and Latin America (Salmon et al., 1996; Shiota, 1993), which was only identified in banana from Dwarf Cavendish and Prata cultivars.
3.5. Multivariate analysis
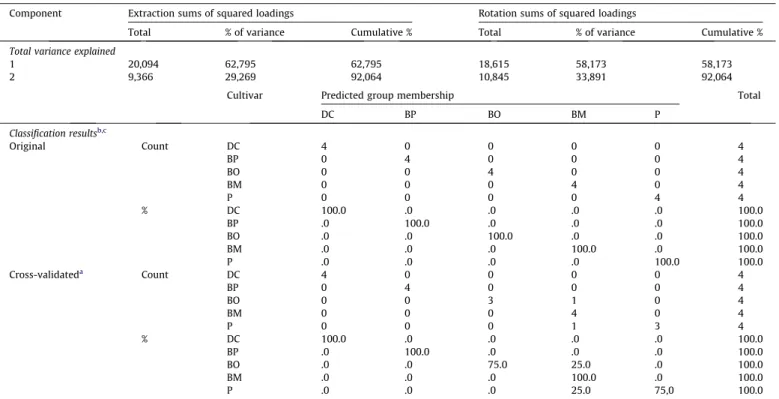
To summarise graphically the changes in the volatile content in the different cultivars, a principal component analysis (PCA) was successfully applied to the final data set in order to study the main sources of variability between the banana samples from various cultivars and detect the potential relationships/variables responsi-ble for differentiation. The PCA analysis led to the extraction of two principal components (PCs) having the initial eigenvalues > 1 which contributed to 92.1% of the total variance of the data set.
Table 3
Percentage of cumulative variance explained by the two first principal components and percentage of correctly classified samples corresponding to the SLDA model developed for the five-class approach analysed.
Component Extraction sums of squared loadings Rotation sums of squared loadings
Total % of variance Cumulative % Total % of variance Cumulative %
Total variance explained
1 20,094 62,795 62,795 18,615 58,173 58,173
2 9,366 29,269 92,064 10,845 33,891 92,064
Cultivar Predicted group membership Total
DC BP BO BM P
Classification resultsb,c
Original Count DC 4 0 0 0 0 4
BP 0 4 0 0 0 4
BO 0 0 4 0 0 4
BM 0 0 0 4 0 4
P 0 0 0 0 4 4
% DC 100.0 .0 .0 .0 .0 100.0
BP .0 100.0 .0 .0 .0 100.0
BO .0 .0 100.0 .0 .0 100.0
BM .0 .0 .0 100.0 .0 100.0
P .0 .0 .0 .0 100.0 100.0
Cross-validateda Count DC 4 0 0 0 0 4
BP 0 4 0 0 0 4
BO 0 0 3 1 0 4
BM 0 0 0 4 0 4
P 0 0 0 1 3 4
% DC 100.0 .0 .0 .0 .0 100.0
BP .0 100.0 .0 .0 .0 100.0
BO .0 .0 75.0 25.0 .0 100.0
BM .0 .0 .0 100.0 .0 100.0
P .0 .0 .0 25.0 75,0 100.0
Extraction method: principal component analysis.
aCross validation is done only for those cases in the analysis. In cross validation, each case is classified by the functions derived from all cases other than that case. b 100.0% of original grouped cases correctly classified.
The first principal component (PC1) identified as a linear combina-tion of 3-methylhexyl butyrate (MHEBAC), heptan-2-ol (HEPOL:), isopentyl hexanoate (IPH:) and 2-pentyl acetate (A2PEOL) accounted for 58.2% of the variance. PC2 explained 33.9% of the variance and was mainly represented by the linear combination of the following variables: 2-methyl-2-methylpropyl butyrate (M2MEAB), (Z)-2-hexenyl butyrate (HEXBA) andn-butyl butyrate (BEBA) (Fig. 3a). The scatter plot of PCA scores corresponding to this discrimination is illustrated inFig. 3b.
The first axis (58.2% of the variance explained), mainly discrim-inate bananas from Ouro and Maçã cultivars from the others, whereas the second axis (33.9% of the variance explained) mainly discriminate Dwarf Cavendish from Platano and Prata cultivars. Ba-nanas from Ouro and Maçã cultivars, positively located on the first axis, are particularly characterised by heptan-2-ol, 3-methylbutyl butyrate, 1-methylhexyl butyrate and pentan-2-ol. Dwarf Caven-dish positively located on the second axis (PC2) is mainly discrim-inated among bananas from Prata and Platano cultivars by a greater content of 2-methyl-2-methylpropyl butyrate, butyl buty-rate, isobutyl acetate, isoamyl acetate and pentan-2-one. These re-sults clearly demonstrate a clear classification of banana samples according to the cultivars based on volatile metabolites identified in the free fraction. The eigenvalues and explained and accumu-lated variance of the first five principal components (PCs) are listed inTable 3.
After PCA, stepwise linear discriminant analysis was performed on peak area data in order to highlight the most significant variables in the differentiation between banana cultivars and to find discriminant functions to predict the group to which future samples belonged. The projection of the banana cultivars in two-dimensional space, generated by the two first discriminant functions, explain 77.8% of the total variance.
Four clusters (Dwarf Cavendish and Prata cases are grouped, low Mahlanodis distance) representing each cultivar were ob-served. The good agreement achieved indicates that very accept-able classification functions can be deduced. The prediction ability of the SLDA model developed was evaluated by leave-one-out cross-validation.Table 3 shows the classification and predic-tion rates corresponding to the SLDA model developed on the basis of the subset of variables with the largest discriminant power be-tween the five categories selected by the stepwise procedure.
From the obtained results, we can ascertain that dHS-SPME/1D-GC–qMS together with a PCA represent a new solution toward fruit cultivar classification through the analysis of their volatile fraction.
4. Conclusions
This research consisted in a feasibility study to examine the use of dHS-SPME/1D-GC–qMS in combination with pattern recognition techniques as a simple, fast and reliable classification methodology to objectively discriminate between bananas from different culti-vars on the basis of their volatile distinctive profiles. dHS-SPME in combination with gas chromatography–mass spectrometry pro-vides a suitable and selective mean to establish the global volatile signature in different banana cultivars. The optimisation of the sig-nificant parameters affecting sorption process such as coating, extraction time and temperature, was done by using univariate experimental design. The chromatographic profile obtained, the to-tal 1D-GC–qMS peak area and the number of identified metabo-lites, suggest that the PDMS/DVB coating is the most suitable for isolation the VOMs from bananas using the dHS-SPME technique. The optimum set of conditions for the influential parameters was 60 min and 50°C for extraction time and extraction temperature,
respectively.
Ethyl esters were found to comprise the largest chemical class in the bananas from studied cultivars, accounting 80.9%, 86.5%,
51.2%, 90.1% and 6.1% for the volatile fraction in Dwarf Cavendish, Prata, Ouro, Maçã and Platano varieties, respectively. As found for bananas from Ouro cultivar (50.0%), 3-methylbutyl butyrate was found to be the most abundant volatile metabolite in bananas from Dwarf Cavendish (28.3%), Prata (37.8%) and Maçã (34.4%) cultivars, while isoamyl acetate (27.6%) occur as the major volatile metabo-lite in bananas from Platano cultivar.
Finally the acquired data set was submitted to PCA and the cor-responding bananas discrimination according to cultivars was suc-cessfully established. The application of the SLDA method on the volatile metabolites data set characterised by dHS-SPME/1D-GC– qMS resulted in predictive abilities of 90% as evaluated by the cross-validation procedure. The method could be extended to other fruit species permitting the development of a new tool useful in food quality control.
Acknowledgements
The authors thanks the financial support of Fundação para a Ciência e Tecnologia (FCT) through MS Portuguese Networks (REDE/1508/RNEM/2005) and Pluriannual base funding (QUI-Ma-deira-674).
References
Arias, P., Dankers, C., Liu, P., & Pilkauskas, P. (2003). The World Banana Economy: 1985–2002 (Vol. 1). Rome: FAO.
Augusto, F., Valente, A. L., dos Santos Tada, E., & Rivellino, S. R. (2000). Screening of Brazilian fruit aromas using solid-phase microextraction–gas chromatography-mass spectrometry.Journal of Chromatography A, 873(1), 117–127.
Bianchi, F., Careri, M., Mangia, A., & Musci, M. (2007). Retention indices in the analysis of food aroma volatile compounds in temperature-programmed gas chromatography: database creation and evaluation of precision and robustness.
Journal of Separation Science, 30(4), 563–572.
Boudhrioua, N., Giampaoli, P., & Bonazzi, C. (2003). Changes in aromatic components of banana during ripening and air-drying. Lebensmittel-Wissenschaft und -Technologie, 36, 633–642.
Brat, P., Yahia, A., Chillet, M., Bugaud, C., Bakry, F., Reynes, M., et al. (2004). Influence of cultivar, growth altitude and maturity stage on banana volatile compound composition.Fruits, 59(2), 75–82.
Camara, J. S., Alves, M. A., & Marques, J. C. (2006). Multivariate analysis for the classification and differentiation of Madeira wines according to main grape varieties.Talanta, 68(5), 1512–1521.
Cano, M. P., de Ancos, B., Matallana, M. C., Cámara, M., Reglero, G., & Tabera, J. (1997). Differences among Spanish and Latin-American banana cultivars: Morphological, chemical and sensory characteristics.Food Chemistry, 59(3), 411–419.
Cheong, K. W., Tan, C. P., Mirhosseini, H., Hamid, N. S. A., Osman, A., & Basri, M. (2010). Equilibrium headspace analysis of volatile flavour compounds extracted from soursop (Anoan muricata) using solid phase microextraction. Food Research International, 43, 1267–1276.
Chien, Y.-C., Uang, S.-N., Kuo, C.-T., Shih, T.-S., & Jen, J.-F. (2000). Analytical method for monitoring airborne trimethylamine using solid phase micro-extraction and gas chromatography-flame ionization detection.Analytica Chimica Acta, 419(1), 73–79.
Coelho, E., Perestrelo, R., Neng, N. R., Camara, J. S., Coimbra, M. A., Nogueira, J. M., et al. (2008). Optimisation of stir bar sorptive extraction and liquid desorption combined with large volume injection-gas chromatography-quadrupole mass spectrometry for the determination of volatile compounds in wines.Analytica Chimica Acta, 624(1), 79–89.
Deng, C., Li, N., & Zhang, X. (2004a). Development of headspace solid-phase microextraction with on-fiber derivatization for determination of hexanal and heptanal in human blood.Journal of Chromatography, B: Analytical Technologies in the Biomedical and Life Sciences, 813(1–2), 47–52.
Deng, C., Zhang, X., & Li, N. (2004b). Investigation of volatile biomarkers in lung cancer blood using solid-phase microextraction and capillary gas chromatography–mass spectrometry.Journal of Chromatography, B: Analytical Technologies in the Biomedical and Life Sciences, 808(2), 269–277.
Ferreira, L., Perestrelo, R., Caldeira, M., & Camara, J. S. (2009). Characterization of volatile substances in apples from Rosaceae family by headspace solid-phase microextraction followed by GC–qMS. Journal of Separation Science, 32(11), 1875–1888.
Forina, M., Armanino, C., Castino, M., & Ubigli, M. (1986). Multivariate data analysis as a discriminating method of the origin of wines.Vitis, 25, 189–201. Hognadottir, A., & Rouseff, R. L. (2003). Identification of aroma active compounds in
orange essence oil using gas chromatography–olfactometry and gas chromatography–mass spectrometry. Journal of Chromatography A, 998(1–2), 201–211.
Ibáñez, E., López-Sebastián, S., Ramos, E., Tabera, J., & Reglero, G. (1998). Analysis of volatile fruit components by headspace solid-phase microextraction. Food Chemistry, 63, 281–286.
Jordan, M. J., Tandon, K., Shaw, P. E., & Goodner, K. L. (2001). Aromatic profile of aqueous banana essence and banana fruit by gas chromatography-mass spectrometry (GC–MS) and gas chromatography-olfactometry (GC–O).Journal of Agriculture and Food Chemistry, 49(10), 4813–4817.
Kumazawa, T., Lee, X., Sato, K., & Suzuki, O. (2003).Analytica Chimica Acta, 492(1–2), 49–67.
Lambropoulou, D. A., & Albanis, T. A. (2001). Optimization of headspace solid-phase microextraction conditions for the determination of organophosphorus insecticides in natural waters.Journal of Chromatography A, 922(1–2), 243–255. Mayr, D., Märk, T., Lindinger, W., Brevard, H., & Yeretzian, C. (2003). Breath-by-breath analysis of banana aroma by proton transfer reaction mass spectrometry.International Journal of Mass Spectrometry, 223–224, 743–756. Mendes, B., Gonçalves, G., & Câmara, J. S. (2012). Effectiveness of high-throughput
miniaturized sorbent- and solid phase microextraction techniques combined with gas chromatography-mass spectrometry analysis to obtain a rapid screening of volatile and semi-volatile composition of wines – A comparative study.Talanta, 88, 79–94.
Miranda, E., Nogueira, R., Pontes, S., & Rezende, C. (2001). Odour-active compounds of banana passa identified by aroma extract dilution analysis. Flavour and Fragrance Journal, 16, 281–285.
Moeder, M., Schrader, S., Winkler, M., & Popp, P. (2000). Solid-phase microextraction– gas chromatography–mass spectrometry of biologically active substances in water samples.Journal of Chromatography A, 873(1), 95–106.
Mui, W. W., Durance, T. D., & Scaman, C. H. (2002). Flavor and texture of banana chips dried by combinations of hot air, vacuum, and microwave processing.
Journal of Agriculture and Food Chemistry, 50(7), 1883–1889.
Navarro, T., De Lorenzo, C., & Perez, R. A. (2004). SPME analysis of volatile compounds from unfermented olives subjected to thermal treatment.Analytical and Bioanalytical Chemistry, 379(5–6), 812–817.
Nogueira, J. M., Fernandes, P. J., & Nascimento, A. M. (2003). Composition of volatiles of banana cultivars from Madeira Island. Phytochemical Analysis, 14(2), 87–90.
Pereira, J., Pereira, J. M., & Câmara, J. S. (2011). Effectiveness of different solid-phase microextraction fibres for distinction of selected Madeira island fruits based on their volatile metabolite profile – identification of novel compounds.Talanta, 83, 899–906.
Perestrelo, R., Caldeira, M., Rodrigues, F., & Camara, J. S. (2008). Volatile flavour constituent patterns of Terras Madeirenses red wines extracted by dynamic headspace solid-phase microextraction.Journal of Separation Science, 31(10), 1841–1850.
Perestrelo, R., Nogueira, J. M., & Camara, J. S. (2009). Potentialities of two solventless extraction approaches–stir bar sorptive extraction and headspace solid-phase microextraction for determination of higher alcohol acetates, isoamyl esters and ethyl esters in wines.Talanta, 80(2), 622–630.
Perez, A. G., Olias, R., Luaces, P., & Sanz, C. (2002). Biosynthesis of strawberry aroma compounds through amino acid metabolism.Journal of Agriculture and Food Chemistry, 50(14), 4037–4042.
Powers, J., & Keith, E. (1968). Stepwise discriminant analysis of gas-chromatographic data as an aid in classifying the flavor quality of foods.
Journal of Food Science, 36, 207–213.
Pozo, B., Pueyo, E., Martin-Alvarez, P. J., & Polo, M. C. (2001). Polydimethylsiloxane solid-phase microextraction–gas chromatography method for the analysis of volatile compounds in wines. Its application to the characterization of varietal wines.Journal of Chromatography A, 922(1–2), 267–275.
Risticevic, S., Carasek, E., & Pawliszyn, J. (2008). Headspace solid-phase microextraction–gas chromatographic-time-of-flight mass spectrometric methodology for geographical origin verification of coffee.Analytica Chimica Acta, 617(1–2), 72–84.
Salmon, B., Martin, G. J., Remaud, G., & Fourel, F. (1996). Compositional and isotopic studies of fruit flavours. Part I. The banana aroma compositional and isotopic studies of fruit flavours. Part I. The banana aroma.Flavour and Fragrance Journal, 11, 353–359.
Shiota, H. (1993). New ester components in the volatiles of banana fruit (Musa sapientumL.).Journal of Agriculture and Food Chemistry, 41, 2056–2062. Silva, C. L., Passos, M., & Câmara, J. S. (2011). Investigation of urinary volatile organic
metabolites as potential cancer biomarkers by solid-phase microextraction combined with gas chromatography-mass spectrometry methodology.British Cancer Journal, 105, 1894–1904.
Silva, C. L., Passos, M., & Câmara, J. S. (2012). Solid phase microextraction, mass spectrometry and metabolomics approaches for detection of urinary cancer biomarkers – a potential strategy for diagnosing breast cancer diagnosis.
Talanta, 89, 360–368.
Ternes, T. (1998). Occurrence of drugs in German sewage treatment plants and rivers.Water Research, 32, 3245.
Tressl, R., & Albrecht, W. (1985). Biogeneration of Aromas. In T. H. P. A. R. Croteau (Ed.), Biogenesis of Aroma Compounds Through Acyl Pathways, (pp. 114–133). Tressl, R., & Drawert, F. (1973). Biogenesis of banana volatiles.Journal of Agriculture
and Food Chemistry, 21, 560–565.
Van Den Dool, H., & Kratz, P. D. (1963). A generalization of the retention index system including linear temperature programmed gas–liquid partition chromatography.Journal of Chromatography A, 11, 463–471.
Vermeir, S., Hertog, M. L. A. T. M., Vankerschaver, K., Swennen, R., Nicolaï, B. M., & Lammertyn, J. (2009). Instrumental based flavour characterisation of banana fruit.LWT - Food Science and Technology, 42(10), 1647–1653.
Wang, J., Li, Y., Chen, R., Bao, J., & Yang, G. (2007). Comparison of volatiles of banana powder dehydrated by vacuum belt drying freeze-drying and air-drying.Food Chemistry, 104, 1516–1521.
Wyllie, S. G., & Fellman, J. K. (2000). Formation of volatile branched chain esters in bananas (Musa sapientumL.).Journal of Agriculture and Food Chemistry, 48(8), 3493–3496.