Research Article
Effects of Acute Bleeding Followed by Hydroxyethyl Starch
130/0.4 or a Crystalloid on Propofol Concentrations,
Cerebral Oxygenation, and Electroencephalographic and
Haemodynamic Variables in Pigs
Aura Silva,
1Ana Liza Ortiz,
2Carlos Venâncio,
3Almir P. Souza,
4Luísa Maria Ferreira,
5Paula Sério Branco,
5Paula Guedes de Pinho,
1Pedro Amorim,
6and David A. Ferreira
7 1Toxicology Department, REQUIMTE, Faculdade de Farmacia, Universidade do Porto,Rua de Jorge Viterbo Ferreira, No. 228, 4050-313 Porto, Portugal
2Universidad de Leon, Avenida Facultad de Veterinaria, No. 25, 24004 Le´on, Spain
3Centre for the Research and Technology of Agro-Environmental and Biological Sciences (CITAB),
Animal Science Department, University of Tras-os-Montes and Alto Douro, Quinta de Prados, 5000-801 Vila Real, Portugal 4Unidade Academica de Medicina Veterin´aria, Universidade Federal de Campina Grande, Patos,
Rua Sinfrˆonio Nazar´e, 1 Centro, 58800-240 Sousa, PB, Brazil
5Chemistry Department, Faculdade de Ciencias e Tecnologia, Universidade Nova de Lisboa, EQUIMTE/CBQF, Quinta da Torre, 2829-516 Caparica, Portugal
6Anaesthesiology Department, Hospital Geral de Santo Antonio, 4099-001 Porto, Portugal 7Veterinary Sciences Research Center (CICV), Faculdade de Medicina Veterinaria,
Universidade Lus´ofona de Humanidades e Tecnologias, Campo Grande 376, 1749-024 Lisboa, Portugal
Correspondence should be addressed to Aura Silva; [email protected]
Received 10 December 2013; Revised 31 March 2014; Accepted 14 April 2014; Published 19 May 2014 Academic Editor: Shane R. Raidal
Copyright © 2014 Aura Silva et al. This is an open access article distributed under the Creative Commons Attribution License, which permits unrestricted use, distribution, and reproduction in any medium, provided the original work is properly cited. Bleeding changes the haemodynamics, compromising organ perfusion. In this study, the effects of bleeding followed by replacement with hydroxyethyl starch 130/0.4 (HES) or lactated Ringer’s (LR) on cerebral oxygenation and electroencephalogram-derived parameters were investigated. Twelve young pigs under propofol-remifentanil anaesthesia were bled 30 mL/kg and, after a 20-minute waiting period, volume replacement was performed with HES (GHES;𝑁 = 6) or LR (GRL;𝑁 = 6). Bleeding caused a decrease of more than 50% in mean arterial pressure (𝑃 < 0.01) and a decrease in cerebral oximetry (𝑃 = 0.039), bispectral index, and electroencephalogram total power (𝑃 = 0.04 and 𝑃 < 0.01, resp.), while propofol plasma concentrations increased (𝑃 < 0.01). Both solutions restored the haemodynamics and cerebral oxygenation similarly and were accompanied by an increase in electroencephalogram total power. No differences between groups were found. However, one hour after the end of the volume replacement, the cardiac output (𝑃 = 0.03) and the cerebral oxygenation (𝑃 = 0.008) decreased in the GLRand were significantly lower than in GHES(𝑃 = 0.02). Volume replacement with HES 130/0.4 was capable of maintaining the cardiac output and cerebral oxygenation during a longer period than LR and caused a decrease in the propofol plasma concentrations.
1. Introduction
The choice of fluid administration in clinical situations where it is urgent to restore macrohaemodynamic function should also assure the best beneficial effects on microcirculation and
tissue oxygenation [1]. Rapid restitution of intravascular
vol-ume is essential to maintain the vital organs’ perfusion. There are different intravascular volume replacement regimens for providing haemodynamic stability after blood loss, including blood and its components, synthetic colloids as dextrans,
Volume 2014, Article ID 710394, 12 pages http://dx.doi.org/10.1155/2014/710394
gelatines, and hydroxyethyl starch (HES), or crystalloids as
lactated Ringer’s solution (LR) [2,3].
HES 130/0.4 is the most recent hydroxyethyl starch which was created with a lower molecular weight and lower degree of substitution to overcome the side effects of previous
heavier starches [4]. However, in June 2013 [5] the marketing
authorizations for all HES products for human patients were suspended in the United Kingdom by the European Medicines Agency. This decision was based on three large
randomized controlled trials [1,6,7] in which the use of HES
was associated with higher rates of acute kidney failure or dialysis. Because HES is often used in veterinary patients, there is a concern about the implications that the drug may have in these patients. Thus, it is important to understand the advantages and drawbacks of resuscitation with HES compared to crystalloids.
Electroencephalogram-derived parameters such as the bispectral index (BIS) have been suggested to reflect changes in the cerebral perfusion during hemorrhagic shock followed
by resuscitation in pigs [8] and it would be interesting to
compare the effects of HES and crystalloids in this parameter. However, recent data suggest that these BIS variations are merely due to the anaesthetic depth until development of lethal hypotension at which brain electrical activity cannot
be sustained [9,10]. Near-infrared spectroscopy (NIRS) may
make it possible to study the regional cerebral blood flow
[11], while brain venous oxygenation (SvjO2) monitoring may
yield useful information of general cerebral perfusion [12].
Acute bleeding and fluid replacement may also change
the pharmacokinetics of intravenous drugs [13, 14] such as
propofol, which is increasingly used in veterinary patients, and it is important to understand its pharmacokinetics when facing acute blood loss followed by volume replacement using crystalloid or colloid solutions.
By understanding the posthaemorrhage effects of differ-ent volume replacemdiffer-ent solutions on brain oxygenation, elec-troencephalogram, cardiovascular parameters, and propofol pharmacokinetics, it is possible to improve brain and cardio-vascular function and optimise the propofol titration.
This study addresses the effects of volume replacement with a crystalloid (lactated Ringer’s) or a colloid (hydrox-yethyl starch 130/0.4) solution on propofol plasma concentra-tions, cerebral oxygenation, electroencephalogram-derived parameters, and haemodynamics after severe acute bleeding in pigs under propofol and remifentanil total intravenous anaesthesia.
2. Material and Methods
All procedures were carried out under personal and project licenses approved by the national regulatory office (Direcc¸˜ao Geral de Veterin´aria—DGV000228).
Twelve healthy three-month-old large white pigs were
used in this study. The GLR pigs weighed27.2 ± 3.1 Kg and
the GHESweighted26.8 ± 4.1 Kg.
The pigs were fasted overnight but were permitted free access to water. Blood samples were withdrawn from each
pig at the beginning and at the end of the study for hema-tologic and biochemical analysis. All pigs were submitted to general anaesthesia with propofol and remifentanil during which the methodological procedures took place and were submitted to the same monitoring and bleeding procedures. These same animals were used for another study of the effects of a remifentanil bolus on the electroencephalogram, haemodynamics, and cerebral oxygenation which benefited from the same monitoring setup and the same anaesthesia but was performed before the start of the present study in the same conditions for all animals and the effect of the bolus was allowed to pass before the start of the present study.
These pigs were randomly assigned in two groups, which differed only in the type of fluid used in the volume replace-ment phase; six animals received hydroxyethyl starch 130/0.4
(GHES) (Voluven, Fresenius Kabi, Bad Homburg, Germany)
and six animals received lactated Ringer’s (GLR) (B Braun,
Melsungen, Germany).
2.1. Anaesthesia, Monitoring, and Equipment. All pigs were
premedicated with azaperone IM 4 mg kg−1(Stresnil, Janssen
Animal Health, Belgium) thirty minutes prior to the begin-ning of anaesthesia induction. After premedication, a 22G catheter was inserted in the right auricular vein for drug and fluid administration. Two three-way stopcock valves were used to connect the intravenous catheter to the maintenance lactated Ringer’s (LR) delivery line and to the lines delivering propofol 1% (Fresenius Kabi, Bad Homburg, Germany) and
remifentanil 20𝜇g mL−1 (Ultiva, GSK, Midlessex, UK). An
infusion pump (Braun, Melsungen, Germany) was used for the administration of LR at a constant infusion rate of
6 mL kg−1h−1 + 1 mL kg−1h−1 for each kg above 20 kg of
weight [15] during the entire study period. Propofol and
remifentanil were delivered using two perfusion pumps (Asena GH, Alaris Medical Systems, San Diego, CA) con-trolled by the RugLoop II Waves software developed by Tom De Smet (Demed Engineering, Temse, Belgium) and Michel Struys (Ghent University, Gent, Belgium) running in a personal computer.
Induction of anaesthesia was performed with a propofol
bolus of 4 mg kg−1 while pigs were breathing 100% oxygen
via a facial mask. This was followed by tracheal intubation with a 6.5 mm endotracheal tube. The pigs were mechanically ventilated with a mixture of 20% air + 80% oxygen, using a Datex Carestation ventilator, with a tidal volume of 10 mL
kg−1, respiratory rate of 12 to 14, and inspiration expiration
ratio of 1 : 3, with adjustments according to the observed
ETCO2in order to obtain a PaCO2of40 ± 4 mmHg.
After induction of anaesthesia, a propofol constant
infusion was started at a rate of 15 mg kg−1h−1 which
remained unchanged during the entire study period. Simul-taneously, a remifentanil constant infusion was started at
a rate of 0.3𝜇g kg−1min−1. After ending all monitoring
procedures, the remifentanil infusion rate was decreased to
0.2𝜇g kg−1min−1 and was maintained unaltered during all
the study period. Peripheral oxygen saturation (SpO2) was
rate was collected by three ECG electrodes placed according to Academy of Veterinary Cardiology Committee.
2.2. Haemodynamic Monitoring. After reaching stable
anaes-thesia (total muscle relaxation, absence of palpebral reflex, and absence of haemodynamic response to interdigital space clamping), the following invasive instrumentation proce-dures were performed in each pig for placement of arterial catheters in the left femoral artery (Leadercath, Vygon Cor-poration, PA) for monitoring continuous blood pressure and a 16 gauge catheter in the right femoral artery (Abbot Animal Health, IL) for passive bleeding. A surgical approach to the ventral cervical region was used in all pigs for introducing two 7F Swan-Ganz optic catheters (Edwards, Life Sciences, Irvine, CA): one in the internal jugular vein with its optic tip in the sinus petrosus ventralis, for collecting data from
venous blood oxygen saturation (SvjO2), and the other in the
pulmonary artery, via left external jugular vein, for collecting data from central venous pressure, pulmonary artery pressure and cardiac output by the thermodilution method, and pulmonary pressure.
A multiparametric haemodynamic monitor (Datex-Ohmeda S/5, Helsinki, Finland) was used to collect all
haemodynamic and ventilatory data. The SvjO2 was
mea-sured using an Oxymetrix 3 monitor (Abbott Laboratories, North Chicago, IL, USA) also connected to the S/5 Datex monitor. All data was recorded every five seconds in a per-sonal computer, via a RS-232 interface, running the RugLoop II Waves software.
2.3. Brain Monitoring. The fur on the skin over the
fronto-occipital region was shaved, and the skin grasped with fine sandpaper and cleaned with acetone, and a BIS adhesive electrode (Zipprep, Aspect Medical Systems, Natick, MA) was placed in the left side of the head in the following position: number 1 electrode was placed over the external occipital protuberance; number 2 and number 4 electrodes were placed over the left hemisphere; number 3 electrode was placed over the rostral left portion of the frontal bone, at the level of the left eye. The EEG was recorded at 256 Hz using a BIS XP monitor (Aspect Medical Systems, Natick, MA). The monitor also recorded the bispectral index (BIS), elec-tromyographic activity (EMG), signal quality index, spectral edge frequency 95% (SEF) suppression ratio (SR), and total power (TP). Data from the BIS monitor were recorded every second in the personal computer running the RugLoop II Waves software.
The near-infrared spectroscopy INVOS monitor 4100 with the software version 11.16.16 (Somanetics Corporation, Troy, MI) was used continuously to monitor changes in
regional oxygen saturation (rSO2) in the left side of the head
using its noninvasive electrodes (SomaSensors, Somanetics Corporation, Troy, MI). Data from cerebral oxygen saturation given by the INVOS was recorded continuously using ASYS
software [16] running in a second personal computer, with
the clock synchronized with that in the computer running the RugLoop II Waves software.
An Oxymetrix 3 monitor (Abbott Laboratories, North Chicago, LL, USA) with a 7F Swan-Ganz optic catheter (Edwards, Life Sciences, Irvine, CA), with its optic tip placed in the sinus petrosus ventralis, was used for collecting data
from venous blood oxygen saturation (SvjO2), for monitoring
the overall brain oxygenation.
2.4. Experimental Protocol. After completing all the
neces-sary instrumentation procedures, 30 mL kg−1 of blood was
passively removed from each pig through the right femoral artery, during approximately 20 minutes. Twenty minutes after the bleeding has stopped, the volume replacement phase
started at 999 mL h−1 with LR or HES 130/0.4 solution,
depending on the treatment group. The volume of HES
130/0.4 administered for volume replacement was 20 mL kg−1
[17], and the volume of Ringer solution administered was
25% higher (25 mL kg−1) than that used for HES based on
preliminary studies. These volumes were administered in the external jugular vein, via the side port of the Swan-Ganz catheter introducer (7F Intro-Flex, I500F7C, Edwards, Life Sciences, Irvine, CA).
After the end of the volume replacement, all animals were maintained under the same rates of propofol and remifentanil for an additional one hour. At the end of the study, the pigs were euthanized under general anaesthesia with intravenous potassium chloride. At the end of the study all the pigs were subjected to necropsy to check for correct positioning of the catheters and direct visualization of the internal organs.
Cardiac output measurements using the thermodilution
method were performed just before the start of bleeding (𝑇0),
when 50% of the blood volume was removed, at the end of the bleeding, at the end of the twenty-minute waiting period, at the end of the volume replacement, and at the end of the study.
Arterial blood samples were also collected for blood gas analyses right before bleeding, at the end of the waiting period, in the end of the volume replacement, and in the end of the study using a Gem Premier 3000 analyser (Instrumentation Laboratory, Massachusetts, USA).
During the study period, 3 mL arterial blood samples were collected from the right femoral artery into heparin con-taining tubes for propofol and propofol metabolites
quantifi-cation in the plasma right before bleeding (𝐶𝑝0), 10 (𝐶𝑝1) and
15 (𝐶𝑝2) minutes after the beginning of bleeding, at the end of
bleeding (𝐶𝑝3), ten minutes after the beginning of the waiting
period (𝐶𝑝4) and at the end of the waiting period (𝐶𝑝5), and
15 (𝐶𝑝6), 30, 45, and 60 minutes after the beginning of volume
replacement (𝐶𝑝7, 𝐶𝑝8, and 𝐶𝑝9). After blood collection the
plasma was separated through centrifugation at 3000 rpm for
15 minutes and was immediately placed at−77∘C and stored
until analysis.
Propofol plasma concentrations as well as its free metabolites (1,4-quinol and
2,6-diisopropyl-1,4-quinone) [18] were determined by gas chromatography
mass spectrometry according to Guitton and colleagues [19]
with some adjustments, as described in Silva and colleagues
[20]. For the calibration curve, the nonconjugated
not commercially available. The purified metabolites (>95%) were subsequently used as GC-MS standards.
The plasma concentrations of propofol were divided by the total volume of propofol administered to check for influences of the duration of propofol infusion on the final concentrations of the drug.
2.5. Electroencephalographic Analysis. The BIS monitor
recorded the raw EEG at 256 Hz which was further converted to be processed offline using the MATLAB software (MathWorks, Natick, MA). The signal’s sampling frequency was first decreased 2 times, resulting in 128 Hz. The indices approximate entropy (AE) and permutation entropy (PE) were derived from EEG epochs of 8 seconds after filtering using a butterworth bandpass filter of 8th order with cutoff frequencies of 0.5 and 30 Hz followed by removal of the mean value of the signal in order to get out any threshold. AE and PE were computed according to published algorithms
[21–23]. Briefly, the calculation of the AE depends on three
factors: the embedding dimension (𝑚), the number of samples considered for each calculation (𝑁), and the noise threshold (𝑟). In this study 𝑁 = 1024, 𝑚 = 2, and 𝑟 = 0.2 were selected for AE calculation, based on previous studies
[24]. For the PE calculation, the length of subvectors (𝑚) and
the analyzed signal interval (length𝑁) are main factors. In
this study, we used𝑚 = 3 and 𝑁 = 1024. A more detailed
description of the AE and PE calculation can be found in
published works [22,23,25].
The spectral parameters were corrected for the presence of burst suppression patterns, using the values of SR (sup-pression ratio) recorded by the BIS monitor, according to
the correction factor proposed by Rampil [26]. The same
correction factor was applied to PE resulting in BSPE,
calculated as follows: BSPE = PE× (1 − SR/100) [20,27].
The raw EEG was recorded along with the BIS, EMG, SEF, and TP, all derived automatically from the BIS monitor. These parameters were included in the overall analysis of the indices of anaesthetic depth.
2.6. Statistics. Four different study periods were analysed: (1)
the bleeding period; (2) the 20-minute waiting period; (3) the volume reposition period; and (4) the final period until euthanasia. Each period was normalized in 10 different 10% parts. Each 10% part represented the average of 30 seconds of consecutive measurements.
The percentage of oxygen extraction (SpO2-SvO2) was
also analyzed.
Data were tested for normal distribution and homogene-ity of variance using the Shapiro-Wilk normalhomogene-ity test and Levene test, respectively. Haemodynamic, cerebral oxygena-tion, propofol and metabolites plasma concentrations, and electroencephalographic data were compared within groups and between groups using two-way repeated measures anal-ysis of variance, with Bonferroni corrections for pairwise comparisons which was performed separately for each study period.
Correlation analysis was performed between the stud-ied parameters using the Pearson and Spearman Rank
correlation coefficients for normal and non-Gaussian data, respectively. Correlation analysis was performed during the bleeding period and during the volume replacement period.
Statistical analysis was performed using Graphpad prism (Version 5, GraphPad Software Inc., San Diego, CA). Data are
expressed as mean± SD; 𝑃 < 0.05 was considered statistically
significant.
3. Results
The bleeding period had a mean duration of19.8 ± 0.8 (GLR)
and20.3 ± 2.6 (GHES), the waiting period lasted for24.9 ± 2.7
(GLR) and24 ± 3.2 (GHES) minutes, the volume replacement
period lasted for 43.8 ± 5.7 (GLR) and 33.1 ± 4.8 (GHES)
minutes, and the period between the end of replacement
and the end of study was53.5 ± 16.1 (GLR) and54.1 ± 14.9
(GHES) minutes. The average blood volume withdrawn was
680 ± 78 mL in the GLRand671 ± 104 mL in the GHES.
The blood temperature of the pigs was maintained
between 39 and 40∘C (normothermia for pig) during the
whole anaesthesia. The changes in arterial blood gases were comparable between the two groups throughout the whole
study (Table 1). There were no significant changes in the
oxygen extraction (SpO2-SvjO2) between the two groups,
although there were variations throughout time (𝑃 = 0.03) (Table 2).
Bleeding Period. Propofol plasma concentration (𝐶𝑝) increased during bleeding (𝑃 < 0.01), and propofol
free metabolites (𝐶met) also changed throughout time
(𝑃 < 0.001), increasing until 15 minutes after the beginning of bleeding and decreasing from 15 minutes to the end of
bleeding (Table 2andFigure 1).
Regarding the EEG-derived parameters, during bleeding, BIS (𝑃 = 0.04) and TP (𝑃 < 0.001) decreased significantly. No significant changes were found in the other studied EEG-derived parameters or in any parameter between the two
groups (Table 3).
SvjO2 and cerebral oxygen saturation reflected by INVOS
decreased throughout bleeding (𝑃 = 0.039), but no differ-ences were found between the two groups (𝑃 > 0.1) as shown inTable 2andFigure 2.
During the bleeding period there was a significant decrease in blood pressure (𝑃 < 0.001) and no significant
dif-ferences were found between groups. In GLR, MAP decreased
by 54.6% from the beginning to the end of bleeding and
in GHES it decreased by 52.3% in 𝑇10 when compared to
baseline (𝑇0) (Table 2andFigure 3). There were no significant
changes in HR throughout time (𝑃 = 0.98) or between groups
(𝑃 = 0.52) (Table 2). CO decreased throughout bleeding
(𝑃 < 0.001) similarly in both groups (𝑃 = 0.47) and DPAP
(𝑃 < 0.05) decreased in both groups as shown inTable 2and
Figure 3.
3.1. Correlation Analysis. During bleeding there were
signif-icant correlations between MAP and CO (𝑟 = 0.70; 𝑃 <
0 2 4 6 8
Bleeding Waiting Replacement Final
𝜇 g mL −1 ) GLR GHES Cp ( (a) 0.25 0.20 0.15 0.10 0.05 0.00
Bleeding Waiting Replacement Final
𝜇 g mL −1) GLR GHES Cmet ( (b)
Figure 1: Propofol plasma concentration (𝐶𝑝—𝜇g/mL) and propofol free metabolites (𝐶met—𝜇g/mL) during the four phases of the study.
The two groups are shown: GLR—black line and GHES—dashed grey line. 80 70 60 50 40 C er eb ral o xyg en s at ura tio n
Bleeding Waiting Replacement Final GLR GHES (a) 100 80 60 40 20 0 SvjO 2
Bleeding Waiting Replacement Final
GLR
GHES
(b)
Figure 2: Cerebral oxygenation parameters during the four phases of the study: cerebral oxygen saturation (INVOS) (a) and SvjO2(%) (b). The two groups are shown: GLR—black line and GHES—dashed grey line.
150 100 50 0 MAP (mmH g) T0 End of hemorrhage Start of replacement +15 +30 +45 +60 GLR GHES (a) T0 End of hemorrhage Start of replacement +15 +30 +45 +60 8 6 4 2 0 C O (L/min) GLR GHES (b) T0 End of hemorrhage Start of replacement +15 +30 +45 +60 25 20 15 10 5 0 D P AP (mmH g) GLR GHES (c)
Figure 3: Haemodynamic variables during the four phases of the study: mean arterial pressure (MAP: mmHg), cardiac output (CO: L/min), and diastolic pulmonary artery pressure (DPAP: mmHg). The two groups are shown: GLR: black line and GHES: dashed grey line.
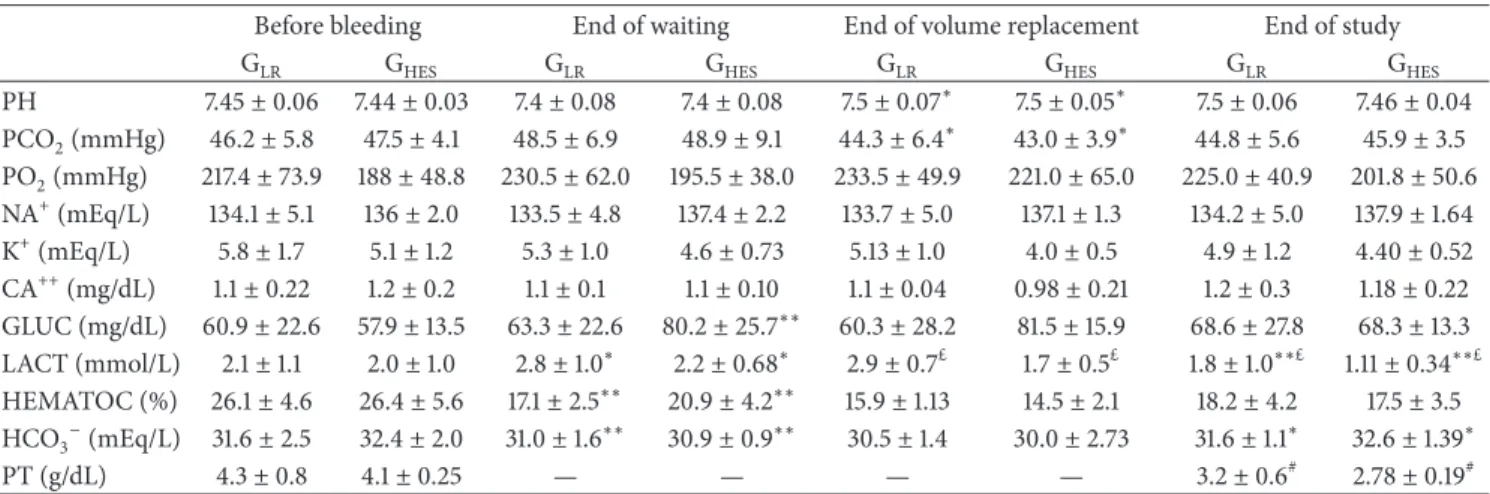
Table 1: Results from arterial blood gas analysis performed before the beginning of bleeding (1), at the end of the waiting period (2), in the end of the volume replacement (3), and in the end of the study one hour after the end of the volume replacement (4).
Before bleeding End of waiting End of volume replacement End of study
GLR GHES GLR GHES GLR GHES GLR GHES
PH 7.45± 0.06 7.44± 0.03 7.4± 0.08 7.4± 0.08 7.5± 0.07∗ 7.5± 0.05∗ 7.5± 0.06 7.46± 0.04 PCO2(mmHg) 46.2± 5.8 47.5± 4.1 48.5± 6.9 48.9± 9.1 44.3± 6.4∗ 43.0± 3.9∗ 44.8± 5.6 45.9± 3.5 PO2(mmHg) 217.4± 73.9 188± 48.8 230.5± 62.0 195.5± 38.0 233.5± 49.9 221.0± 65.0 225.0± 40.9 201.8± 50.6 NA+(mEq/L) 134.1± 5.1 136± 2.0 133.5± 4.8 137.4± 2.2 133.7± 5.0 137.1± 1.3 134.2± 5.0 137.9± 1.64 K+(mEq/L) 5.8± 1.7 5.1± 1.2 5.3± 1.0 4.6± 0.73 5.13± 1.0 4.0± 0.5 4.9± 1.2 4.40± 0.52 CA++(mg/dL) 1.1± 0.22 1.2± 0.2 1.1± 0.1 1.1± 0.10 1.1± 0.04 0.98± 0.21 1.2± 0.3 1.18± 0.22 GLUC (mg/dL) 60.9± 22.6 57.9± 13.5 63.3± 22.6 80.2± 25.7∗∗ 60.3± 28.2 81.5± 15.9 68.6± 27.8 68.3± 13.3 LACT (mmol/L) 2.1± 1.1 2.0± 1.0 2.8± 1.0∗ 2.2± 0.68∗ 2.9± 0.7£ 1.7± 0.5£ 1.8± 1.0∗∗£ 1.11± 0.34∗∗£ HEMATOC (%) 26.1± 4.6 26.4± 5.6 17.1± 2.5∗∗ 20.9± 4.2∗∗ 15.9± 1.13 14.5± 2.1 18.2± 4.2 17.5± 3.5 HCO3−(mEq/L) 31.6± 2.5 32.4± 2.0 31.0± 1.6∗∗ 30.9± 0.9∗∗ 30.5± 1.4 30.0± 2.73 31.6± 1.1∗ 32.6± 1.39∗ PT (g/dL) 4.3± 0.8 4.1± 0.25 — — — — 3.2± 0.6# 2.78± 0.19#
GLR: group that received lactated Ringer’s for volume replacement; GHES: group that received hydroxyethyl starch for volume replacement. Mean± standard deviation is shown. Significantly different from the previous measurement:∗𝑃 < 0.05,∗∗𝑃 < 0.01 level.£Significant differences between groups at the𝑃 < 0.05 level.#Significant differences between the measurement “before bleeding” and the measurement “end of study.”
oxygen saturation (𝑟 = 0.54; 𝑃 < 0.001), and CO and 𝐶𝑝
(𝑟 = −0.55; 𝑃 < 0.05).
Regarding the EEG-derived parameters, SR and TP cor-related negatively with each other (𝑟 = −0.58; 𝑃 < 0.001) and AE correlated with PE (𝑟 = 0.69; 𝑃 < 0.001) and SRPE (𝑟 = 0.78; 𝑃 < 0.001).
Waiting Period. At the end of the waiting period a significant
increase from the values previous to bleeding was observed
in plasma lactate levels from2.1 ± 1.1 to 2.8 ± 1.0 in GLR(𝑃 <
0.01) and from 2.0 ± 1.0 to 2.2 ± 0.68 in GHES(𝑃 < 0.01).
No changes were found in𝐶𝑝and𝐶metbetween or within
groups (Table 2andFigure 1).
Regarding the EEG-derived parameters, TP decreased during the waiting period (𝑃 < 0.001) and PE increased
(𝑃 = 0.01), as shown inTable 3.
SvjO2decreased (𝑃 < 0.05) and cerebral oxygen
satura-tion showed no significant differences (𝑃 = 0.43) (Table 2and
Figure 2). There was a significant decrease in the hematocrit
from26.1 ± 4.6% to 17.1 ± 2.5% in GLR(𝑃 < 0.01) and from
26.4 ± 5.6% to 20.9 ± 4.2% in GHES(𝑃 < 0.01). There were no
significant differences between groups in these parameters. MAP increased (𝑃 < 0.001) similarly in both groups. CO and HR showed no significant changes throughout time (𝑃 > 0.1)
as shown inTable 2.
No significant differences between groups were found in this period in any parameter.
Volume Replacement Period.𝐶𝑝did not change significantly
in this period (Table 2andFigure 1).
The TP of the EEG increased significantly (𝑃 < 0.001) and PE decreased significantly during replacement (𝑃 = 0.01) as
shown inTable 3.
MAP (𝑃 < 0.001), HR and CO (𝑃 < 0.05), DPAP
(𝑃 < 0.01), SvjO2,and cerebral oxygen saturation (𝑃 < 0.01)
increased significantly in both groups (Table 2andFigure 2).
No significant differences between groups were found in this period in any parameter.
3.2. Correlation Analysis. During volume replacement,
cor-relations were found between MAP and 𝐶𝑝 (𝑟 = −0.66;
𝑃 < 0.01), HR and CO (𝑟 = 0.81; 𝑃 < 0.001), and HR and
𝐶𝑝(𝑟 = −0.52; 𝑃 = 0.02).
Regarding the EEG-derived parameters, there were corre-lations between TP and HR (𝑟 = 0.62; 𝑃 < 0.001) and a strong correlation between TP and SR (𝑟 = −0.70; 𝑃 < 0.001). BIS showed correlation with SRSEF (𝑟 = 0.58𝑃 < 0.001). TP was
correlated with𝐶𝑝(−0.68; 𝑃 < 0.001). AE was correlated with
PE (𝑟 = 0.60; 𝑃 < 0.001) and with SRPE (𝑟 = 0.76; 𝑃 < 0.001).
Final Phase. At the end of the study, the𝐶𝑝was significantly
higher in the GLRthan the GHES(𝑃 = 0.02), but the propofol
metabolites concentration was not different between groups
(𝑃 = 0.06). When the 𝐶𝑝 values were divided by the total
volume of propofol administered to check for influences of the duration of propofol infusion on the final concentrations
of the drug, the values were still significantly lower in GHES
(𝑃 = 0.033; GLRwith0.07 ± 0.02 versus GLRwith0.05 ± 0.01).
There were no significant differences in the total volume of propofol administered between groups (𝑃 = 1.0).
No significant differences between groups were found in this period in any of the remaining parameters.
MAP decreased significantly in the final hour (𝑃 = 0.02), HR showed no changes (𝑃 = 0.07), and CO decreased only
in the GLR (𝑃 = 0.03) but was kept constant on the GHES
(𝑃 = 0.77) (Table 2andFigure 3). Similarly, SvjO2decreased
significantly in GLR (𝑃 = 0.008) but was unaltered in GHES
(𝑃 = 0.64) (Table 2 and Figure 2). There were significant
differences in DPAP between groups (𝑃 = 0.04).
Regarding the EEG-derived parameters, no changes were observed in any of the parameters in the final period (Table 3).
T a ble 2: M ea n ar ter ial p re ssur e (MAP : mmH g), h ea rt ra te (HR: b p m), ca rdiac o u tp u t (C O: L min −1 ), Sv jO 2 (%), cer eb ral o x yg en sa tura tio n gi ven by th e INV OS, % o f o x yg en ext rac tio n (S pO 2 -S vjO 2 ), p ro p o fo l p lasma co ncen tr at io n (𝐶 𝑝 :𝜇 g/ m L ), an d prop ofol m et ab o li te s con ce n tr at io n (𝐶 met :𝜇 g/mL) at ea ch st ud y p has e: A :r ig h t b ef o re th e st ar t o f b leedin g; B: at th e end o f b leedin g/st ar t o f the wa it in g p er io d; C: at th e end o f th e w ai ti n g p er io d /st ar t o f th e vo lume rep lacemen t p er io d; D: at th e end o f th e vo lume rep lacemen t p er io d/st ar t o f the final p h as e; an d E : at th e en d o f th e st u d y. GLR :g ro u p th at re cei ve d lac ta te d R in ge r’s fo r vo lu me re p lacemen t; GHES :g ro u p th at re cei ve d h yd ro x yet h yl st ar ch fo r vo lu me re p lacemen t. M ea n ± st an da rd de via tio n is sho w n. The n u m b er o f animals (𝑁 ) in eac h gr o u p fo r eac h p ar am et er is sho w n. MAP (mmH g) HR (b p m ) C O (L m in −1) SvjO 2 (%) Ce re b ra lo x yg en sa tu ra ti o n %o fo x yg en extractio n (S pO 2 -S vjO 2 ) 𝐶𝑝 (𝜇 g/mL) 𝐶met (𝜇 g/mL) GLR (𝑁= 6) GHES (𝑁= 6) GLR (𝑁= 6) GHES (𝑁= 6) GLR (𝑁= 6) GHES (𝑁= 6) GLR (𝑁= 6) GHES (𝑁= 6) GLR (𝑁= 6) GHES (𝑁= 6) GLR (𝑁= 6) GHES (𝑁= 6) GLR (𝑁= 5) ¤ GHES (𝑁= 5) ¤ GLR (𝑁= 5) ¤ GHES (𝑁= 5) ¤ A7 2. 1± 11.3 73.3 ± 6.9 76 .2 ± 16.2 76 .3 ± 17 .5 4 .9 ± 1.3 4 .3 ± 0.9 83.8 ± 10.1 81.5 ± 9. 8 61 .0 ± 6.8 63.5 ± 6.0 14.6 ± 6.4 23.4 ± 3.4 4 .6 ± 1.2 4 .5 ± 0.5 0 .0 9 ± 0.0 6 0.05 ± 0.0 4 B 33 .7 ± 5.8 ∗∗ 34 .9 ± 6.1 4 ∗∗ 77 .1 ± 24 .7 85 .8 ± 28 .2 2.0 ± 0.8 ∗∗ 1.8 ± 0.2 ∗∗ 68 .9 ± 13.9 ∗∗ 75 .6 ± 8.5 ∗∗ 53 .8 ± 11.1 ∗∗ 51.5 ± 5.3 ∗∗ 30 .3 ± 15.4 29 .7 ± 4.9 6.0 ± 1.3 ∗∗ 5.5 ± 0.9 ∗∗ 0.1 0 ± 0.05 0.08 ± 0.0 4 C 47 .4 ± 6.4 ∗∗ 51.3 ± 10 .6 ∗∗ 77 .9 ± 28 .4 80.9 ± 34 .3 2. 3 ± 0.6 2.7 ± 1.8 59 .3 ± 21.1 ∗ 66 .5 ± 7. 6 ∗ 53 .8 ± 9. 5 52 .2 ± 5.8 35.9 ± 22.2 30 ± 4.3 5.7 ± 1.3 5.5 ± 1.6 0 .13 ± 0.0 4 0.1 0 ± 0.07 D 79 .7 ± 21.6 ∗∗ 82 .8 ± 17 .7 ∗∗ 81.9 ± 19 .2 ∗ 90 .1 ± 20.9 ∗ 4.7 ± 2.0 ∗ 5.5 ± 1.4 ∗ 76 .1 ± 9. 2 ∗∗ 72 .7 ± 7. 2 ∗∗ 59 .1 ± 4.9 ∗∗ 58.5 ± 8.3 ∗∗ 25 .9 ± 10 .2 27 ± 4.4 5.0 ± 0.8 3.5 ± 0.4 0 .1 4 ± 0.05 0.08 ± 0.0 4 E 76 .5 ± 22.8 ∗ 79 .2 ± 13.7 ∗ 81.9 ± 17 .6 93 .0 ± 14 .4 4.1 ± 1.6 ∗ 5.4 ± 1.7 73.0 ± 11.7 78.1 ± 15.4 58.8 ± 4.2 61 .3 ± 6.1 ∗ 30 .2 ± 12.6 25 .4 ± 10 .0 5.2 ± 1.2 ¥ 3.4 ± 0.3 3 ¥ 0.1 4 ± 0.0 6 0.0 9 ± 0.05 ¤The n u m b er o f an ima ls fo r th e 𝐶𝑝 and 𝐶met was 𝑁= 5 d u e to a te ch nical p ro b lem wi th th e G CMS an al ysi s o f th e p la sm a sa m p les o f tw o an im al s. Si gn ifi ca n tl y d iffe re n t fr om th e p re vi ou s m ea su re m en t: ∗ 𝑃 < 0.05 , ∗∗ 𝑃 < 0.01 le ve l. ¥ Significa n t diff er ences b etw een gr o u p s at the 𝑃 < 0.05 le ve l.
T a b le 3: Suppre ss ion ra ti o (SR :% ), to ta l p owe r (T PEEG :𝜇 V), sp ec tral edg e fr eq u enc y (S EF :H z), b isp ec tral index (BIS), ap p ro xima te en tr o p y (AE), p er m u ta tio n en tr o p y (P E ), SR co rr ec te d SE F (S R SE F : H z), an d SR co rr ec ted PE (S RPE) at ea ch st ud y p has e: A : rig h t b ef o re th e st ar t o f b leedin g; B: in th e end o f b leedin g/st ar t o f the wa it in g p er io d ;C :i nt h e en do ft h e w ai ti n g p er io d /st ar t o f th e vo lume rep lacemen t p er io d; D: in th e end o f th e vo lume rep lacemen t p er io d/st ar t o f the fina l p h as e; an d E : in the end o f the st ud y. GLR : gr o u p th at re cei ve d lac ta te d Rin ger ’s fo r vo lume rep lacemen t; GHES :g ro u p th at re cei ve d h yd ro x yet h yl st ar ch fo r vo lu me re p lacemen t. M ea n ± st an da rd de via tio n is sho wn. Th e n um b er o f animals (𝑁 )i ne ac hg ro u p fo r ea ch p ara meter is sho w n . SR (% ) T PEEG (𝜇 V ) SE F (Hz ) B IS A E P E SR SE F (Hz ) SR P E GLR (𝑁= 6) GHES (𝑁= 6) GLR (𝑁= 6) GHES (𝑁= 6) GLR (𝑁= 6) GHES (𝑁= 6) GLR (𝑁= 6) GHES (𝑁= 6) GLR (𝑁= 6) GHES (𝑁= 6) GLR (𝑁= 6) GHES (𝑁= 6) GLR (𝑁= 6) GHES (𝑁= 6) GLR (𝑁= 6) GHES (𝑁= 6) A0 .0 ± 0.0 5.9 ± 14 .4 59 .4 ± 3.3 59 .6 ± 5.3 14.9 ± 0.9 14.9 ± 1.3 6 4.2 ± 5.7 55.8 ± 7. 7 0 .7 4 ± 0.15 0.7 6 ± 0.12 0.86 ± 0.0 9 0.8 4 ± 0.0 9 14 .9 ± 0.9 13.9 ± 1.3 0 .8 6 ± 0.0 9 0.79 ± 0.1 6 B0 .2 3 ± 0.5 6 7. 1± 16.9 57 .7 ± 3.9 ∗∗ 57 .9 ± 5.2 ∗∗ 14 .7 ± 1.5 15.4 ± 1.9 56 .3 ± 7. 4 ∗ 56 .0 ± 15.9 ∗ 0.8 2 ± 0.13 0.7 7 ± 0.13 0.87 ± 0.0 9 0.8 5 ± 0.1 0 14 .7 ± 1.6 14.1 ± 1.7 0 .87 ± 0.0 9 0.79 ± 0.1 8 C2 .5 ± 5.1 11.9 ± 29 .1 56 .3 ± 4.6 ∗∗ 57 .5 ± 5.2 ∗∗ 15.6 ± 1.3 15.6 ± 0.8 59 .6 ± 5.8 55.1 ± 21.4 0.84 ± 0.12 0.7 6 ± 0.15 0.8 9 ± 0.0 9 ∗ 0.8 5 ± 0.0 9 ∗ 15.1 ± 0.9 13.8 ± 4.5 0 .87 ± 0.1 0 0.7 4 ± 0.2 5 D0 .1 5 ± 0.3 4 13.6 ± 33 .3 57 .7 ± 3.3 ∗∗ 57 .9 ± 6.7 ∗∗ 14 .9 ± 0.6 15.1 ± 1.5 63.3 ± 4.4 51.9 ± 22.1 0.8 3 ± 0.12 0.7 8 ± 0.12 0.8 5 ± 0.0 9 ∗0.8 4 ± 0.0 9 ∗ 14 .9 ± 0.5 12.2 ± 4.4 0 .85 ± 0.0 9 0.7 2 ± 0.29 E0 .0 ± 0.0 9.7 ± 23 .7 57 .8 ± 3.2 58.3 ± 5.8 15.6 ± 1.2 15.0 ± 1.2 63.1 ± 3.5 53.2 ± 18 .0 0 .82 ± 0.1 4 0.7 7 ± 0.15 0.86 ± 0.0 9 0.8 4 ± 0.0 9 15.6 ± 1.2 13.3 ± 3.1 0 .8 6 ± 0.0 9 0.7 6 ± 0.22 Si gn ifi ca n tl y d iffe re n t fr om th e p re vi ou s m ea su re m en t: ∗𝑃 < 0.05 , ∗∗𝑃 < 0.01 le ve l.
All of the pigs survived the study period. Postmortem evaluation during necropsy revealed correct positioning of all catheters and no macroscopic damage in the internal organs.
4. Discussion
This study had two major objectives: (1) to investigate the effects of acute bleeding on propofol plasma concentra-tions, cerebral oxygenation, EEG-derived parameters, and haemodynamics and (2) to compare the effects of volume replacement with a colloid (hydroxyethyl starch 130/0.4) and a crystalloid (lactated Ringer’s) on the same parameters in pigs under propofol and remifentanil total intravenous anaesthesia.
The amount of blood withdrawn from each pig in our study represents around 50% of the pig’s total blood
volume [28], causing a severe haemodynamic depression
and a decrease in the cerebral oxygenation, accompanied by an increase in the propofol plasma concentrations and electroencephalographic depression, reflected in a decrease in TP and BIS.
At the end of the volume replacement with HES or with LR, the plasma concentrations of propofol were higher in the LR group, when compared to the HES group, although no significant differences were observed in the EEG parameters between the two groups.
The increased propofol concentrations observed in our study after bleeding are in agreement with reports from previous studies that also observed an increase in plasma
concentrations of propofol after hemorrhagic shock [5, 13,
15]. However, our study reveals different effects caused by
volume replacement with crystalloid or colloid solutions on the pharmacokinetics of propofol. In a study in pigs fluid resuscitation was found to restore the pharmacokinetic alter-ation of propofol after hemorrhagic shock, but not the
phar-macodynamic alteration [15]. The mechanism is unclear, but
some reports suggest that it could be explained by an increase
in the unbound propofol after aggressive haemodilution [29].
In another study in pigs the effect of three kinds of fluid infusion after high-volume blood loss on the pseudo-steady-state propofol concentration was compared: a volume of LR or hydroxyethyl starch equivalent to the blood withdrawn and a threefold volume of LR. The results showed that the pseudo-steady-state concentration is influenced differently depending on the method of fluid infusion after haemorrhage
[30]. In the present study, differences in the circulatory blood
volume between the two groups could explain the different concentrations of propofol obtained. However, it could also be explained by a possible interaction between HES and
propofol, as found in previous laboratorial work [31,32].
According to distinct characteristics of the physiologic solutions, colloids may assure better tissue perfusion when
compared to crystalloids [33]. During the volume
replace-ment phase, HES 130/0.4 could have assured a more efficient hepatic, renal, and pulmonary perfusion by increasing tissue microcirculation, which may have occurred less efficiently
in the LR group [34]. However, because there were no
significant differences in cardiac output between the two
groups during replacement, the existence of overall supply differences between the two groups cannot be inferred.
Near-infrared spectroscopy (NIRS) such as the INVOS monitor used in this study may be used to noninvasively and continuously monitor changes in the regional oxygen satura-tion, reflecting the balance between cerebral oxygen supply
and demand [11, 35]. In normal physiological conditions,
changes in cerebral blood flow result in changes in oxygen delivery to the peripheral cortex, which could be detected by NIRS. On the other hand, the brain venous blood oxygen
saturation (SvjO2) monitoring provides information about
the global brain oxygenation but does not provide
informa-tion about regional cortex blood supply [36]. Cerebral oxygen
saturation recorded with the INVOS monitor has been shown to have an excellent correlation with the invasive methods
of assessing cerebral oxygenation in a study in humans [11].
The decrease in cerebral oxygen saturation values reflected by INVOS during bleeding in our study followed the decrease in cardiac output and preload.
In our study, both cerebral oxygen saturation reflected
by INVOS and SvjO2 decreased during bleeding reflecting
changes in cerebral perfusion and oxygenation caused by hypovolemia. In healthy individuals, the brain blood supply is under regulation of the brain itself, if the mean arterial
pres-sure is kept between 60 and 160 mmHg [37]. Mean arterial
pressure values below 60 mmHg, such as those observed in
our study, may cause a reduction in cerebral blood flow [38].
Furthermore, diastolic pulmonary pressure values which reflect the preload decreased during bleeding which may also explain the possible decrease in brain perfusion.
It is known that hypovolemia increases the effect of
propofol in the brain [13, 39] which has been explained
mainly by an increase in drug concentration induced by a reduction in the distribution volume and clearance and by an increase in end-organ sensitivity. Recent reports suggest that increases in the unbound propofol during shock could
explain this mechanism [29]. This could have been the origin
of the EEG changes observed during bleeding in the present study. On the other side, some studies also show the potential
of the EEG to reflect ischemia during surgery [40–43]. The
burst suppression seems to reflect cerebral ischemia due to the decrease in the amplitude of the EEG normally associated with cerebral ischemia. However, because in the present study bleeding also caused an increase in the propofol plasma concentrations, it is difficult to tell if the increase observed in SR and TP was due to hypotension or a relative increase in the propofol concentrations.
Despite the significant decrease in MAP caused by bleed-ing, no compensatory increase in heart rate was observed. This might be related to the marked resetting effect of
propo-fol on the reflex set point previously observed in humans [44].
During the 20-minute waiting period after bleeding, animals revealed a physiologic capacity to minimize the haemody-namic depression. The endogenous homeostatic vasopressor mechanisms, including the sympathetic nervous system, the renin-angiotensin-aldosterone system, and local determi-nants of vascular tone, including nitric oxide and endothelin, are responsible for the initial compensatory mechanisms for hypovolemia. Once the compensatory reserve of these
homeostatic mechanisms is exceeded, cardiovascular
decom-pensation and shock may occur [45].
During the 20-minute waiting period, there were no changes in the propofol plasma concentrations, and the
decrease in SvjO2and in the electroencephalographic
depres-sion reflected by TP was more evident. Although in our study it was not possible to observe significant changes in any of the other EEG-derived parameters, this observation supports the hypothesis that EEG-derived parameters may reflect changes
in brain hypoperfusion [40,46,47].
Fluid replacement caused a recovery in the haemody-namic variables and in cerebral oxygenation both in the group that received LR and in the group that received the HES. There were also changes in the EEG parameters with an increase in the TP, but with no differences between the two groups during the volume replacement phase. How-ever, approximately one hour after the end of the volume replacement and when comparing with the end of volume replacement values, the group that received LR showed a
decrease in cardiac output values and lower SvjO2values and
in cerebral oxygen saturation reflected by INVOS. This did not occur with the group that received HES that showed
similar CO and SvjO2values when compared to the end of
volume replacement. This difference might be related to a better preload maintenance with HES as can be observed in the diastolic pulmonary pressure values.
The SvjO2 is an invasive technique to measure cerebral
oxygenation using the internal jugular venous blood oxygen saturation. However, its use is not straightforward and dif-ficulties in its use may be related to potential malposition of catheter, resulting in contamination with extracerebral blood, as well as motion artefacts, which may render readings
obtained by SvjO2unreliable [12,48].
Furthermore, it has been shown that in pigs the cerebral
outflow is not only via the internal jugular vein [49]. This
may explain the almost absent response of SvjO2to bleeding
in one of the groups in our study. In our study, the reversal of the haemodynamic depressing effects of bleeding was similar in both volume replacement regimens, which is in agreement with the observations of a recent study in
human patients with septic shock [50]. Nevertheless, the
maintenance of a higher CO and cerebral oxygen saturation reflected by INVOS reveals a better capacity of HES to maintain the intravascular volume and cerebral perfusion after replacement, with a longer lasting effect than LR. These results are in agreement with previous suggestions that colloids improve cardiac performance in patients with
hypovolemia [51, 52] and are probably related to the fact
that crystalloids are electrolyte solutions that lack intrinsic
colloid osmotic pressure, entering the interstitial space [53]
and remaining in less of 30% of the total volume administered
in the intravascular space [51,54]. On the other hand, colloids
have an osmotic pressure similar to plasma, staying largely confined to the intravascular space; this allows an increase in mean arterial pressure with greater longevity in cases of
severe hypovolemia [55].
Some limitations of this study should be noted. The BIS as a monitor of anaesthetic depth in animals has not been validated. Although several studies showed that BIS
decreased with increasing anaesthetic doses [56–58]; the
index was developed from a database of electroencephalo-grams recorded in humans and caution is required when interpreting its values in animals. Another important point is the variation in the duration of study periods, as they might have introduced variability in the results.
Also, because an isobaric hemorrhage model was not adopted in this study, different metabolic states could be observed in the studied groups after bleeding which could compromise the comparisons performed. However, both groups of animals underwent similar changes in mean arterial pressure values during bleeding and also similar blood parameters values indicating similar metabolic state. Another limitation may be related to the fluid infusion schemes adopted. The fluid infusion was chosen based on preliminary trials in which a similar haemodynamic recovery (considering MAP values) was observed. However, after analysis of the data in the present paper, namely, the cardiac output and pulmonary artery diastolic pressure, it is possible to conclude that, although the recovery during replacement was similar in both groups, the preload seemed to be better maintained by HES when the fluids were no longer being administered.
5. Conclusions
In conclusion, after around 50% of the total blood, the intravenous delivery of HES 130/0.4 was associated with a decrease in propofol plasma concentrations indicating a possible effect of HES in the propofol pharmacokinetics. Volume replacement with lactated Ringer’s and HES 130/0.4 had similar restoration of all the physiologic parameters, but HES 130/0.4 was capable of maintaining the cardiac output and cerebral oxygenation until one hour after the end of its administration, while lactated Ringer’s was not. The INVOS monitor seems promising for cerebral oxygenation monitoring in veterinary anaesthesia.
Conflict of Interests
None of the authors has any conflict of interests.
Acknowledgments
This investigation was supported by FEDER funds through the COMPETE program and by national funds from Por-tuguese Foundation for Science and Technology, under the Projects SFRH/BPD/75697/2011, COMPETE: FCOMP-01-0124-FEDER-009525 (PTDC/CVT/101999/2008), and Pest C/EQB/LA0006/2011.
References
[1] K. Lang, J. Boldt, S. Suttner, and G. Haisch, “Colloids versus crystalloids and tissue oxygen tension in patients undergoing major abdominal surgery,” Anesthesia and Analgesia, vol. 93, no. 2, pp. 405–409, 2001.
[2] J. Edwards, “A new debate: colloid versus colloid?” in Yearbook
of Intensive Care and Emergency Medicine, J. Vincent, Ed., pp.
152–164, Springer, Berlin, Germany, 1994.
[3] L. Thijs, “Fluid therapy in septic shock,” in Clinical Trials for
the Treatment of Sepsis: Update in Intensive Care and Emergency Medicine, W. Sibbald and J. Vincent, Eds., pp. 167–190, Springer,
Berlin, Germany, 1995.
[4] S. Lauwick, M. English, and T. M. Hemmerling, “An unusual case of cerebral hypoperfusion detected by bispectral index monitoring,” Canadian Journal of Anesthesia, vol. 54, no. 8, pp. 680–681, 2007.
[5] T. Kurita, K. Morita, T. Kazama, and S. Sato, “Influence of cardiac output on plasma propofol concentrations during constant infusion in swine,” Anesthesiology, vol. 96, no. 6, pp. 1498–1503, 2002.
[6] J. A. Myburgh, S. Finfer, R. Bellomo et al., “Hydroxyethyl starch or saline for fluid resuscitation in intensive care,” The New
England Journal of Medicine, vol. 367, pp. 1901–1911, 2012.
[7] N. Huang, C. Kalyanaraman, J. J. Irwin, and M. P. Jacobson, “Physics-based scoring of protein—ligand complexes: enrich-ment of known inhibitors in large-scale virtual screening,”
Journal of Chemical Information and Modeling, vol. 46, no. 1, pp.
243–253, 2006.
[8] E. Cavus, P. Meybohm, V. Doerges et al., “Effects of cerebral hypoperfusion on bispectral index: a randomised, controlled animal experiment during haemorrhagic shock,” Resuscitation, vol. 81, no. 9, pp. 1183–1189, 2010.
[9] T. Kurita and S. Sato, “Does the bispectral index (BIS) during haemorrhagic shock and resuscitation reflect a change in cerebral perfusion or simply reflect the anaesthetic depth?”
Resuscitation, vol. 83, no. 10, Article ID e193, 2012.
[10] T. Kurita, M. Uraoka, K. Morita, and S. Sato, “Influence of progressive hemorrhage and subsequent cardiopulmonary resuscitation on the bispectral index during isoflurane anaes-thesia in a swine model,” Journal of Trauma and Acute Care
Surgery, vol. 72, no. 6, pp. 1614–1619, 2012.
[11] N. Nagdyman, P. Ewert, B. Peters, O. Miera, T. Fleck, and F. Berger, “Comparison of different near-infrared spectroscopic cerebral oxygenation indices with central venous and jugular venous oxygenation saturation in children,” Paediatric
Anaes-thesia, vol. 18, no. 2, pp. 160–166, 2008.
[12] S. P. Gopinath, C. S. Robertson, C. F. Contant et al., “Jugular venous desaturation and outcome after head injury,” Journal of
Neurology Neurosurgery and Psychiatry, vol. 57, no. 6, pp. 717–
723, 1994.
[13] K. B. Johnson, T. D. Egan, S. E. Kern et al., “The influence of hemorrhagic shock on propofol: a pharmacokinetic and pharmacodynamic analysis,” Anesthesiology, vol. 99, no. 2, pp. 409–420, 2003.
[14] T. Kazama, T. Kurita, K. Morita, J. Nakata, and S. Sato, “Influence of hemorrhage on propofol pseudo-steady state concentration,” Anesthesiology, vol. 97, no. 5, pp. 1156–1161, 2002. [15] K. B. Johnson, T. D. Egan, S. E. Kern, S. W. McJames, M. L. Cluff, and N. L. Pace, “Influence of hemorrhagic shock followed by crystalloid resuscitation on propofol: a pharmacokinetic and pharmacodynamic analysis,” Anesthesiology, vol. 101, no. 3, pp. 647–659, 2004.
[16] N. Bressan, Integrated Anaesthesia Software: Data Acquisition,
Controlled Infusion Schemes and Intelligent Alarms, in Engen-haria Biom´edica, University of Porto, Porto, Portugal, 2011.
[17] C. Madjdpour, N. Dettori, P. Frascarolo et al., “Molecular weight of hydroxyethyl starch: is there an effect on blood coagulation and pharmacokinetics?” British Journal of Anaesthesia, vol. 94, no. 5, pp. 569–576, 2005.
[18] J. Helfenbein, C. Lartigue, E. Noirault et al., “Isotopic effect study of propofol deuteration on the metabolism, activity, and toxicity of the anesthetic,” Journal of Medicinal Chemistry, vol. 45, no. 26, pp. 5806–5808, 2002.
[19] J. Guitton, M. Desage, A. Lepape, C. S. Degoute, M. Maanchon, and J. L. Brazier, “Quantitation of propofol in whole blood by gas chromatography-mass spectrometry,” Journal of
Chro-matography B: Biomedical Applications, vol. 669, no. 2, pp. 358–
365, 1995.
[20] A. Silva, S. Campos, J. Monteiro et al., “Performance of anesthetic depth indexes in rabbits under propofol anesthe-sia: prediction probabilities and concentration-effect relations,”
Anesthesiology, vol. 115, no. 2, pp. 303–314, 2011.
[21] X. Li, S. Cui, and L. J. Voss, “Using permutation entropy to measure the electroencephalographic effects of sevoflurane,”
Anesthesiology, vol. 109, no. 3, pp. 448–456, 2008.
[22] D. Jordan, G. Stockmanns, E. F. Kochs, S. Pilge, and G. Schnei-der, “Electroencephalographic order pattern analysis for the separation of consciousness and unconsciousness: an analysis of approximate entropy, permutation entropy, recurrence rate, and phase coupling of order recurrence plots,” Anesthesiology, vol. 109, no. 6, pp. 1014–1022, 2008.
[23] J. Bruhn, H. R¨opcke, and A. Hoeft, “Approximate entropy as an electroencephalographic measure of anesthetic drug effect during desflurane anesthesia,” Anesthesiology, vol. 92, no. 3, pp. 715–726, 2000.
[24] R. J. Dinis-Oliveira, P. G. de Pinho, A. C. S. Ferreira et al., “Reactivity of paraquat with sodium salicylate: formation of stable complexes,” Toxicology, vol. 249, no. 2-3, pp. 130–139, 2008.
[25] F. M. Brunkhorst, C. Engel, F. Bloos et al., “Intensive insulin therapy and pentastarch resuscitation in severe sepsis,” The New
England Journal of Medicine, vol. 358, no. 2, pp. 125–139, 2008.
[26] I. J. Rampil, “A primer for EEG signal processing in anesthesia,”
Anesthesiology, vol. 89, no. 4, pp. 980–1002, 1998.
[27] A. Silva, H. Cardoso-Cruz, F. Silva, V. Galhardo, and L. Antunes, “Comparison of anesthetic depth indexes based on thalamocor-tical local field potentials in rats,” Anesthesiology, vol. 112, no. 2, pp. 355–363, 2010.
[28] M. Swindle, “Hematology in Biology, Handling, Husbandry, and Anatomy,” in Swine in the Laboratory: Surgery, Anaesthesia,
Imaging and Experimental Techniques, M. Swindle, Ed., p. 8,
CRC Press, Taylor & Francis, New York, NY, USA, 2007. [29] D. Takizawa, E. Sato, D. Kurosaki, H. Hiraoka, S. Saito, and F.
Goto, “Changes in unbound concentration of propofol during hemorrhage,” Clinical Pharmacology and Therapeutics, vol. 78, no. 1, pp. 93–95, 2005.
[30] T. Kurita, T. Kazama, K. Morita et al., “Influence of fluid infusion associated with high-volume blood loss on plasma propofol concentrations,” Anesthesiology, vol. 100, no. 4, pp. 871–878, 2004.
[31] A. Silva, E. Sousa, A. Palmeira et al., “Interaction between hydroxyethyl starch and propofol: computational and labora-torial study,” Journal of Biomolecular Structure and Dynamics, 2013.
[32] A. L. Dawidowicz and R. Kalitynski, “Effects of intraoperative fluid infusions, sample storage time, and sample handling on unbound propofol assay in human blood plasma,” Journal of
Pharmaceutical and Biomedical Analysis, vol. 37, no. 5, pp. 1167–
1171, 2005.
[33] D. A. Otsuki, D. T. Fantoni, C. B. Margarido et al., “Hydrox-yethyl starch is superior to lactated Ringer as a replacement fluid in a pig model of acute normovolaemic haemodilution,” British
Journal of Anaesthesia, vol. 98, no. 1, pp. 29–37, 2007.
[34] W. Funk and V. Baldinger, “Microcirculatory perfusion during volume therapy: a comparative study using crystalloid or colloid in awake animals,” Anesthesiology, vol. 82, no. 4, pp. 975–982, 1995.
[35] A. Casati, G. Fanelli, P. Pietropaoli, R. Proietti, R. Tufano, and S. Montanini, “Monitoring cerebral oxygen saturation in elderly patients undergoing general abdominal surgery: a prospective cohort study,” European Journal of Anaesthesiology, vol. 24, no. 1, pp. 59–65, 2007.
[36] H. P. Grocott, S. Davie, and C. Fedorow, “Monitoring of brain function in anesthesia and intensive care,” Current Opinion in
Anaesthesiology, vol. 23, no. 6, pp. 759–764, 2010.
[37] W. J. Powers, “Cerebral hemodynamics in ischemic cerebrovas-cular disease,” Annals of Neurology, vol. 29, no. 3, pp. 231–240, 1991.
[38] R. M. Berne and M. N. Levy, The Cardiovascular System
Physiology, The C. V. Mosby Company, St. Louis, Mo, USA, 1988.
[39] P. De Paepe, F. M. Belpaire, M. T. Rosseel, G. Van Hoey, P. A. Boon, and W. A. Buylaert, “Influence of hypovolemia on the pharmacokinetics and the electroencephalographic effect of propofol in the rat,” Anesthesiology, vol. 93, no. 6, pp. 1482–1490, 2000.
[40] E. Z. Golukhova, A. G. Polunina, N. P. Lefterova, and A. V. Begachev, “Electroencephalography as a tool for assessment of brain ischemic alterations after open heart operations,” Stroke
Research and Treatment, vol. 2011, Article ID 980873, 14 pages,
2011.
[41] J. H. Kim, S. H. Kim, S. K. Yoo, J. Y. Kim, and Y. T. Nam, “The effects of mild hypothermia on thiopental-induced elec-troencephalogram burst suppression,” Journal of Neurosurgical
Anesthesiology, vol. 10, no. 3, pp. 137–141, 1998.
[42] P. S. Myles, “Bispectral index monitoring in ischemic-hypoxic brain injury,” Journal of Extra-Corporeal Technology, vol. 41, no. 1, pp. P15–P19, 2009.
[43] P. S. Myles, D. Daly, A. Silvers, and S. Cairo, “Prediction of neurological outcome using bispectral index monitoring in patients with severe ischemic-hypoxic brain injury undergoing emergency surgery,” Anesthesiology, vol. 110, no. 5, pp. 1106–1115, 2009.
[44] P. M. Cullen, M. Turtle, C. Prys-Roberts, W. L. Way, and J. Dye, “Effect of propofol anesthesia on baroreflex activity in humans,”
Anesthesia and Analgesia, vol. 66, no. 11, pp. 1115–1120, 1987.
[45] A. Vercueil, M. P. W. Grocott, and M. G. Mythen, “Physiology, pharmacology, and rationale for colloid administration for the maintenance of effective hemodynamic stability in critically ill patients,” Transfusion Medicine Reviews, vol. 19, no. 2, pp. 93– 109, 2005.
[46] M. Hayashida, M. Chinzei, K. Komatsu et al., “Detection of cerebral hypoperfusion with bispectral index during paediatric
cardiac surgery,” British Journal of Anaesthesia, vol. 90, no. 5, pp. 694–698, 2003.
[47] T. M. Hemmerling, J.-F. Olivier, F. Basile, N. Le, and I. Prieto, “Bispectral index as an indicator of cerebral hypoperfusion during off-pump coronary artery bypass grafting,” Anesthesia
and Analgesia, vol. 100, no. 2, pp. 354–356, 2005.
[48] G. Rosenthal, J. C. Hemphill, and G. Manley, “Brain tissue oxygen tension is more indicative of oxygen diffusion than oxygen delivery and metabolism in patients with traumatic brain injury,” Critical Care Medicine, vol. 37, no. 1, pp. 379–380, 2009.
[49] P. Lavoie, P. Metellus, L. Velly et al., “Functional cerebral venous outflow in Swine and Baboon: feasibility of an intracranial venous hypertension model,” Journal of Investigative Surgery, vol. 21, no. 6, pp. 323–329, 2008.
[50] O. Bayer, K. Reinhart, M. Kohl et al., “Effects of fluid resus-citation with synthetic colloids or crystalloids alone on shock reversal, fluid balance, and patient outcomes in patients with severe sepsis: a prospective sequential analysis,” Critical Care
Medicine, vol. 40, no. 9, pp. 2543–2551, 2012.
[51] E. C. Rackow, J. L. Falk, and I. A. Fein, “Fluid resuscitation in circulatory shock: a comparison of the cardiorespiratory effects of albumin, hetastarch, and saline solutions in patients with hypovolemic and septic shock,” Critical Care Medicine, vol. 11, no. 11, pp. 839–850, 1983.
[52] R. J. Trof, S. P. Sukul, J. W. R. Twisk, A. R. J. Girbes, and A. B. J. Groeneveld, “Greater cardiac response of colloid than saline fluid loading in septic and non-septic critically ill patients with clinical hypovolaemia,” Intensive Care Medicine, vol. 36, no. 4, pp. 697–701, 2010.
[53] K. Hillman, G. Bishop, and P. Bristow, “The crystalloid versus colloid controversy: present status,” Bailliere’s Clinical
Anaesthe-siology, vol. 11, no. 1, pp. 1–13, 1997.
[54] A. J. Twigley and K. M. Hillman, “The end of the crystalloid era? A new approach to peri-operative fluid administration,”
Anaesthesia, vol. 40, no. 9, pp. 860–871, 1985.
[55] H. Hjelmqvist, “Colloids versus crystalloids,” Current
Anaesthe-sia and Critical Care, vol. 11, no. 1, pp. 7–10, 2000.
[56] S. A. Greene, G. J. Benson, W. J. Tranquilli, and K. A. Grimm, “Effect of isoflurane, atracurium, fentanyl, and noxious stimu-lation on bispectral index in pigs,” Comparative Medicine, vol. 54, no. 4, pp. 397–403, 2004.
[57] M. F. Mart´ın-Cancho, J. R. Lima, L. Luis et al., “Bispectral index, spectral edge frequency 95%, and median frequency recorded for various concentrations of isoflurane and sevoflurane in pigs,”
The American Journal of Veterinary Research, vol. 64, no. 7, pp.
866–873, 2003.
[58] M. F. Mart´ın-Cancho, J. R. Lima, L. Luis et al., “Bispectral index, spectral edge frequency 95% and median frequency recorded at varying desflurane concentrations in pigs,” Research
Submit your manuscripts at
http://www.hindawi.com
Veterinary MedicineJournal of
Hindawi Publishing Corporation
http://www.hindawi.com Volume 2014
Veterinary Medicine International
Hindawi Publishing Corporation
http://www.hindawi.com Volume 2014
Hindawi Publishing Corporation
http://www.hindawi.com Volume 2014
International Journal of
Microbiology
Hindawi Publishing Corporation
http://www.hindawi.com Volume 2014
Animals
Journal ofEcology
Hindawi Publishing Corporation
http://www.hindawi.com Volume 2014
Psyche
Hindawi Publishing Corporation
http://www.hindawi.com Volume 2014
Evolutionary Biology
International Journal of
Hindawi Publishing Corporation
http://www.hindawi.com Volume 2014
Hindawi Publishing Corporation http://www.hindawi.com
Applied &
Environmental
Soil Science
Volume 2014 Biotechnology Research International Hindawi Publishing Corporationhttp://www.hindawi.com Volume 2014 Hindawi Publishing Corporation
http://www.hindawi.com Volume 2014
Hindawi Publishing Corporation
http://www.hindawi.com Volume 2014
Journal of
Parasitology Research
Hindawi Publishing Corporation http://www.hindawi.com
International Journal of
Volume 2014
Zoology
Hindawi Publishing Corporation http://www.hindawi.com
Genomics
International Journal ofVolume 2014
Insects
Journal ofHindawi Publishing Corporation
http://www.hindawi.com Volume 2014
The Scientific
World Journal
Hindawi Publishing Corporation
http://www.hindawi.com Volume 2014
Hindawi Publishing Corporation
http://www.hindawi.com Volume 2014
Viruses
Journal of
Scientifica
Hindawi Publishing Corporation
http://www.hindawi.com Volume 2014
Cell Biology
International Journal ofHindawi Publishing Corporation
http://www.hindawi.com Volume 2014
Hindawi Publishing Corporation
http://www.hindawi.com Volume 2014
Case Reports in