Characterization of Coal Maceral Groups by Micro-Raman Spectroscopy
8
0
0
Texto
(2) REVISTA DA FACULDADE DE CIÊNCIAS. NÚMERO 1. EDIÇÃO ESPECIAL. 2004. Introduction The usefulness of Raman spectroscopy in characterizing the state of structural order of carbonaceous materials, kerogen, coals and graphite was already been demonstrated (Tuinstra e Koenig, 1970; Lespade et al., 1984; Pasteris & Wopenka, 1991; Wopenka & Pasteris, 1993; Bustin et al., 1995); however the punctual characterization of specific coal macerals by this technique is unknown. Several Raman parameters have been used to characterise the structural ordering of carbonaceous material: the frequency and width of the 1580 cm-1 band, the ratio of the intensities of the 1350 cm-1 and 1580 cm-1 peaks, the width of 2700 cm-1 band in the second order spectrum, among others (Tuinstra e Koenig, 1970; Lespade et al., 1984; Pasteris & Wopenka, 1991; Wopenka & Pasteris, 1993; Bustin et al., 1995). The first-order Raman spectrum (recorded from 1200 to 1700 cm-1) of wellcrystallised pure-carbon graphite has one band at ~1582 cm-1 (O peak). The second-order spectrum (recorded from 2350 to 3350 cm-1) shows a feature near 2700 cm-1 (S peak). Progressive disorder in graphite is reflected in the first-order Raman spectrum by a broadening and shifting of the 1582 cm-1 band to higher wavenumbers due to the development of a shoulder around 1620 cm-1 and an additional band near 1350 cm-1 (D peak) (Pasteris & Wopenka, 1991; Wopenka e Pasteris, 1993). O peak at about 1580 cm-1 (E2g mode) is due to the C-C vibrations in an aromatic structure and the D peak (~1350 cm-1) corresponding to different types of structural defects. The ratio of the intensities of the 1350 cm-1 and 1580 cm-1 peaks (ID/IO) has been related to the crystallite size La and its decreasing is generally sensitive to a cristallinity increase. The 2700 cm-1 peak appears only in the final stages of the graphitisation process and is related to three-dimensional ordering (Lespade et al., 1984). The purpose of this study is to describe the Raman spectra obtained on vitrinite, liptinite and inertinite of the same coal and also to compare the Raman parameters between the studied maceral groups.. Analytical method Micro-Raman spectroscopy was performed on polished blocks in vitrinite (collotelinite), liptinite (spores) and inertinite (fusinite) of a high volatile bituminous coal (see tables 1 and 2), using a Labram Dilor- Jobin Yvon-Spex spectrometer attached to an Olympus. 319.
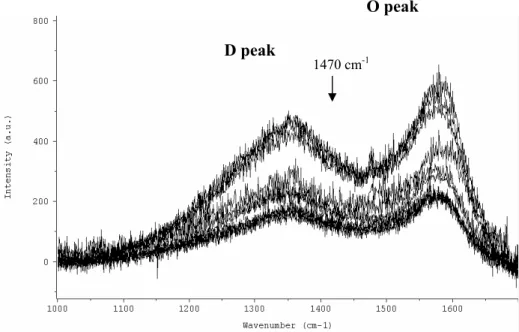
(3) REVISTA DA FACULDADE DE CIÊNCIAS. NÚMERO 1. EDIÇÃO ESPECIAL. 2004. microscope. The excitation was done with 633 nm lines of a He-Ne laser with an output of 20mW. The points were chosen from the most representative and homogeneous parts of the different macerals and each one was scanned from 1200 to 1700 cm-1 for the first order Raman spectrum. Here we characterised the O peak at about 1580 cm-1 and the D peak around 1350 cm-1. The Raman parameters such as the frequency and width of the 1580 cm-1 band, the ratio of the intensities of the 1350 cm-1 and 1580 cm-1 peaks were obtained from the resolution of the first order Raman spectrum using a mixed Gaussian-Lorentzian function and the Labspec program of Dilor-Jobin Yvon. In tables 1 and 2 the characteristics of the coal studied are presented. Table 1 –Vitrinite mean random reflectance value (Rr%) and coal maceral groups, mineral matter free (%, volume). Rr. Vitrinite. Liptinite. Inertinite. 0.6. 41. 4. 55. Table 2 - Proximate and ultimate analysis. Proximate. Ultimate. 1. 2. (daf2, % wg). Ash1. Volatile. Fixed. matter2. carbon2,3. 34.72. 64.93. (d , % wg; daf , % wg). 14.14. 1. C. H. 77.03 4.99. N. S. O3. 1.74. 0.84. 15.4. d– dry; 2daf – dry ash free; 3by difference.. Results The main spectral results from the different maceral groups are shown in Figures 1-3 and in Table 3. All the spectra reveal the presence of the usual peaks at 1580 cm-1 (O peak) and 1350 cm-1 (D peak) on the first-order Raman spectrum, however two additional weaker peaks appear, one around 1170 cm-1 in inertinite (Fig. 3) and another around 1470 cm1. vitrinite and liptinite (Figs. 1, 2). These latter two peaks are associated with the disorder. effects and the later was associated by Mernagh et al. (1984) with the effect of exposure to the laser and attributed to C-O vibrations of surface carboxylates or related oxidized species. No second-order features were observed in the three maceral groups. 320.
(4) REVISTA DA FACULDADE DE CIÊNCIAS. NÚMERO 1. EDIÇÃO ESPECIAL. 2004. O peak D peak. 1470 cm-1. Fig. 1: Raman spetrum obtained on vitrinite.. O peak D peak. 1470 cm-1. Fig. 2: Raman spetrum obtained on liptinite.. Differences in the first-order spectrum between the different maceral groups include a shift of the 1580 cm-1 peak toward higher wavenumbers accompanied by its narrowing from vitrinite to liptinite and inertinite (Tab. 3 and Fig. 4), and a shift of the 1350 cm-1 peak toward lower wavenumber from vitrinite and liptinite to inertinite together with a small narrowing in inertinite (Tab. 3 and Fig. 5). The ratio of the intensities of the 1350 cm-1 321.
(5) REVISTA DA FACULDADE DE CIÊNCIAS. NÚMERO 1. EDIÇÃO ESPECIAL. 2004. and 1580 cm-1 peaks (ID/IO) show a slight increase from vitrinite to inertinite and to liptinite (Fig. 6). The same trend is observed for the ratio of the integrated intensities of the 1350 cm-1 and 1580 cm-1 peaks (SD/SO) (Fig. 7).. O peak D peak. 1170 cm-1. O Peak Width (cm-1). Fig. 3: Raman spetrum obtained on inertinite.. 100 90 80 70 60 50 40 1570. Inertinite Liptinite Vitrinite. 1580 1590 -1 O Peak position (cm ). 1600. Fig. 4: Peak position vs. peak width (FWHM) of O peak of the different maceral groups.. 322.
(6) REVISTA DA FACULDADE DE CIÊNCIAS. NÚMERO 1. EDIÇÃO ESPECIAL. 2004. Table 3 –Raman parameters (mean values) ν. I. W. S. n Min Max Mean STDV n Min Max Mean STDV n Min Max Mean STDV. 10 1344 1351 1350 4 10 1474 1481 1477 2 10 1571 1581 1576 3. 10 137 443 266 126 10 18 92 51 22 10 195 529 312 131. 10 207 213 218 20 10 36 74 55 14 10 73 89 80 5. 10 39023 130099 77230 36173 10 1108 54957 9067 16288 10 20679 62376 36523 15515. n Min Max Mean STDV n Min Max Mean STDV n Min Max Mean STDV. 10 1337 1349 1346 4 10 1474 1486 1477 3 10 1581 1601 1595 6. 10 164 1213 738 390 10 12 115 55 34 10 203 1498 863 488. 10 202 227 212 31 10 3 188 70 73 10 53 69 62 6. 10 46145 379056 185934 126306 10 56 304171 35395 94651 10 19078 121494 75609 38464. n Min Max Mean STDV n Min Max Mean STDV n Min Max Mean STDV. 10 1170 1178 1173 2 10 1324 1339 1335 4 10 1586 1598 1590 4. 10 4 12 9 3 10 92 299 214 64 10 97 396 271 89. 10 21 53 40 10 10 159 190 189 14 10 54 62 58 3. 10 116 865 511 248 10 21620 79424 57289 18040 10 8432 37016 24110 8243. Vitrinite Peak 1350. 1470. 1580. Liptinite Peak 1350. 1470. 1580. Inertinite Peak 1170. 1350. 1580. n: number of analysis; ν: wavenumber (cm-1); I: Raman intensity; W (FWHM): width at half maximum; S: integrated intensity.. 323.
(7) NÚMERO 1. EDIÇÃO ESPECIAL. 300. 2004. Inertinite Liptinite Vitrinite. -1. D Peak Width (cm ). REVISTA DA FACULDADE DE CIÊNCIAS. 250 200 150 1320. 1330 1340 1350 -1 D Peak position (cm ). 1360. Fig. 5: Peak position vs. peak width (FWHM) of D peak of the different maceral groups.. 1,4 Inertinite. ID/IO. 1,2. Liptinite Vitrinite. 1 0,8 0,6. Fig. 6: Intensity ratio of D peak to O peak of the different maceral groups.. 6. Inertinite. SD/SO. Liptinite. 4. Vitrinite. 2 0. Fig. 7: Integrated intensities of D peak to O peak of the different maceral groups.. 324.
(8) REVISTA DA FACULDADE DE CIÊNCIAS. NÚMERO 1. EDIÇÃO ESPECIAL. 2004. Conclusions Raman spectral analysis performed on vitrinite, liptinite and inertinite macerals of the same coal reveals not only the presence of the usual peaks at 1580 cm-1 and 1350 cm-1on the first-order Raman spectrum, but also the presence of two additional weaker peaks, one around 1170 cm-1 in inertinite and another around 1470 cm-1 in vitrinite and liptinite. No second-order features were observed in the three maceral groups. Differences of the first-order spectrum of the different maceral groups include a shift of the 1580 cm-1 peak toward higher wavenumbers accompanied by its narrowing from vitrinite to liptinite and inertinite; a shift of the 1350 cm-1 peak toward lower wavenumber from vitrinite to liptinite and to inertinite together with a small narrowing in the inertinite, a slight increase in the 1350/1580 peak intensity ratio from vitrinite to inertinite and to liptinite. Similar values of integrated intensities of the 1350 cm-1 and 1580 cm-1 peaks ratio were obtained for the different maceral groups.. Acknowledgements This work has been supported by two grants of FCT (SFRH/BPD/5530/200 and SFRH/BPD/5506/2001) and by the project POCTI/CTA/38997/01.. References Bustin, R.M., Ross, J.V. & Rouzaud, J.-N. 1995. Mechanisms of graphite formation from kerogen: experimental evidence. Coal Geology 28: 1-36. Lespade, P.; Marchand, A.; Couzi, M. & Cruege, F. 1984. Caracterisation de materiaux carbones par microspetrometrie Raman. Carbon 22, 4/5: 375-385. Mernagh, T.P., Cooney, R.P. & Johnson, R.A. 1984. Raman spectra of graphon carbon black. Carbon, 22, 1:39-42. Pasteris, J. & Wopenka, B. 1991. Raman spectra of graphite as indicators of degree of metamorphism. Can. Mineral. 29: 1-9. Tuinstra, F. & Koenig, J.L. 1970. Raman spectrum of graphite. J. Chem. Phis. 53 (3): 1126-1130. Wopenka, B. & Pasteris, J. 1993. Structural characterization of kerogens to granulite-facies graphite: Applicability of Raman microprobe spectroscopy. Amer. Mineral. 78: 533-577.. 325.
(9)
Imagem


Documentos relacionados
i) A condutividade da matriz vítrea diminui com o aumento do tempo de tratamento térmico (Fig.. 241 pequena quantidade de cristais existentes na amostra já provoca um efeito
didático e resolva as listas de exercícios (disponíveis no Classroom) referentes às obras de Carlos Drummond de Andrade, João Guimarães Rosa, Machado de Assis,
In an active construction such as (1a) below, for example, its external argument is realized as the syntactic subject, bearing nominative Case and triggering
It turns out, however, that there are no zero modes of the instability that are also bound states.5 This was shown by Hod in the case of a test, massive, charged scalar field on the
Este relatório relata as vivências experimentadas durante o estágio curricular, realizado na Farmácia S.Miguel, bem como todas as atividades/formações realizadas
The probability of attending school four our group of interest in this region increased by 6.5 percentage points after the expansion of the Bolsa Família program in 2007 and
Ousasse apontar algumas hipóteses para a solução desse problema público a partir do exposto dos autores usados como base para fundamentação teórica, da análise dos dados
Correlation of total soluble solids content (SSC) (3A) and chlorophyll content (Chla+b) (3B) with firmness (F) of ‘Rocha’ pear fruit grown in irrigated (Ir) and non-irrigated
![An SEM, EDS and vibrational spectroscopic study of the silicate mineral meliphanite (Ca,Na)2 Be[(Si,Al)2O6 (F,OH)]](data:image/gif;base64,R0lGODlhAQABAIAAAP///wAAACH5BAEAAAAALAAAAAABAAEAAAICRAEAOw==)