Gas exchanges and growth of maize as affected by aeration porosity
and soil compaction
1Trocas gasosas e crescimento do milho em função da porosidade de aeração e
compactação
Francisca Gleiciane da Silva2*, Raimundo Nonato de Assis Junior2, Rosilene Oliveira Mesquita3, Edilaine da
Silva Marques4 and Jaedson Cláudio Anunciato Mota2
ABSTRACT - Based on the hypothesis that less than 10% aeration porosity is sufficient to ensure plant development, the
objective of this study was to evaluate the effect of levels of aeration porosity and soil density on the gas exchange and growth of maize plants. The experiment was conducted in a greenhouse, in randomized blocks in a 2 × 5 factorial arrangement: two densities (1.6 and 1.7 Mg m-3) and five aeration porosities (0.07, 0.08, 0.09, 0.10 and 0.12 m3 m-3), with five replicates. The
interaction between the factors did not have an effect on the analyzed variables. Aeration porosity had a significant effect on photosynthesis, stomatal conductance, relative chlorophyll index (SPAD), plant height and biomass production, whose data were fitted by quadratic models. The highest aeration porosity reduced conductance by 11%, followed by 7% reduction in photosynthesis and 6.4% in SPAD. Aeration porosities lower than 0.10 m3 m-3 did not cause significant reduction in the values
of gas exchange and growth of maize. At soil density of 1.7 Mg m-3, photosynthesis, SPAD, chlorophyll b, total chlorophyll and
carotenoids were higher, but with no increments in biomass and leaf area. It is concluded that aeration porosities greater than 0.10 m3 m-3 are more limiting to plants due to changes in soil attributes, such as penetration resistance and water content. The
highest contents of chlorophyll b and carotenoids at the highest density are acclimatization responses to the stress condition.
Key words: Soil aeration. Physical quality. Ecophysiology. Zea mays L..
RESUMO - Partindo da hipótese de que menos de 10% de porosidade de aeração são suficientes para garantir o
desenvolvimento das plantas, o objetivo deste estudo foi avaliar o efeito de níveis de porosidades de aeração e densidade do solo nas trocas gasosas e no crescimento em plantas de milho. O experimento foi conduzido em casa de vegetação, em blocos aleatorizados no arranjo fatorial (2 × 5): duas densidades (1.6 e 1.7 Mg m-3) e cinco porosidades de aeração (0.07,
0.08, 0.09, 0.10 e 0.12 m3 m-3), com cinco repetições. A interação entre os fatores não causou efeito nas variáveis analisadas.
Houve efeito significativo da porosidade de aeração na fotossíntese, condutância estomática, índice relativo de clorofilas (SPAD), altura de plantas e produção de biomassa, com ajustes ao modelo quadrático. A maior porosidade de aeração reduziu a condutância em 11%, seguido de 7% de redução na fotossíntese e 6.4% no SPAD. Porosidades de aeração menores que 0.10 m3 m-3, não causaram expressiva redução nos valores de trocas gasosas e crescimento do milho. Na densidade do
solo de 1.7 Mg m-3 a fotossíntese, SPAD, clorofila b, total e de carotenoides foram maiores, mas sem incremento na biomassa
e área foliar. Conclui-se que porosidades de aeração maiores que 0.10 m3 m-3 são mais limitantes às plantas em decorrência de
modificações nos atributos do solo, como a resistência à penetração e o conteúdo de água. Os maiores teores de clorofila b e carotenoides na maior densidade são repostas de aclimatação à condição de estresse.
Palavras-chave: Aeração do solo. Qualidade física. Ecofisiologia. Zea mays L..
DOI: 10.5935/1806-6690.20200043 *Author for correspondence
Received for publication 25/07/2019; approved on 14/03/2020
1 Trabalho extraído da Tese do primeiro autor apresentada ao Programa de Pós-Graduação em Ciência do Solo, Universidade Federal do Ceará/UFC 2Departamento de Ciências do Solo, Universidade Federal do Ceará/UFC, Fortaleza-CE, Brasil, [email protected] (ORCID ID
0000-0002-9216-3151), [email protected] (ORCID ID 0000-0002-5892-0454), [email protected] (ORCID ID 0000-0002-1261-9754)
3Departamento de Fitotecnia, Universidade Federal do Ceará/UFC, Fortaleza-CE, Brasil, [email protected] (ORCID ID
0000-0002-6310-8196)
4Instituto Federal de Educação, Ciência e Tecnologia do Maranhão/ IFMA, Campus Buriticupu-MA, Brasil,[email protected]
INTRODUCTION
The continuous exchange between the gases present in the soil with the gases from the atmosphere is defined as aeration. Porosity is a physical attribute of the soil related to its function as an air conductor, which depends on pore structure and geometric aspects such as size, area, shape, continuity and connectivity (MENTGES
et al., 2016).
Quantitatively, the air occupies the entire portion of porosity not occupied by water. Thus, the amount of air in the soil varies with the change in its water content. In addition, it can also be altered by processes such as compaction (NEIRA et al., 2015), which reduces soil macroporosity and aeration by promoting a reorganization of solid particles in the porous space (GRZESIAK et al., 2013; NAWAZ; BOURRIÉ; TROLARD, 2013; ROMERO
et al., 2014).
Considering that most plants consume the oxygen (O2) present in soil air during for root respiration, the amount of air in the soil should be such that it meets this demand. If the physical condition of the soil restricts the renewal of air, and the O2demand for root respiration is not met, there will be inhibition of oxidative phosphorylation due to the lack of O2to serve as final acceptor of electrons (NEIRA et al., 2015) and, consequently, lower production of energy in the form of ATP (Adenine Triphosphate), triggering a series of events with negative consequences to plant development (TAIZ et al., 2017; TIAN et al., 2019; WANG et al., 2015).
Among these consequences are the lower functionality of the roots for water transport, lower stomatal conductance and net photosynthesis, reduction in chlorophyll content and dry mass accumulation (DALASTRA et al., 2014; GASPAR, 2011; GRZESIAK
et al., 2014). However, it is worth pointing out that the
severity of these effects depends on the acclimatization capacity of plants through metabolic, morphoanatomical and physiological responses (BARBOSA et al., 2014; GRZESIAK et al., 2017).
The water-free porosity value of 10% suggested by Grable and Siemer (1968) has been widely accepted as the minimum necessary to maintain the balance of airflow between soil and atmosphere and meet the O2 demand of the roots. However, little has been discussed and/or experimented on the influence of this fixed value on plant development as a function of the particularities of each type of soil and crops.
In addition, in order to increase aeration porosity, there needs to be a reduction in water content, but this alters other soil physical properties such as mechanical resistance to penetration (GRABLE; SIEMER, 1968),
which may lead to multiple stresses to plants (GRZESIAK
et al., 2016; GUIMARÃES et al., 2013).
In this context, and considering that the functionality of pores in soil air dynamics is not controlled only by the fraction of the water-free pores, but of all geometric aspects associated with its structure, this study started from the following hypotheses: 1) less than 10% aeration porosity may be sufficient to ensure plant development, provided that other porous space attributes remain functional; and 2) the magnitude of this effect is dependent on soil density. Therefore, the objective of this study was to evaluate the physiological and growth responses of maize plants subjected to different aeration porosities at two levels of compaction.
MATERIAL AND METHODS
The study was conducted in a greenhouse located in the experimental area of the Agrometeorological Station at the Federal University of Ceará (UFC), PICI Campus, Fortaleza, CE, Brazil (3°44’45” S, 38°34’56” W), from May to July 2018. The local climate is Aw’, characterized by being tropical rainy according to Köppen’s classification. Inside the greenhouse, a HOBO® U12-012 Temp/RH/ Light/Ext data logger recorded mean values of 30 °C for temperature and 73% for relative air humidity.
The soil used in the experiment was collected in the 0.40-0.90 m layer of an ARGISSOLO AMARELO (Ultisol) (SANTOS et al., 2018), with the following physical and chemical characteristics: sandy clay loam texture (566, 115, 319 g kg-¹ of sand, silt and clay, respectively), pH (H2O) = 5.0; 1.0 mg dm-³ of P; 4.0 g dm-³ of Corg; 0.01, 0.5, 0.4, 0.11, 0.9 and 1.51 cmolc kg-¹ of Na+, Ca²+, Mg²+, K+, Al³+ and H+, respectively; SB of 1.02 cmol
c kg -¹, V% of 29.74 and CEC of 3.43 cmolc kg-¹. The double hybrid of maize BRS 2022 was used as an indicator plant.
The experimental design was completely randomized blocks (CRD) in a factorial scheme (2 x 5), with five replicates. The first factor was represented by the two soil densities (Ds) (1.6 and 1.7 Mg m-³), and the second factor by the five aeration porosities (0.07, 0.08, 0.09, 0.10, 0.12 m3 m-3).
The soil densities were established from preliminary laboratory tests, with the objective of knowing of the density values whose fraction of the porous space would allow to test aeration porosities lower and greater than 10%.
The experimental units were made in soil columns in PVC (Polyvinyl chloride) pipes with external diameter of 0.20 m and soil height of 0.35 m. A porous cotton fabric (Murin) and an anti-aphid screen were fixed with a rubber
tape at the bottom of the pipe. In addition, each column of soil was placed on plastic plates with a layer of crushed stone with maximum diameter of 0.032 m.
The mass of soil required to form the soil columns at each density received a corresponding amount of water, obtained using the regression equation generated by the compaction curve of the Proctor test, as indicated in NBR 7182 (ASSOCIAÇÃO BRASILEIRA DE NORMAS TÉCNICAS, 1986) (Ds = - 159.96u2 + 39.474u - 0.4727; R2: 0.95). A hydraulic press with capacity for up to 15 tons was used to make the columns. A wooden piece with diameter slightly smaller than that of the cylinder was used in the compaction.
Before compaction, for each soil column, the contents of Ca2+ and Mg2+ were elevated to the 3:1 ratio by adding limestone. The soil was moistened and incubated for 40 days for the reaction of limestone (NUNES; SILVA; SILVA, 2016).
For each level of density, five specimens with dimensions of 0.05 x 0.05 m were also made in order to characterize the physical attributes of the soil in each treatment, namely: water retention characteristic curve, porosity, intrinsic soil air permeability, pore continuity, and penetration resistance.
The specimens were slowly saturated by capillarity and then placed on the tension table and subjected to the tensions of 2, 4, 6, 10 kPa. Then, they were taken to Richards’ pressure-plate apparatus for the application of the highest tensions: 33, 100, 300, 700 and 1500 kPa (KLUTE, 1986).
The soil water retention characteristic curves (SWRCC) were constructed with the water contents and tensions applied. The data obtained were fitted according to the model proposed by Van Genuchten (1980), Eq. 1, using the program Table Curve 2D Trial Version, 5.1. Only alpha, m and n parameters were estimated.
θ = θr + θs - θr/[1 +(α│ψ│)n]m (1)
where: θ - water content (m3 m-3); θ
r and θs - residual
volumetric water content (= wilting point) and saturation volumetric water content (= total porosity) (m3 m-3); ψ -soil water matric potential (kPa);a - scaling factor for ψ (m3); m and n - fitting parameters of the model related to curve shape.
The values of volumetric water contents at the wilting point and saturation and the parameters of the van Genuchten equation were: θr = 0.12 m3 m-3; θ
s = 0.34; α = 0.24; m = 0.33 and n = 2.19 for Ds of 1.6 Mg m-3, and θr = 0.13 m3 m-3; θ
s = 0.29 m
3 m-3; α = 0.24; m = 0.16 and n = 3.8 for Ds of 1.7 Mg m-3, respectively.
Total porosity (TP), macropores (Ma) and micropores (Mi) were obtained according to the Donagema et al. (2011). The following values were obtained: TP = 0.34, Ma = 0.07 and Mi = 0.27 m3 m-3 at Ds of 1.6 Mg m-³ and TP = 0.29, Ma = 0.04 and Mi = 0.25 m3 m-3 at Ds of 1.7 Mg m-3, respectively.
Fitted SWRCC were used to obtain the water contents equivalent to each treatment of aeration porosity through the relationship: (Өβ = TP - β, m3 m-3), where Ө
β is the water content corresponding to the level of aeration porosity, TP is total porosity, and β is aeration porosity.
Intrinsic soil air permeability (Kair) was obtained according to the decreasing pressure method (SILVEIRA et al., 2011), after moisture equilibrium at all tensions. The software program Permear v.1.0 developed by Silveira et al. (2011) was used to record the decrease of pressure over time and to obtain the air permeability coefficient (Kair) by means of Eq.2.
Kair = Lnv/APatm ×│S│ (2)
where: Kair - air permeability coefficient (m²); V - volume of air passing through the cylinder (m³); h - dynamic viscosity of air (Pa.s); L - volumetric ring height (m); A - sample area (m2); P
atm - local atmospheric pressure (Pa); S - angular coefficient of the linear regression of pressure
(ln of pressure) as a function of time.
After knowing the relationship between Kair and aeration porosity, the pore continuity index N was obtained as suggested by Kozeny-Carman, which is similar to the methodology presented by Ahuja et al. (1984). The N index was equal to 0.68 and 0.39 μm² for the densities of 1.6 and 1.7 Mg m-3, respectively.
Penetration resistance (PR) was obtained using a benchtop static electronic penetrometer, with a 4 mm diameter rod and speed of 1 cm min-¹. Data were acquired using the software program of the device as described by Tormena, Silva and Libardi (1998).
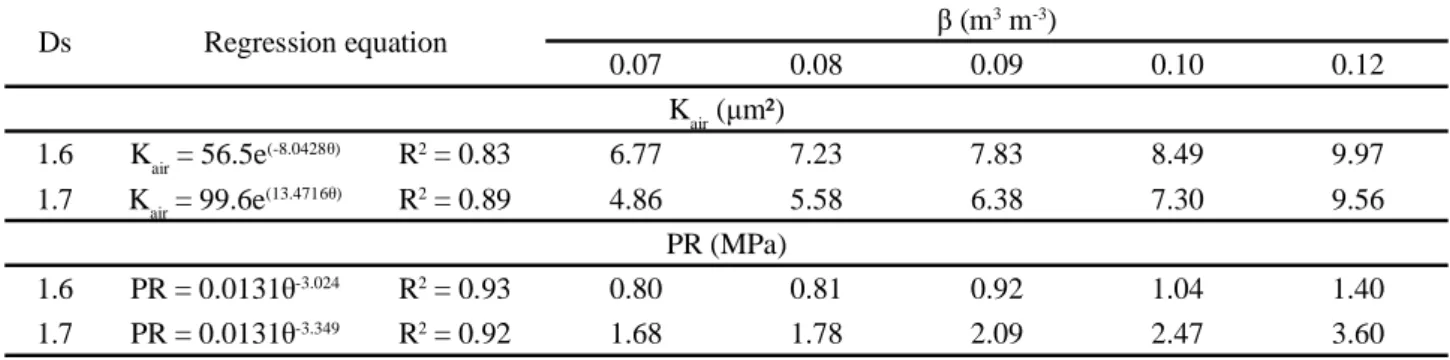
The results of the fitted water contents and the data of Kair and PR at each tension were related, and the regression equations generated were used to estimate the Kair and PR corresponding to each level of aeration porosity (Table 1).
After preparing the columns in the different treatments, sowing was performed using five maize seeds in each soil column. After emergence, thinning was performed every day and, at seven days after emergence (DAE), the most vigorous plant was kept in each column. From this point, water content began to be monitored so that it was in accordance with its respective treatment.
The water content and tension equivalent to each treatment were monitored using tensiometers with
Table 1 - Regression equations between volumetric water content (q) and intrinsic soil air permeability (Kair) and between volumetric water content and penetration resistance (PR). Values of Kair and PR at the different aeration porosities (β) for the soil densities of 1.6 and 1.7 Mg m-3 Ds Regression equation β (m 3 m-3) 0.07 0.08 0.09 0.10 0.12 Kair (μm²) 1.6 Kair = 56.5e(-8.0428θ) R2 = 0.83 6.77 7.23 7.83 8.49 9.97 1.7 Kair = 99.6e(13.4716θ) R2 = 0.89 4.86 5.58 6.38 7.30 9.56 PR (MPa) 1.6 PR = 0.0131θ-3.024 R2 = 0.93 0.80 0.81 0.92 1.04 1.40 1.7 PR = 0.0131θ-3.349 R2 = 0.92 1.68 1.78 2.09 2.47 3.60
mercury reading system, installed at 15 cm deep, in one replicate per treatment. When there was variation in the mercury column, water was added in a quantity that was calculated so that it would return to the desired condition, using Eq.3. Monitoring was performed 11 times a day along the 49 days of the experimental period.
Vwater = (θtreat - θcurrent) * Vcylinder (3)
where: Vwater - volume of water (m³); θtreat - volumetric water content for each treatment (m3 m-3); θcurrent -volumetric water content at the time of reading (m3 m-3); Vcylinder - internal volume of the cylinder (m3).
Fertilization was supplied via nutrient solution to raise nitrogen and phosphorus contents to 30 mg dm-3, with ammonium sulfate and monoammonium phosphate (MAP) as sources. Potassium content was raised to 90 mg dm-3 (KCl), and the contents of the micronutrients zinc, iron, manganese, copper and boron were raised to 1.0, 2.5, 1.5, 1.0 and 0.5 mg dm-3, respectively, with the following sources: zinc sulfate, Rexolin®, manganese sulfate, copper sulfate, and boric acid, respectively.
At 49 days after emergence (DAE), period coincident with the tasseling of maize plants, gas exchanges were measured based on photosynthetic rate (A), leaf transpiration (E), stomatal conductance (gs) and internal CO2 concentration (Ci), using an infrared gas analyzer (IRGA, LICOR, LI-6400XT model, Licor, USA) with artificial radiation source of 1200 μmol m-2 s-1 in the middle third of the third fully expanded leaf of each plant.
In the same leaves used to measure gas exchanges, chlorophyll contents were determined by both the indirect method with a portable meter (SPAD 502, Minolta Co, Ltd, Osaka, Japan), and the direct method, in which leaf discs were collected for the extraction of photosynthetic pigments in dimethyl sulfoxide (DMSO) extractor solution
saturated with calcium carbonate (CaCO3). In the latter, the absorbance of the extracts was measured with a UV/ visible spectrophotometer for chlorophyll a, chlorophyll
b and total chlorophyll, and carotenoids at A 649 and A
665, and A 480, respectively. The concentrations were calculated using the equations described by Wellburn (1994).
Subsequently, the leaves of all plants were detached from the stem and immediately taken to measure the leaf area in an area integrator (Area meter, LI-3100, Li-Cor, Inc. Lincoln, NE, USA).
To determine shoot dry biomass, the fresh matter was weighed, placed in paper bag and dried in a forced air circulation oven (65 ºC) until reaching constant weight.
Shapiro-Wilk test was applied to the obtained data in order to verify the assumption of normality. Analysis of variance was performed and the means for density treatments were compared by Tukey test at 5% probability level. For the levels of aeration porosity, when significant effect was identified, the data were subjected to first- and second-degree regression analysis, and the model with best fit was chosen based on the highest coefficient of determination (R²). The statistical program SISVAR was used for data analysis (FERREIRA, 2014).
RESULTS AND DISCUSSION
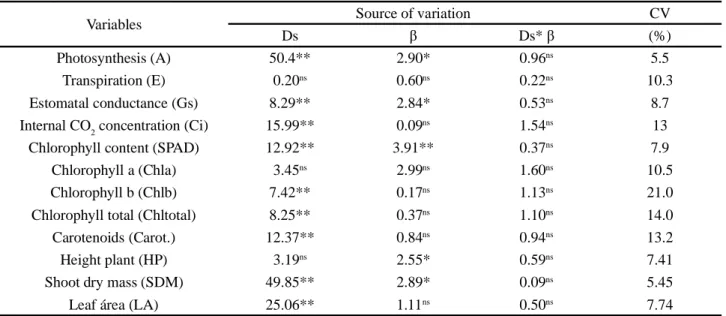
Soil density (Ds) caused a significant single effect on most variables analyzed (Table 2), while aeration porosity (β) caused effects on photosynthesis, stomatal conductance, SPAD index, shoot dry mass (SDM) and plant height. The interaction between the factors did not cause significant effect (Table 2).
The levels of β caused a quadratic effect on photosynthesis, with increments from the aeration porosity
* and ** Significant at 5 and 1% probability levels, respectively;nsnot significant at 5% probability level
Variables Source of variation CV
Ds β Ds* β (%)
Photosynthesis (A) 50.4** 2.90* 0.96ns 5.5
Transpiration (E) 0.20ns 0.60ns 0.22ns 10.3
Estomatal conductance (Gs) 8.29** 2.84* 0.53ns 8.7
Internal CO2 concentration (Ci) 15.99** 0.09ns 1.54ns 13
Chlorophyll content (SPAD) 12.92** 3.91** 0.37ns 7.9
Chlorophyll a (Chla) 3.45ns 2.99ns 1.60ns 10.5
Chlorophyll b (Chlb) 7.42** 0.17ns 1.13ns 21.0
Chlorophyll total (Chltotal) 8.25** 0.37ns 1.10ns 14.0
Carotenoids (Carot.) 12.37** 0.84ns 0.94ns 13.2
Height plant (HP) 3.19ns 2.55* 0.59ns 7.41
Shoot dry mass (SDM) 49.85** 2.89* 0.09ns 5.45
Leaf área (LA) 25.06** 1.11ns 0.50ns 7.74
Table 2 - Summary of the analysis of variance for the effect of different soil densities (Ds) and aeration porosity (β) on the gas exchange
parameters, chlorophyll contents and growth parameters of maize plants
water absorption by the roots and reduced the driving force responsible for stomatal opening (cell turgor). Without the necessary turgor, there are limitations to the influx of CO2 into the substomatal cavities, reduction in the photosynthesis rate and absorption of light energy, which may be accompanied by a reduction in chlorophyll content (DALASTRA et al., 2014, TIAN et al., 2019).
Thus, at the lowest β (0.07 m3 m-3), cell turgor was compromised by the higher moisture, which may have made the amount of O2 in the soil insufficient to maintain aerobic respiration at normal levels and, as a result, less energy to maintain the hydraulic conductance of the roots (GASPAR, 2011; GRZESIAK et al., 2017; NEIRA, 2015). Conversely, at the highest β (0.12 m3 m-3), this was due to the variation of physical attributes that directly affect plant growth as increasing aeration porosity treatments were established such as: reduction in water content and increase in penetration resistance (Table 1) (GRABLE; SIEMER, 1968).
Studies conducted with maize by Grzesiak et al. (2016), in compacted soil under different water contents, and by Tian et al. (2019), testing the effect of periods of hypoxic and anoxic stress, also observed similar behavior for gas exchanges.
From a more holistic evaluation of the results explored so far, it can be noted that the values obtained at porosity aeration of 0.10 m3 m-3, considered as limiting, did not differ significantly from those observed for the range of treatments with lower value, especially for photosynthesis and stomatal conductance. This fact of 0.07 m3 m-3, reaching the maximum value of 30.93 μmol
CO2 m-² s-¹, corresponding to a β of 0.09 m3 m-3, estimated by the mathematical model. The reduction between the maximum value and the value obtained at the aeration porosity of 0.12 m3 m-3 was 7%, which corresponded to the value of 28.80 μmol CO2 m-2 s-1 (Figure 1a). For stomatal conductance, there was also a significant fit of the quadratic model, with the highest stomatal opening (0.19 mol of H2O m-2 s-1) also close to the aeration porosity of 0.09 m3 m-3 (Figure b). Similar behavior was also observed for the SPAD index, which refers to the relative chlorophyll content (Figure 1c), whose lowest mean was observed at the highest aeration porosity (0.12 m3 m-3), with a reduction of 6.4% at aeration porosity 0.07 m3 m-3 compared to the maximum point.
Photosynthetic activity is controlled by factors of biochemical or diffusional nature, the latter being modulated by hydroactive and hydropassive processes responsible for the stomatal movement (opening and closing), and its magnitude is dependent, among other things, on the physical-hydraulic condition of the soil (TAIZ et al., 2017).
Thus, the observed behavior for gas exchange and SPAD index, with a tendency to increase from the aeration porosity of 0.07 m3 m-3 and marked reduction at the highest aeration porosity (0.12 m3 m-3) (Figure 1a,b,c) was due to the diffusional stomatal limitations caused by variations in the physical condition of the soil. This is because, at these levels of porosity, for different reasons, the physical condition of the soil limited the capacity of
suggests that less than 10% of the fraction of soil pores with air can still maintain the requirements of plant roots for aeration; this is because functional aspects of pores, such as their continuity and permeability, also define the quality of a soil as an air conductor (MENTGES et al., 2016).
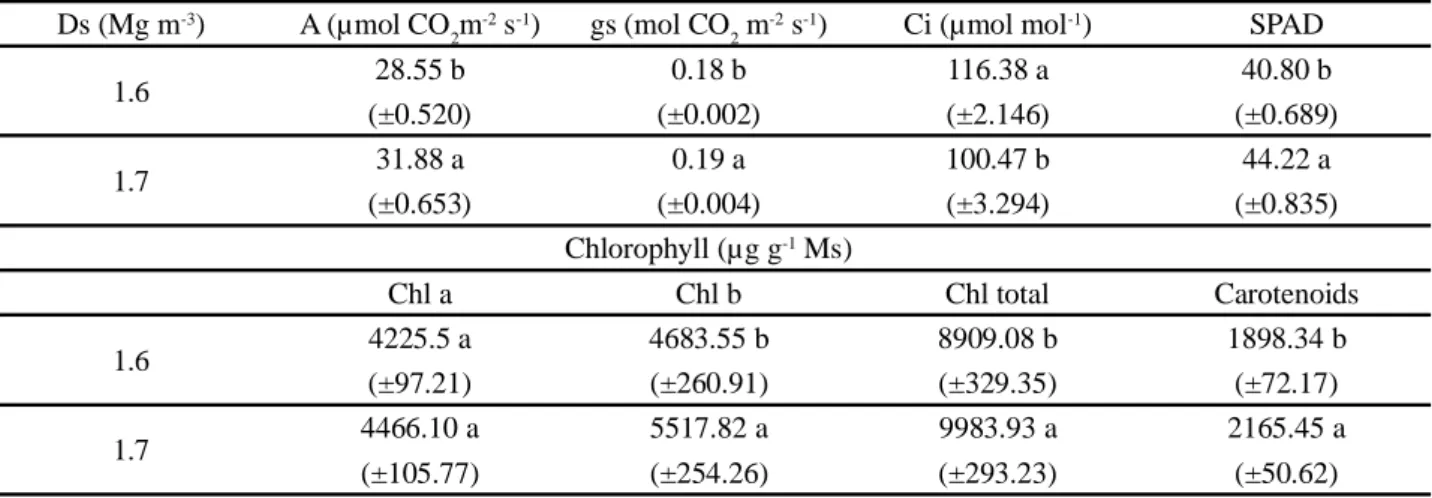
Regarding the effects of density (Table 3), the highest value (1.7 Mg m-³) led to the highest mean of photosynthetic rate. Such increase in photosynthesis was accompanied by greater stomatal opening and
lower internal CO2 concentration in the substomatal chamber (Ci) (Table 3). This indicates that carbon was captured by PEP-carboxylase (Phosphoenolpyruvate carboxylase), underwent the catalysis of carboxylation reactions, followed biochemical pathways and was used by the carboxylation enzyme RuBisCO (Ribulose-1,5-bisphosphate carboxylase/oxygenase) in bundle sheath cells (SILVA et al., 2015).
These results with apparent nonsense can be understood as survival strategies. That is, plants grown at the density of 1.7 Mg m-3 experienced a more restrictive physical condition to their growth and, therefore, made use of metabolic strategies, for example, the change in the pattern of photoassimilates transport, stimulating photosynthesis (TAIZ et al., 2017). Tubeileh et al. (2003), studying the effect of two densities (1.45 and 1.30 Mg m-3) on photosynthesis in maize plants, observed similar results.
At the density of 1.7 Mg m-3, it is also possible to observe higher average for the SPAD index (Table 3), which may be associated with an increase in photosynthesis rate, and also related to the protective function of plants under stress condition (GRZESIAK
et al., 2016).
Regarding the photosynthetic pigments, it is observed that the contents of chlorophyll b, total chlorophyll and carotenoids had the highest means at the density of 1.7 Mg m-³ (Table 3), with increments of 18, 12 and 14%, respectively, compared to the density of 1.6 Mg m-3.
Photosynthetic pigments have control over the amount of radiation absorbed and, therefore, exert positive influence on photosynthetic rate. Chlorophyll
a is considered the most responsible for performing
photosynthesis (TAIZ et al., 2017; ZHANG et al., 2016), which is essential for maintaining the acyclic transport of electrons in the photochemical phase of photosynthesis, while chlorophyll b and carotenoids are considered accessory pigments that aid in the capture of light energy and in the mechanism of non-enzymatic defense that neutralizes the toxic action caused by reactive oxygen species (ROS), common in environments under stress (BARBOSA et al., 2014) . Thus, it is possible to reaffirm that plants grown at the density of 1.7 Mg m-3 sought acclimatization strategies to maintain their development.
The levels of aeration porosity caused quadratic effect on plant height and shoot dry mass (Figure 2 a,b), with maximum estimated values of 235 cm and 0.92 kg, respectively, corresponding to the aeration porosity 0.089 m3 m-3. The mean values of plant height and dry mass showed the same trend observed for physiological data
Figure 1 - Effect of different aeration porosities on net
photosynthesis: A (a); stomatal conductance: gs (b); and SPAD index (c) in maize plants. Bars represent the standard error of the mean. ** and * in regression equations indicate significance at 1 and 5% probability levels
Values followed by the same letter in the column do not differ statistically by Tukey test at 5% probability level Ds (Mg m-3) A (µmol CO
2m
-2 s-1) gs (mol CO 2 m
-2 s-1) Ci (µmol mol-1) SPAD
1.6 28.55 b 0.18 b 116.38 a 40.80 b (±0.520) (±0.002) (±2.146) (±0.689) 1.7 31.88 a 0.19 a 100.47 b 44.22 a (±0.653) (±0.004) (±3.294) (±0.835) Chlorophyll (µg g-1 Ms) Chl a Chl b Chl total Carotenoids 1.6 4225.5 a 4683.55 b 8909.08 b 1898.34 b (±97.21) (±260.91) (±329.35) (±72.17) 1.7 4466.10 a 5517.82 a 9983.93 a 2165.45 a (±105.77) (±254.26) (±293.23) (±50.62)
Table 3 - Comparison of means, with standard errors of the mean, for the single effect of soil density (Ds) on photosynthesis (A),
transpiration (E), stomatal conductance (gs), internal CO2 concentration (Ci), SPAD and contents of chlorophyll a, chlorophyll b and total chlorophyll (Chla, Chlb, Chltotal) and carotenoid
Figure 2 - Plant height at 49 days after emergence (a)
and shoot dry mass (b) as a function of different aeration porosities. Bars represent the standard errors of the means. (*) significant at 5% probability level
(Figure 1 a,b,c), with greater reduction at the aeration porosity of 0.12 m3 m-3, and similar values for the range between 0.07 and 0.10 m3 m-3, i.e., the growth in height and biomass production as a function of the levels of aeration
porosity followed the same behavior of photosynthesis (Figure 1a), a process responsible for producing the energy needed for growth. In addition, with the physical modifications of the soil to maintain the greater aeration porosity, plants may have allocated reserves preferably to the roots in an attempt to maintain water absorption, and with this the functional balance of growth (TAIZ et al., 2017).
In plants subjected to different aeration porosities at the densities of 1.6 and 1.7 Mg m-3 the latter caused lower leaf expansion and hence smaller leaf area (Table 4). As density increases, there is greater cohesion between the solid particles of the soil and greater adhesion of water in the mass of solids (ROMERO et al., 2014), which alters the interactions of plant roots with the solid, liquid and gaseous phases of the soil (WANG et al., 2015), leading to a reduction in leaf area. Guimarães et al. (2013), evaluating millet plants subjected to different soil densities, the maximum being 1.74 Mg m-3, stated that leaf area decreased with the increase in soil density, and the authors attributed it to lower water absorption and reduction of the aeration process.
For SDM (Table 4), lower value was also observed at Ds of 1.7 Mg m-³ (Table 4). At this density, throughout the experimental period, at all levels of aeration porosity, the physical condition was more restrictive to maintain the processes that precede growth (cell turgor and expansion), as indicated by the higher resistance of the soil to root penetration (Table 1) and greater microporosity (0.27 m3 m-3).
Thus, the higher mechanical impedance made it difficult for roots to explore along the soil column, thus
Values followed by equal letters in the column do not differ statistically by Tukey test at 5% probability level
Ds (Mg m-3) LA (m2) SDM (kg)
1.6 0.71 a (±0.008) 0.95 a (±0.0001)
1.7 0.64 b (±0.013) 0.85 b (±0.001)
Table 4 - Comparison of means, with standard errors of the mean, for the single effect of soil density (Ds) on the leaf area (LA) and
total shoot dry mass (SDM) of maize plants
the scholarship during the study period and financial support through the Pro-integração project (No. 55/2013).
REFERENCES
AHUJA, L. R. et al. Macroporosity to characterize spatial variability of hydraulic conductivity and effects of land management. Soil Science Society of American Journal, v. 48, n. 4, p. 699-702, 1984.
ASSOCIAÇÃO BRASILEIRA DE NORMAS TÉCNICAS.
ABNT NBR 7182: ensaio de compactação-. Rio de Janeiro:
Sistema Nacional de Metrologia, Normalização e Qualidade Industrial, 1986.10 p.
BARBOSA, M. R. et al. Plant generation and enzymatic detoxification of reactive oxygen species. Ciência Rural, v. 44, n. 3, p. 453-46, 2014.
DALASTRA, G. M. et al. Trocas gasosas e produtividade de três cultivares de meloeiro conduzidas com um e dois frutos por planta. Bragantia, v. 73, n. 4, p. 365-371, 2014.
DONAGEMA, G. K. et al. Manual de métodos de análise de
solo. 2. ed. rev. ampl. Rio de Janeiro: Embrapa Solos, 2011,
225 p.
FERREIRA, D. F. Sisvar: a guide for its bootstrap procedures in multiple comparisons. Ciência e Agrotecnologia, v. 38, n. 2, p. 109-112, 2014.
GASPAR, M. Aquaporinas: de canais de água a transportadores multifuncionais em plantas. Revista Brasileira de Botânica, v. 34, n. 4, p. 481-491, 2011.
GRABLE, A. R.; SIEMER, E. G. Effects of bulk density, aggregate size, and soil water suction on oxygen diffusion, redox potential and elongation of corn roots. Soil Science of America
Journal, v. 32, p. 180-186, 1968.
GRZESIAK. S. et al. Changes in root system structure, leaf water potential and gas exchange of maize and triticale seedlings affected by soil compaction. Environmental and
Experimental Botany, v. 88, p. 2-10, April, 2013.
GRZESIAK, M. T. et al. Impact of soil compaction stress combined with drought or waterlogging on physiological and biochemical markers in two maize hybrids. Acta Physiol Plant, v. 38, n. 109, p. 1-15, 2016.
compromising the maintenance of cell turgor. It is worth pointing out that, as much as soil water conditions were not considered restrictive for the water supply to plants, once subjected to compaction, biochemical signals produced in the roots can compromise the transport of water and photoassimilates to the aerial parts and may result in lower biomass production (GRZESIAK et al., 2013; NAWAZ; BOURRIÉ; TROLARD, 2013). Grzesiak et al. (2014), combining multiple stresses (compaction and conditions of drought and flooding) on maize and triticale plants, observed that regardless of the soil moisture condition, the reduction of shoot dry biomass was more substantial in the soil with the increase of compaction.
The results observed in the present study clearly demonstrate the importance that the inferences on plant responses to the physical conditions of the soil, especially when they are made by establishing fixed values of a certain soil physical attribute, as is the case of the value of 10% aeration porosity, should consider all the dynamics existing in the soil-plant system.
CONCLUSIONS
1. For the variables analyzed, especially for gas exchanges and SPAD index, aeration porosity levels below 10% did not cause significant reduction, while values above it, despite enabling a more favorable condition for the airflow in the soil, modified with greater amplitude other attributes that directly affect plant growth, which generally caused a more negative effect on plants; 2. The increase in soil density level resulted in an increment
in gas exchanges and relative chlorophyll index and in the contents of photosynthetic pigments, but this did not promote increases in leaf area, biomass and growth in height.
ACKNOWLEDGMENTS
To the Coordination for the Improvement of Higher Education Personnel (CAPES), for granting
GRZESIAK, M. T. et al. Interspecific differences in root architecture among maize and triticale genotypes grown under drought, waterlogging and soil compaction. Acta Physiol Plant, v. 36, p. 3249-3261, 2014.
GRZESIAK, M. T. et al. Physiological markers of stress susceptibility in maize and triticale under different soil compactions and/or soil water contents. Journal of Plant
Interactions, v. 12, n. 1, p. 355-372, 2017.
GUIMARÃES, C. V. et al. Desempenho de cultivares e híbridos de milheto em solo submetido a compactação. Revista Brasileira
de Engenharia Agrícola e Ambiental, v. 17, n. 1, p. 1188-1194,
2013.
KLUTE, A. Water retention: laboratory methods. In: KLUTE, A. (ed.) Methods of soil analysis. 2. ed. Madison: American Society of Agronomy: Soil Science Society of America, 1986. p. 635-662.
MENTGES, M. I. et al. Capacity and intensity soil aeration properties affected by granulometry, moisture, and structure in no-tillage soils. Geoderma, v. 263, p. 47-59, 2016.
NAWAZ, M. F.; BOURRIÉ, G.; TROLARD, F. Soil compaction impact and modelling: a review. Agronomy for Sustainable
Development, v. 33, n. 2, p. 291-309, 2013.
NEIRA, J. et al. Oxygen diffusion in soils: understanding the factors and processes needed for modeling. Chilean Journal of
Agricultural Research, v. 75, p. 35-42, 2015.
NUNES, J. A; SILVA E. M. B; SILVA, T. J. A. Bulk density and water tensions in the soil on corn root production. Revista
Brasileira de Engenharia Agrícola e Ambiental, v. 20, p.
357-363, 2016.
ROMERO, E. M. et al. Condutividade hidráulica, porosidade, resistência mecânica e intervalo hídrico ótimo em Latossolos artificialmente compactados. Revista Brasileira de Engenharia
Agrícola e Ambiental, v. 18, n. 10, p. 1003-1009, 2014.
SANTOS, H. G. et al. Sistema brasileiro de classificação de
solos. 5. ed. Brasília: Embrapa Solos, 2018. 590 p.
SILVA. F. G. et al. Trocas gasosas e fluorescência da clorofila em plantas de berinjela sob lâminas de irrigação. Revista Brasileira
de Engenharia Agrícola e Ambiental, v. 19, n. 10, p. 946-952,
2015.
SILVEIRA, L. R. et al. Sistema de aquisição de dados para equipamento de medida da permeabilidade intrínseca do solo ao ar. Revista Brasileira de Ciência do Solo, v. 35, p. 429-436, 2011.
TAIZ, L. et al. Fisiologia vegetal e desenvolvimento vegetal. 6. ed. Porto Alegre: Artmed, 2017.
TIAN, L. et al. Effects of waterlogging stress at different growth stages on the photosynthetic characteristics and grain yield of spring maize (Zea mays L.) under field conditions. Agricultural
Water Management, v. 218, p. 250-258, 2019.
TORMENA, C. A.; SILVA, A. P.; LIBARDI, P. L. Caracterização do intervalo hídrico ótimo de um Latossolo roxo sob plantio direto. Revista Brasileira de Ciência do Solo, v. 22, p. 573-581, 1998.
TUBEILEH, A. et al. Effect of soil compaction on photosynthesis and carbon partitioning within a maize–soil system. Soil
&Tillage Research, v. 71, p. 151-161, 2003.
VAN GENUCHTEN, M. T. A closed-form equation for predicting the conductivity of unsaturated soils. Soil Science Society of
America Journal, v. 44, p. 892-897, 1980.
WANG, E. et al. Quantifying soil physical condition based on soil solid, liquid and gaseous phases. Soil & Tillage Research, v. 146, p. 4-9, 2015.
WELLBURN, A. R. The spectral determination of chlorophylls a and b, as well as total carotenoids, using various solvents with spectrophotometers of different resolution. Journal of Plant
Physiology, v. 144, p. 307-314, 1994.
ZHANG, J. et al. Photosynthetic performance of soybean plants to water deficit under high and low light intensity. South African
Journal of Botany, v. 105, p. 279-287, 2016.