www.scielo.br/rbg
EVAPORITIC VELOCITY MODELING UNCERTAINTIES AND VARIABILITIES:
IMPLICATIONS FOR PRE-SALT PROJECTS IN THE SANTOS BASIN, BRAZIL
Alexandre Rodrigo Maul
1,2, Marco Antonio Cetale Santos
2, Cleverson Guizan Silva
2,
María de Los Ángeles González Farias
3, Josué Sá da Fonseca
1,
Filipe Augusto de Souto Borges
1and Carlos Eduardo Borges de Salles Abreu
1ABSTRACT.Correct representation of the spatial distribution of physical and chemical properties of the evaporitic section is of great importance for development of pre-salt section reservoirs. In the offshore Santos Basin, SE Brazil, an increasing amount of high quality seismic, well-logs, and production data are available. The initial conceptual model of the evaporitic section, assuming inhomogeneous behaviors in terms of mineral composition, acoustic and elastic properties, had not been well documented yet. Therefore, this interval remains considered as mainly composed by halite, being slightly modified to include a few heterogeneities when needed. A simple way to represent those heterogeneities is by combining seismic attributes and well-log information, which are usually not available for the whole evaporitic section. To mitigate this problem, drill cuttings description can be used. In this paper, we describe some of the uncertainties related to the analysis of 1D information from wells, as well as a possible alternative to represent the data variability where information is missing. The proposed methodology includes generating a detailed evaporitic section model (3D), including properties and their related uncertainties. This model can be used to improve seismic imaging, depth positioning forecast and reservoir property values distribution.
Keywords: evaporitic section, data analysis, heterogeneities, property value, uncertainties.
RESUMO.Representar corretamente a distribuição espacial das propriedades físicas e químicas da seção evaporítica é muito importante no desenvolvimento dos reservatórios do pré-sal. Na Bacia offshore de Santos, região SE do Brasil, grande quantidade de dados sísmicos de alta qualidade, perfis de poço, dados de produção estão disponíveis. O modelo conceitual desta seção, assumindo o mesmo como não homogêneo, em termos de mineralogia e propriedades acústicas e elásticas, ainda não é bem documentado. Assim, este intervalo permanece sendo considerado como, principalmente, composto por halita e, localmente, modificado para incluir algumas heterogeneidades, quando necessário. Um caminho simples para representar estas heterogeneidades é combinar atributos sísmicos e informações dos perfis de poços que, usualmente, não estão disponíveis para toda a seção. Para mitigar este problema, descrição de amostras de calhas pode ser utilizada. Neste artigo, nós descreveremos algumas das incertezas relacionadas a esta análise 1D, oriundas das informações dos poços, assim como uma possível alternativa para representar as variabilidades destes dados inexistentes. A metodologia proposta inclui a geração de um modelo (3D) detalhado da seção evaporítica, incluindo suas propriedades e as incertezas relacionadas. Este modelo pode ser utilizado para melhorar as imagens sísmicas, com previsões de profundidade mais acuradas, e a distribuição de valores de propriedades de reservatórios.
Palavras-chave: seção evaporítica, análise de dados, heterogeneidades, valores de propriedades, incertezas.
1Petrobras - Reservoir Geophysics, Av. República do Chile, 330, 9º andar, 20031-170 Rio de Janeiro, RJ, Brazil – E-mails: alexandre.maul@petrobras.com.br, josuefonseca@petrobras.com.br, filipeborges@petrobras.com.br, ceduardoabreu@petrobras.com.br
2Universidade Federal Fluminense – UFF, Geology and Geophysics, Av. Milton Tavares de Souza, s/nº - Gragoatá, 24210-340 Niterói, RJ, Brazil – E-mails: marcocetale@id.uff.br, cguizan@id.uff.br
176
EVAPORITIC VELOCITY UNCERTAINTY AND VARIABILITYINTRODUCTION
Successful implementation of pre-salt projects in Brazilian ultra-deep waters, where huge capital investments are required, is highly dependent on the robustness and confidence of the available reservoir models. The first discovery of these large hydrocarbon reserves along the southeastern coast of Brazil happened in 2006, and represented a new chapter in global petroleum history. Since then, Petrobras has been facing major multidisciplinary technological challenges, sponsoring massive investments in research and development, working in collaboration with partners, suppliers, universities, and research centers, to economically explore these reserves in a sustainable way.
The construction of reliable velocity models, according to the known geology, enables the generation of seismic images that better represent the subsurface, both in terms of structural positioning and accurate seismic response. Jones & Davison (2014) report the challenge of seismic imaging close to (or inside) salt bodies, due to the high velocity contrasts observed in those areas. Operational safety and drilling hazards are other issues widely discussed in the literature of field development when salt bodies are present.
Most halokinetic models used to reconstruct the basin’s structural styles consider the salt section as almost homogeneous, with predominance of halite (Demercian et al., 1993; Ings et al., 2004; Guerra & Szatmari, 2009; Guerra & Underhill, 2012). The concept of salt flooding is a common approach in seismic processing, and involves the assignment of a constant velocity to the evaporitic section prior to the tomographic inversion process to update it (Guo & Fagin, 2002; Zdraveva et al., 2011). Ji et al. (2011) defend the idea that heterogeneous salt velocity models improve the seismic imaging. Cornelius & Castagna (2018), using well-logs and drill cuttings, confirm that velocity variations exist, and that they must be incorporated into the models. The same concept for the evaporitic section has been widely mentioned in several salt stratifications studies (Maul et al., 2015; Amaral et al., 2015; Meneguim et al., 2015; Maul et al., 2018b, 2019; Teixeira & Lupinacci, 2019).
Regarding these heterogeneities, Schreiber et al. (2007) emphasize that evaporites precipitate due to brine evaporation, forming layers according to their solubility rates, with varying mineral compositions. These authors also mention that comprehension of the water supply to the brines, which breaks the expected salt precipitation order, represents the main difficulty when modeling this sort of mineral deposit. The mobility of
most evaporites also imposes difficulties to quantify the original mineral occurrence from present day information, either using wells or outcrop descriptions. Based on well data, Freitas (2006) identified more than a dozen evaporitic cycles in the Santos Basin, whereas Gamboa et al. (2009) mentioned the presence of 3 or 4 major evaporitic cycles when inspecting seismic data response.
The enigmatic structures presented in Jackson et al. (2015), which are nothing more than observations of folded strata within the evaporitic section, are clear evidences of a heterogeneous behavior. Costa & Poiate Jr (2009), inspecting outcrops and salt mines, confirmed that there are many different minerals inside the evaporitic sections: halite, anhydrite, gypsum, carnallite, tachyhydrite, and sylvite, just to name a few. Aiming at preventing drilling hazards, these authors recommended a detailed identification of the sequence, their mineral compositions, and their behavior under drilling. It is therefore reasonable to assume that the evaporitic section must be considered as heterogeneous instead of being represented by the halite behavior only.
Based on well information, the studies compilation presented by Maul et al. (2018b) proposed clustering the evaporitic minerals into three main groups, observing their compressional velocity. These groups are: (i) the Low Velocity Salts/Evaporites group (LVS), mainly composed by carnallite, tachyhydrite, sylvite and other mobile salts; which present compressional velocities lower than the represented by the halite mineral (4,500 m/s); (ii) the Halite group, usually abundant and considered as the background group; represented by the compressional velocity of about 4,500 m/s; and (iii) the High Velocity Salts/Evaporites group (HVS), basically composed by anhydrite and gypsum, having compressional velocities higher than 4,500 m/s. Intrusive rocks, when found, due to the same velocity behavior as HVS minerals, were also considered inside this group – an approach that has been adopted in many case studies (Meneguim et al., 2015; González et al., 2016; Gobatto et al., 2016; Falcão et al., 2016; Barros et al., 2017; Fonseca et al., 2017, 2018; Teixeira et al., 2018; Maul et al., 2018a,b, 2019; Dias et al., 2019). Fonseca et al. (2017) also observed carbonate and siliciclastic occurrences within the salt section, and suggested to group them within the Halite group, as their velocity behaviors are more similar to this background’s group. These rocks, however, lack representativeness.
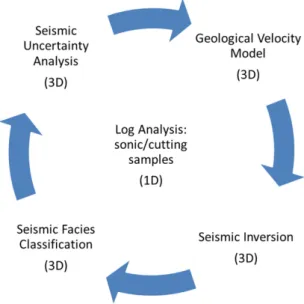
The workflow proposed by Maul et al. (2016) and presented in González et al. (2016) uses drill cuttings descriptions to fill in gaps observed in the well-logs in the evaporitic section, and
also to constrain the salt velocity modeling, as shown in Figure 1. Even in regions where well data are available, well-logs within the salt section are almost always incomplete, since evaporites are not the main target, and acquiring data in these sections is operationally challenging. To overcome this problem, Amaral et al. (2015) proposed to complete the well information with the described lithology from drill cuttings, a methodology that has been widely reproduced since then (Gobatto et al., 2016; Barros et al., 2017; González et al., 2018; Cornelius & Castagna, 2018; Fonseca et al., 2018; Teixeira et al., 2018; Maul et al., 2018a,b, 2019; Dias et al., 2019).
Figure 1 – Proposed workflow to generate a more realistic geological seismic
velocity model (adapted from Maul et al., 2016 in González et al., 2016).
This methodology, albeit effective, should be considered as a semi-quantitative approach, mainly due to inexact sample positioning, potential rock collapse during drilling, and inaccuracies in sample descriptions. These factors impose ambiguities in the estimations of rock properties. The distinction between lack of data, inaccuracy in their measurements, uncertainty associated with interpretation, and data variability are in complete agreement with the classic article presented by Begg et al. (2014).
Maul et al. (2018b) demonstrated the wide applications of a reliable geological evaporitic section model, when simultaneously combining seismic attributes and well-logs, such as better seismic imaging, uncertainty analysis, seismic illumination for acquisition design, etc. The authors demonstrated, using several projects, that stratifications insertion inside the evaporitic section is a key aspect to consider for any
seismic purpose. Gobatto et al. (2016), Falcão (2017), Fonseca et al. (2018), Maul et al. (2018a), Dias et al. (2019) and Maul et al. (2019) compared the results obtained by using the proposed methodology for evaporitic velocity model building, in opposed to the ones from conventional velocity models, confirming the benefits of the stratification insertion for seismic imaging in several development and production pre-salt projects.
STUDY AREA AND AVAILABLE DATA
The study area is inserted in the pre-salt province in the Santos and Campos Basins (Fig. 2). A pre-stack depth-migrated (PSDM) volume covering an area of approximately 200 km2is available,
together with 14 wells with a broad suite of logs. The Agência Nacional do Petróleo, Gás Natural e Biocombustíveis (ANP) has provided the data we used in this research. In this study, the wells were labeled with capital letters from A to N, and the official names can be found in Table 1. Maul et al. (2018a,c) showed, using almost 182 wells through 9 projects/fields in the Santos Basin, that the evaporitic section of these studied fields has many features in common, such as mineral percentages, mineral percentages x thickness, velocity ranges per mineral groups, etc.
Table 1 – Correspondence between the well designation used in this study and
the official names from ANP.
This Study ANP
A 3-BRSA-788-SPS B 9-BRSA-1037-SPS C 8-SPH-23-SPS D 8-SPH-13-SPS E 7-SPH-14D-SPS F 7-SPH-8-SPS G 7-SPH-4D-SPS H 9-BRSA-928-SPS I 7-SPH-5-SPS J 9-BRSA-1043-SPS K 1-BRSA-594-SPS L 7-SPH-1-SPS M 7-SPH-2D-SPS N 3-BRSA-923A-SPS
178
EVAPORITIC VELOCITY UNCERTAINTY AND VARIABILITYFigure 2 – Location of study area (regional) and details of the available data. Blue shading is the area with hydrocarbon occurrences in the pre-salt
province in the Santos and Campos Basins, totaling an area of approximately 350,000 km2. Water column ranges 2,000 to 3,000 m. Adapted from: https://diariodopresal.files.wordpress.com/2010.
PROPOSED METHODOLOGY
The main goals of this work are twofold: (1) identifying and characterizing the inherent uncertainties when dealing with the evaporitic section; and (2) assessing the property values from acquired logs, in order to build a 3D velocity model for the evaporitic interval.
Drill cuttings and well-logs were used to classify the entire evaporitic section into the three proposed groups: LVS, Halite and HVS. Almost every well which cross the evaporitic section presents a lack in the log-data. Each percentage per well is shown in Table 2.
Instead of using a simple standard velocity values, such as the halite velocity where the data were not acquired, the missing information (the rock/mineral/group) was stablished using the described lithologies from drilling cuttings, and a single velocity was imposed for each salt group, obtained from the variability/dispersion for each class and the velocity x salt thickness correlation. Therefore, the calculated velocity considering all of these assumptions seems to be more reliable.
RESULTS, ANALYSIS AND DISCUSSIONS
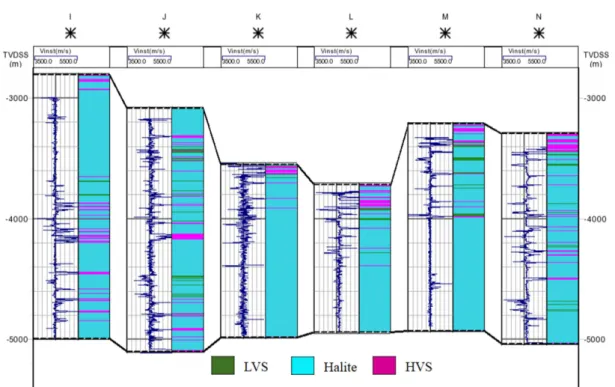
After combining well-logs and drill cuttings, we obtain a complete lithology log for the evaporitic section, for all 14 wells (Fig. 3, for wells I to N). Figure 4 and Table 3 show the percentage distribution for each mineral.
Table 2 – Percentage of registered log in the evaporitic section per well (14).
Only a single well (K) has the entire evaporitic section logged.
WELL NAME REGISTEREDLOG (%) MISSINGLOG (%)
A 91.90 8.10 B 87.60 12.40 C 91.10 8.90 D 87.30 12.70 E 77.90 22.10 F 87.20 12.80 G 92.00 8.00 H 91.80 8.20 I 91.40 8.60 J 96.00 4.00 K 100.00 0.00 L 95.60 4.40 M 94.30 5.70 N 94.00 6.00 AVG 91.30 8.70 AVG = Average
Figure 3 – A piece of a “N-S” stratigraphic cross-section crossing wells from I to N, showing sonic logs (blue lines – left tracks) and lithology group interpretation
(right tracks) for the evaporitic section.
Table 3 – Fraction of mineral groups in the evaporitic section, considering registered logs and gap-filling from drill cuttings. WELL NAME LVS LOG LITHOTYPE (%) HALITE LOG LITHOTYPE (%) HVS LOG LITHOTYPE (%)
A 5.45 86.20 8.35 B 0.50 98.90 0.60 C 6.90 82.70 10.40 D 0.00 91.60 8.40 E 0.30 95.40 4.30 F 1.45 95.40 3.15 G 4.80 92.90 2.30 H 1.20 98.10 0.70 I 1.10 88.80 10.10 J 5.10 83.80 11.10 K 2.12 93.10 4.78 L 3.60 87.20 9.20 M 4.10 89.80 6.10 N 4.60 83.20 12.20 AVG 2.94 90.51 6.55 AVG = Average
180
EVAPORITIC VELOCITY UNCERTAINTY AND VARIABILITYFigure 4 – Fraction of mineral groups
in the evaporitic section, considering registered logs and gap-filling from drill cuttings, considering the mineral grouping suggested by Maul et al. (2018b): LVS, Halite and HVS.
Figure 5 – Distribution of group mineral occurrences for all
wells. 5A: Registered sonic logs only. 5B: After gap-filling with drill cuttings.
As expected, Halite is the dominant group in the evaporitic section, averaging over 90%, whereas HVS and LVS are much less frequent, with a higher content of HVS, as already described in literature (e.g., Jackson et al., 2015). We highlight that the HVS group percentage increases almost 50% when considering the gap-filled lithology (Fig. 5). This is the effect of a sampling bias: for safety reasons, changing of drill stages is preceded by placement of a casing shoe. This is commonly done on top and base of the evaporitic section, and blocks proper well-logging. As the top and base of the evaporitic section are classically characterized by anhydrite, this operational constraint leads to under sampling of anhydrite in the entire evaporitic layer.
Velocity distribution for each evaporitic group was also investigated. Figure 6A illustrates the distribution of velocity values for well L, which is the well in our sample that crosses the thinnest evaporitic section (1,280 m). Figure 6B shows the same, but for well B, which crossed the thickest evaporitic section (2,370 m) containing the three classes of salt grouping (LVS, Halite and HVS – the well D, which would be thickest well in this project, has no the LVS occurrence). Notice that well L presents a small dispersion of values, and Halite can be easily separated
from the LVS group. Well B shows a wider range of velocities for halite, which overlaps with the LVS group, rising ambiguous interpretations. The HVS group in well B has a significantly lower interval velocity, also overlapping with halite. Justen et al. (2013) mentioned that thicker evaporitic sections might have resulted from salt mobilization, which promotes mineral mixing. This is particularly stronger for the LVS.
Analysis of all wells together (Fig. 6C) shows a strong velocity overlap for all groups. This is why sometimes a single value is used to represent the whole section - which is clear inaccurate, as it does not capture heterogeneities.
Velocity variability with thickness is usually low for LVS and Halite groups, and higher for HVS (Fig. 7). This is in accordance with the statement presented by Maul et al. (2019). To better understand this variability, the wells are sorted from thinner (left) to thicker (right) evaporitic section. The anhydrite in the HVS group shows a more brittle behavior than Halite and LVS. Therefore, it is reasonable to infer that brittle high velocity evaporites, which are less mobile, better support the compaction effect in the same location, leading to an increase in velocity. The other groups are ductile/plastic and mobile, and
Figure 6 – Standard statistical box-plot representation of interval velocity variability, obtained from available sonic logs. 6A: Well L, where the evaporitic section
thickness is around 1,280 m. 6B: Well B, where the evaporitic section thickness is over 2,370 m. 6C: All 14 wells, with an average evaporitic thickness of 1,900 m. Blue lines are the compressional velocity of reference (4,500 m/s), commonly used in the “salt flooding” for seismic migration purposes. White dots within the box-plots are the average value for the mineral group, and black lines are the median. Black bars spam ± one standard deviation.
probably move under lithostatic pressure, suggesting that the compaction effect is weaker. The weight of the overburden (water + sediments above evaporites + evaporites) above the “salt” base was also considered but, due to its small variation (from 4,950m to 5,130m), it was assumed as negligible.
In order to avoid spurious values from well-log measurement, the lower and higher 5% values were excluded from the analysis. See Figure 7a, for example: a measurement in well C has Vp over 6,000 m/s, which would correspond to HVS and not to LVS values. The LVS velocity without those anomalous values is almost constant, even considering the evaporitic section thickness variation. This reinforces the hypothesis that this group does not suffer the compaction effect, as observed by the linear regression (thin green line). The Halite group (Fig. 7b) has the same behavior. On the other hand, HVS (Fig. 7c) shows greater variability, and an inverse correlation with evaporitic thickness. An explanation for this inverse correlation would be the compaction effect on anhydrites.
The compaction effects seem to be negligible for LVS and Halite, though noticeable for HVS. Our decision for this work was to consider the average values for gap-filling in each group. This is to be decided on a case-by-case basis, after investigation of a large number of wells and grouping them in representative classes, such as section thickness and burial depth. As shown in Table 2, about 8.70% of the well-logs are missing. Representing these missing values as constant artificially reduces the variability of our dataset, as we are replacing several values by a single one. The next step is to estimate the velocity variations inside the evaporitic section. Lithology identification by itself is not enough; we need to populate a 3D model, segregated by facies, with the appropriate values. This is done with help of acoustic inversion. Discussions about the most suitable type of inversion for the evaporitic section are not the objective of this article, and the reader may refer to Barros et al. (2017), Fonseca et al. (2018), Teixeira et al. (2018) and Maul et al. (2018b) for further details on this particular subject.
182
EVAPORITIC VELOCITY UNCERTAINTY AND VARIABILITYFigure 7 – Sonic velocity, ordered by crescent salt thickness, 7a is LVS, 7b
is Halite, and 7c is HVS). Central curves indicate average values, over which is plotted a trend line. Outliers L5% and U5% were excluded from calculation. Average Vp is 4,176 m/s for LVS, 4,530 m/s for Halite, and 5,258 m/s for HVS. Notice low Vp variability for LVS and Halite, and an inverse relation of HVS Vp versus the section thickness.
The resulting acoustic impedance (Ip) from the acoustic
inversion process is cross-plotted with the compressional wave velocity (Vp) and, from this cross-plot, a best-fit curve is
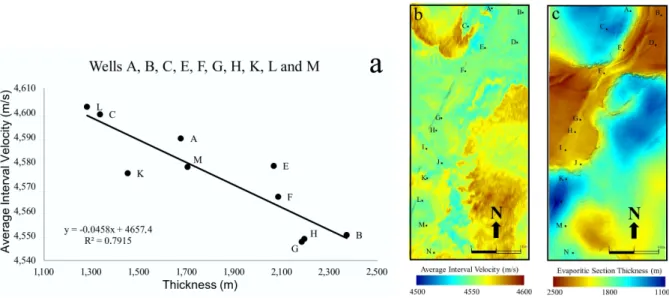
calculated (Eq. 1). The resulting curve fit is applied to the whole 3D volume, generating a 3D velocity volume (Fig. 8). Curve-fitting choice is of course also another source of uncertainties. Vp= ax3+ bx2+ cx + d (1) Where: Vp= Compressional velocity; [Vp] = m/s x= Ip; [Ip] =cmg3∗ km s Ip= Acoustic Impedance a= 1.426; b = −51.59; c = 753.4; d = 847 A correlation between the evaporitic section thickness and the average Vp is also calculated (Fig. 9). Thinner salt
sections show higher velocities, as expected by the Halite displacement mechanism. The displacement is attributed to the
vertical movement of halite and other mobile salts (LVS group), which is in accordance with the Rayleigh-Taylor instability: Halite and LVS present a plastic, fluid-like behavior, and do not resist the overburden stresses, being hence displaced and leaving behind thinner sections with a higher proportions of HSV (Lachmann, 1910; Arrhenius, 1913 both referred in Dooley et al., 2015). Evaporitic thickness and its average interval velocity are inversely proportional. This inverse correlation is in agreement with the ideas presented by Oliveira et al. (2015), who mentioned that, in their project, when the evaporitic section increases in thickness, the average velocity for the entire section decreases.
CONCLUSIONS
Modeling of heterogeneous evaporitic properties is a complex subject, and a clear understanding of the uncertainties and limitations of the available data is crucial to ensure a useful final product.
Figure 8 – Transformation from Acoustic Impedance (IP) to Compressional Wave Velocity (Vp). 8A: Result of model-based acoustic inversion. 8B: Well-log cross-plot (Vpversus Ip). Colors are mineral groups (Green – LVS; Light Blue – Halite and Purple – HVS), as in Figure 7, and black line is the chosen polynomial fit in this work (Eq. 1). 8C: Vpcalculated from impedance (i.e. the chosen polynomial fit (8B) applied on the acoustic inversion result (8A).
Figure 9 – Correlation between Vp and evaporitic section thickness. 9a: Inverse correlation between average interval velocity and evaporitic thickness. Each dot
184
EVAPORITIC VELOCITY UNCERTAINTY AND VARIABILITYIn the Santos Basin, the evaporitic section is dominated by halite (about 80% in average – Maul et al. (2018a) – and 90% in the dataset used here). This can lead one to assume a homogeneous compressional velocity (Vp) of 4,500 m/s for
the entire section – the high occurrence of halite dominates the cross-plot, dwindling the influence of other evaporitic minerals.
Velocity variability is nevertheless observed within the evaporitic section, especially in the HVS group, which could be related to the higher compaction effects in anhydrites. The variability is less pronounced in thicker evaporitic section. This behavior seems to be more related to the mixed mineralogy observed in these thicker sections, and less to the individual mineral variability by itself. We defend the idea that, in these thicker sections, mineral mixing leads us to analyze the halite influence (more stable) over other minerals.
The methodology presented in this work results in an improved initial velocity model for seismic tomography, lowering the computational efforts when compared to the conventional approach (“salt flooding” + inversion tomographic updates), as cited by Gobatto et al. (2016), Falcão (2017), Fonseca et al. (2018), Maul et al. (2018a), Dias et al. (2019) and Maul et al. (2019).
The workflow is easy to implement, and not costly. Besides, the improved velocity can be used to assist other reservoir characterization processes, such as properties distribution studies, depth positioning forecast, uncertainty estimation, geomechanical studies, and drilling in safer conditions.
The inverse relation between salt thicknesses and average interval velocities suggests that mobile salts (LVS and Halite) are expelled by the overburden weight, such as the carbonate rafts, leading to higher HVS fractions in thinner sections.
ACKNOWLEDGEMENTS
The authors would like to express their gratitude to the Agência Nacional do Petróleo, Gás Natural e Biocombustíveis (ANP) for authorization to use the data necessary for the development of this project, and for allowing the publication of the obtained results so far in the first author’s doctoral research. The authors also thank Petrobras S.A. for all the financial support and availability of time and equipment, as well as the colleagues who have been collaborating with this research.
REFERENCES
AMARAL PJ, MAUL A, FALCÃO L, GONZÁLEZ M & GONZÁLEZ G. 2015. Estudo Estatístico da Velocidade dos Sais na Camada Evaporítica na Bacia de Santos. In: 14th International Congress of the Brazilian
Geophysical Society. Rio de Janeiro, RJ, Brazil. SBGf. doi: 10.1190/ sbgf2015-131.
ARRHENIUS S. 1913. Zur Physik der Salzlagerstätten. Medd. Vetensskapsakademiens Nobelinst, 2(20): 1-25.
BARROS P, FONSECA J, TEIXEIRA L MAUL A, YAMAMOTO T, MENEGUIM T, QUEIROZ LE, TORÍBIO T, MARTINI A, GOBATTO F & GONZÁLEZ M. 2017. Salt Heterogeneities Characterization in Pre-Salt Santos Basin Fields. In: OTC Offshore Technology Conference. Rio de Janeiro, RJ, Brazil. IBP. doi: 10.4043/28147-MS.
BEGG SH, BRATVOLD RB & WELSH MB. 2014. Uncertainty vs Variability: What’s the Difference and Why is it Important?. In: SPE Hydrocarbon Economics and Evaluation Symposium. Houston, TX, USA. doi: 10.2118/169850-MS.
CORNELIUS S & CASTAGNA JP. 2018. Variation in Salt-Body Interval Velocities in the Deepwater Gulf of Mexico: Keathley Canyon and Walker Ridge Areas. Interpretation, 6(1): T15-T27. doi: 10.1190/INT-2017-0069.1.
COSTA AM & POIATE Jr E. 2009. Rocha Salina na Indústria do Petróleo: Aspectos Relacionados à Reologia e à Perfuração de Rochas Salinas. In: MOHRIAK W, SZATMARI P & ANJOS SMC (Org.). Sal. Geologia e Tectônica. Exemplos nas Bacias Brasileiras. p. 362-385. São Paulo, SP, Brazil: Beca Edições LTDA.
DEMERCIAN S, SZATMARI P & COBBOLD P. 1993. Style and Pattern of Salt Diapirs due to Thin-Skinned Gravitational Gliding, Campos and Santos Basins, Offshore Brazil. Tectonophysics, 228(3-4): 393-433. doi: 10.1016/0040-1951(93)90351-J.
DIAS R, FONSECA J, BULCÃO A, DIAS B, TEIXEIRA LM, MAUL A & BORGES F. 2019. Salt Stratification and Least Square Migration to Improve Pre-Salt Images: Santos Basin, Brazilian Offshore Example. In: Second EAGE/PESGB Workshop on Velocities. London, United Kingdom. doi: 10.3997/2214-4609.201900051.
DOOLEY R, JACKSON M, JACKSON CAL, HUDEC MR & RODRIGUEZ CR. 2015. Enigmatic Structures within Salt Walls of Santos Basin – Part 2: Mechanical Explanation from Physical Modeling. Journal of Structural Geology, 75: 163-187. doi: 10.1016/j.jsg.2015.01.009.
FALCÃO LF. 2017. O Sal Estratificado e sua Importância na Modelagem de Velocidades para Fins de Migração Sísmica. Dinâmica oceânica e costeira. Universidade Federal Fluminense, UFF. Niterói, RJ, Brazil. 91 pp.
FALCÃO LF, MAUL AR, GOBATTO FO, GONZÁLEZ GAS & GONZÁLEZ MLAF. 2016. Results of incorporation Stratigraphy within the Evaporitic Sequence into the velocity Field for Reservoir Characterization. Brazilian Journal of Geophysics, 34(3): 341-349. doi: 10.22564/rbgf.v34i3.829. FONSECA J, GOBATTO F, BOECHAT J, MAUL A, YAMAMOTO T, BORN E, TEIXEIRA L & GONZÁLEZ M. 2017. Dealing with Evaporitic Salts Section
in Santos Basin during Geological Seismic Velocity Construction. In: 15th International Congress of the Brazilian Geophysical Society. Expanded Abstracts, Rio de Janeiro, RJ, Brazil, SBGf. doi: 10.1190/ sbgf2017-350.
FONSECA J, TEIXEIRA L, MAUL A, BARROS P, BOECHAT J & GONZÁLEZ M. 2018. Modelling Geological Layers into new Velocity Models for Seismic Migration Process: A Brazilian pre-Salt Case. In: First EAGE/PESGB Workshop on Velocities. London, United Kingdom. doi: 10.3997/2214-4609.201800010.
FREITAS JTR. 2006. Ciclos Deposionais Evaporíticos da Bacia de Santos uma Análise Cicloestratigráfica a partir de Dados de 2 Poços e de Traços de Sísmica. Master’s dissertation. Universidade Federal do Rio Grande do Sul, UFRGS. Porto Alegre, RS, Brazil. 160 pp.
GAMBOA LAP, MACHADO MAP, DA SILVEIRA DP, DE FREITAS JTR, DA SILVA SRP, MOHRIAK W, SZATMARI P & ANJOS S. 2009. Evaporitos Estratificados no Atlântico Sul: Interpretação Sísmica e Controle Tectono-Estratigráfico na Bacia de Santos. In: MOHRIAK W, SZATMARI P & ANJOS SMC (Org.). Sal. Geologia e Tectônica. Exemplos nas Bacias Brasileiras. p. 340-359. São Paulo, SP, Brazil: Beca Edições LTDA.
GOBATTO F, MAUL A, TEIXEIRA L, GONZÁLEZ G, FALCÃO L, GONZÁLEZ M & BOECHAT JT. 2016. Refining Velocity Model within the Salt Section in Santos Basin: An Innovative Workflow to Include the Existing Stratification and its Considerations. In: 87th SEG Annual Meeting. p. 5328-5331. Dallas, TX, USA: Society of Exploration Geophysicist. doi: 10.1190/segam2016-13685489.1.
GONZÁLEZ M, GOBATTO F, MAUL A FALCÃO L, GONZÁLEZ G, OLIVEIRA L, MENEGUIM T & AMARAL P. 2016. Proposed Workflow to Incorporate Stratification within Salt Section using Velocity and Seismic Attributes. In: Third EAGE/SBGf Workshop on Quantitative Seismic Interpretation of Lacustrine Carbonates. Expanded Abstracts, Rio de Janeiro, RJ, Brazil: EAGE/SBGf. doi: 10.3997/22144609.201600050. GONZÁLEZ G, MAUL A, JARDIM F, FALCÃO L, GOBATTO F & GONZÁLEZ M. 2018. Estimando Incertidumbres sobre la Amplitud Sísmica para un Yacimiento del Presal a través de Mapas de Iluminación. Geociencias Aplicadas Latinoamericanas, 4(1): 3-9. doi: 10.3997/2352-8281.20180003.
GUERRA MC & SZATMARI P. 2009. Modelagem Física de Processos Alogenéticos. In: MOHRIAK W, SZATMARI P & ANJOS SMC (Org. ). Sal. Geologia e Tectônica. Exemplos nas Bacias Brasileiras. p. 165-177. São Paulo, SP, Brazil: Beca Edições LTDA.
GUERRA MC & UNDERHILL JR. 2012. Role of Halokinesis in Controlling Structural Styles and Sediment Dispersal in the Santos Basin, Offshore Brazil. In: ALSOP GI, ARCHER SG, HARTLEY AJ, GRANT NT & HODGKINSON R (Org.). Salt Tectonics, Sediments and Prospectivity. Volume 363. p. 175-206. Geological Society of London, Special Publications. doi: 10.1144/SP363.9.
GUO N & FAGIN S. 2002. Becoming Effective Velocity-Model Builders and Depth Imagers, Part 2 – The Basics of Velocity-Model Building, Examples and Discussions. The Leading Edge, 21(12): 1210-1216. INGS S, BEAUMONT C & GEMMER L. 2004. Numerical Modeling of Salt Tectonics on Passive Continental Margins: Preliminary Assessment of the Effects of Sediment Loading, Buoyancy, Margin Tilt, and Isostasy. In: 24th Annual Research Conference. Expanded Abstracts, p. 36–68. Houston, TX, USA: Bob F. Perkins. GCSSEPM. CD-ROM.
JACKSON CAL, JACKSON MPA, HUDEC M & RODRIGUEZ CR. 2015. Enigmatic Structures within Salt Walls of Santos Basin - Part 1: Geometry and Kinematics from 3D Seismic Reflection and Well Data. Journal of Structural Geology, 75: 135-162. doi: 10.1016/j.jsg.2015.01.010. JI S, HUANG T, FU K & LI Z. 2011. Dirty Salt Velocity Inversion: The Road to a Clearer Subsalt Image. Geophysics, 76(5): WB169-WB174. doi: 10.1190/GEO2010-0392.1.
JONES IF & DAVISON I. 2014. Seismic Imaging in and around Salt Bodies. Interpretation, 2(4): SL1-SL20. doi: 10.1190/INT-2014-0033.1. JUSTEN JCR, VARGAS Jr EA, ALVES I & SOUZA ALS. 2013. Análise das Propriedades Elásticas de Rochas e Minerais Evaporíticos. In: 13th International Congress of the Brazilian Geophysical Society & EXPOGEF. p. 1154-1158. Rio de Janeiro, RJ, Brazil: SBGf. doi: 10.1190/sbgf2013-237.
LACHMANN R. 1910. Über autoplaste (Nichttektonische) Formelemente im Bau der Salzlagerstätten Norddeutschlands. Zeitschrift der Deutschen Geologischen Gesellschaft, 62: 113-116.
MAUL A, FALCÃO L, GOBATTO F, NOVELLINO V, JARDIM F, OLIVEIRA L, MENEGUIM T, AMARAL P, BORGES F & TEIXEIRA L. 2016. Incorporação de Estratificações dentro da Seção Evaporítica utilizando Velocidades e Atributos Sísmicos. Technical Report 152. Informe Geofísico da Petrobras. 9 pp.
MAUL A, JARDIM F, FALCÃO L & GONZÁLEZ G. 2015. Observing Amplitude Uncertainties for a Pre-Salt Reservoir using Illumination Study (Hit-Maps). In: 77th EAGE Conference & Exhibition. Madrid, Spain. doi: 10.3997/2214-4609.201412921.
MAUL A, FONSECA J, TEIXEIRA L, BARROS P, BOECHAT JB, NUNES JP, YAMAMOTO T, GONZÁLEZ M & GONZÁLEZ G. 2018a. Modeling Intra-Salt Layers when Building Velocity Models for Depth Migration Examples of the Santos Basins, Brazilian Offshore. In: 88th SEG Annual Meeting. Anaheim, CA, USA: Society of Exploration Geophysicist. doi: 10.1190/segam2018-2996209.1.
MAUL AR, SANTOS MAC & SILVA CG. 2018b. Few Considerations, Warnings and Benefits for the E&P Industry when Incorporating Stratifications inside Salt Sections. Brazilian Journal of Geophysics, 36(4): 461-477. doi: 10.22564/rbgf.v36i4.1981.
186
EVAPORITIC VELOCITY UNCERTAINTY AND VARIABILITYMAUL AR, SANTOS MAC, SILVA CG, FONSECA JS, GONZÁLEZ MLAF, TEIXEIRA LMS, YAMAMOTO TM, BORGES FAS & PONTES RLB. 2018c. Evaporitic Section Characterization and its Impact over the Pre-Salt Reservoirs, Examples in Santos Basin, Offshore. In: Rio Oil & Gas Exposition and Conference. p. 55–68. Rio de Janeiro, RJ, Brazil: IBP. MAUL AR, SANTOS MAC, SILVA CG, FONSECA JS, GONZÁLEZ MLAF, TEIXEIRA LMS, YAMAMOTO TM, BORGES FAS & PONTES RLB. 2019. Geological Characterization of Evaporitic Sections and its Impacts on Seismic Images: Santos Basin, Offshore Brazil. Brazilian Journal of Geophysics, 37(1): 55–68. doi: 10.22564/rbgf.v37i1.1989.
MENEGUIM T, MENDES S, MAUL A, FALCÃO A, GONZÁLEZ M & GONZÁLEZ G. 2015. Combining Seismic Facies Analysis and Well Information to Guide new Interval Velocity Models for a Pre-Salt Study, Santos Basin, Brazil. In: 14th International Congress of the Brazilian Geophysical Society. Rio de Janeiro, RJ, Brazil: SBGf. doi: 10.1190/ sbgf2015-271.
OLIVEIRA LC, FALCÃO LF, MAUL AR, ROSSETO JA, GONZÁLEZ M & GONZÁLEZ G. 2015. Geological Velocity Approach in order to obtain a detailed Velocity Model for the Evaporitic Section–Santos Basin. In: 14th International Congress of the Brazilian Geophysical Society & EXPOGEF.
p. 1374-1377. Rio de Janeiro, RJ, Brazil: SBGf. doi: 10.1190/sbgf2015-273.
SCHREIBER BC, BABEL M & LUGLI S. 2007. An Overview of Evaporite Puzzles. In: SCHREIBER B, LUGLI S & BABEL M (Eds.). Evaporites through Space and Time. Volume 285, p. 1-13. Geological Society, London, Special Publications.
TEIXEIRA L & LUPINACCI W. 2019. Elastic Properties of Salt in the Santos Basin: Relations and Spatial Predictions. Journal of Petroleum Science and Engineering, 180: 215-230. doi: 10.1016/j.petrol.2019.05. 024.
TEIXEIRA L, NUNES JP, FONSECA J, MAUL A, BARROS P & BORGES F. 2018. Seismic-Based Salt Characterization for Geomechanical Modelling of a Pre-Salt Reservoir. In: 80th EAGE Conference & Exhibition. Copenhagen, Denmark. doi: 10.3997/2214-4609.201801331.
ZDRAVEVA O, WOODWARD M, NICHOLS D & OSYPOV K. 2011. Building Anisotropic Models for Depth Imaging: comparing different approaches. In: 12th International Congress of the Brazilian Geophysical Society. Rio de Janeiro, RJ, Brazil: SBGf. doi: 10.4043/22827-MS.
Recebido em 22 abril, 2019 / Aceito em 11 junho, 2019 Received on April 22, 2019 / Accepted on June 11, 2019