Effect of environments on the estimated genetic potential of
segregating common bean populations
Gilmar Silvério da Rocha1*, José Eustáquio de Souza Carneiro1, Laércio da Silva Rezende Júnior1, Vanessa Maria Pereira e Silva1, José Ângelo Nogueira de Menezes Júnior1, Pedro Crescêncio Souza Carneiro1 and Paulo Roberto Cecon1
Received 29 June 2013
Accepted 06 September 2013
Abstract – The objective of this study was to investigate the effect of environments on the estimated genetic potential of common bean populations for the traits hypocotyl diameter and grain yield. We evaluated 48 segregating bean populations in the growing seasons winter 2009 (F2 and F3 simultaneously) and drought 2010 (F3 and F4 generations simultaneously), and 16 controls. The genetic potential of the population was estimated using the methodology of Jinks and Pooni. The coincidence between the best and worst populations in the two growing seasons and different generations for the two characters was low, indicating that the environmental effect interferes with the selection of common bean populations when using the method of Jinks and Pooni. Thus, it is recommended that the genetic potential should be estimated based on the evaluation of a larger number of environments.
Key words: Phaseolus vulgaris, genetic and phenotypic parameters, plant architecture, grain yield selection. Crop Breeding and Applied Biotechnology 13: 241-248 2013
Brazilian Society of Plant Breeding. Printed in Brazil
ARTICLE
1 Universidade Federal de Viçosa (UFV), Departamento de Fitotecnia, 36.570-000, Viçosa, MG, Brazil. *E-mail: [email protected]
INTRODUCTION
In bean breeding programs, selection is mostly per-formed in segregating populations obtained through artifi-cial hybridization followed by a few cycles of selfing. An important decision that defines the success of the selection is the choice of the populations with the greatest potential to produce superior lines. Prior knowledge about the potential of these populations can mean significant cost and time benefits, since breeders can focus on the most promising.
For the choice of a segregating population, aside from the mean, the variability is essential, since the genetic variability in the population may be low, since the genetic constitutions of the parents are similar for the target trait (Ramalho et al. 1993a). In some situations it is not possible to combine these two parameters (Santos et al. 2001).
One of the breeding procedures used to select segre-gating populations is that of Jinks and Pooni (1976). This method allows an estimated potential of a given population to generate lines superior to a certain standard reference, in the F∞ generation. For this purpose, the mean and vari-ance of the initial generations are estimated. Some studies have demonstrated the potential of this method to predict segregating common bean populations (Otubo et al. 1996, Abreu et al. 2002, Carneiro et al. 2002).
The selection of the most promising populations is based primarily on grain yield. However, other agronomic traits should be taken into consideration. In bean breeding, a decisive characteristic is the upright growth habit, which has been the focus of a number of studies (Cunha et al. 2005, Menezes Júnior et al. 2008, Rocha et al. 2012). An improved growth habit facilitates management practices and allows mechanical harvesting. However, the effect of environments, along with a visual assessment of plant ar-chitecture through scores assigned in the field, can hamper the choice of populations with more upright plants. Acquaah et al. (1991) reported the efficacy of the hypocotyl diameter to determine the architecture of common bean plants. Thus, this trait is a promising indicator to identify more upright populations.
that in the presence of interaction, the use of more than one reference cultivar and, particularly, data from two environ-ments, increased the accuracy of grain yield estimates. Jinks and Pooni (1980) also emphasized the importance of obtaining variance estimates free of interaction effects, since the interaction with the environment resulted in misleading predictions for the trait flowering in tobacco.
The aim of this study was to verify the environment effect on the estimated genetic potential of common bean populations for hypocotyl diameter and grain yield by the method of Jinks and Pooni.
MATERIAL AND METHODS
The 48 segregating common bean populations derived from crosses of 14 parents in a partial diallel mating scheme in 2008, were divided in groups. Group 1 consisted of three common bean parents with black beans (BRS Valente, BRS Supremo and IPR Uirapuru), three with carioca grain (beige grains with light brown stripes) (BRS Horizonte, CNFC 9466 and A805) and two “mulatinho” (cream-colored grains) (A170 and A525). Group 2 consisted of six parents with carioca grain (BRSMG Majestoso, VC 6, BRSMG Madrepérola, L1, L2 and L3). The two groups differed in plant growth and type.
The 48 populations were evaluated in the F2 and F3 generations, along with the 14 parents and 2 commercial cultivars (Pérola and BRSMG Talismã), resulting in a total of 112 treatments in the winter season (sowing in the first half of August 2009). For the dry season (sowing in Febru-ary 2010) a seed sample was taken from each treatment of the previous experiment. Thus, the populations evaluated in the dry season were in the F3 and F4 generations. The two experiments were conducted in an experimental field of the Federal University of Viçosa, in Coimbra/MG (lat 20° 45’ S, long 42° 51’ W, alt 690 m asl). Both experiments were arranged in a randomized block design with three replica-tions, with plots of four 4-m rows, spaced 0.5 m apart, and 15 seeds per meter.
The populations and controls were evaluated for grain yield and hypocotyl diameter, measured in 20 randomly selected plants in the plots. Fertilization at planting con-sisted of 350 kg ha-1 NPK fertilizer (8-28-16 of N, P
2O5 and K2O, respectively), and topdressing, 25 days after seedling emergence, of 30 kg ha-1 N. All other cultural practices were applied according to the regional recommendations for the crop.
In the individual analyses of variance, all effects, except for error and block, were considered fixed. The genetic potential of the segregating populations of each generation and growing season was estimated by the methodology of
Jinks and Pooni (1976), which estimates the probability of a population to originate lines superior to a certain standard (PSS). This probability corresponds to the area to the right of a given value x on the abscissa of the normal distribu-tion, calculated from the properties of a normal standard distribution, estimating variable Z by Z = (x – m)/s, where x = mean of the reference line (L) which, for grain yield, was cultivar Pérola, plus 35%, and for hypocotyl diameter was the average of line A805, plus 10%; m = average of lines in the F∞ generation which, in a model without domi-nance, correspond to the average of the generation under study (Fni); s = phenotypic standard deviation among lines
.
The genetic variance between lines ( ̂σ2
GL) is equivalent to twice the additive genetic variance ( ̂σ2
A) present in F2. For a model without dominance, the phenotypic variance in F2 ( ̂σ2
F2)contains ̂σ
2 A + ̂σ
2
E. Thus, ̂σ 2 A = ̂σ
2 F2 – ̂σ
2 E. Since the environmental variance between lines is similar to the environmental variance of the F2 generation, we have
. Therefore,
for a given population i,
. For populations evaluated in the F3 generation, the phe-notypic variance and estimate of variable Zi were: ̂σ2
3 = 1.5
̂
σ2 A + ̂σ
2
E and .
For F4 we used the following expressions: ̂
σ2
F4 = 1.75 ̂σ 2 A + ̂σ
2 E
and
The phenotypic variance for each population ( ̂σ2 Fi) was estimated in 20 plants per replication, sampled from the center rows, disregarding 0.5 m at either end. Subsequently, the average of these variances in the different replications was calculated. As an estimate of environmental variance of the populations the average of the environmental variances of each of the 16 controls was used. The environmental variance of each control corresponded to the phenotypic variance of these, estimated in the same way as for populations.
RESULTS AND DISCUSSION
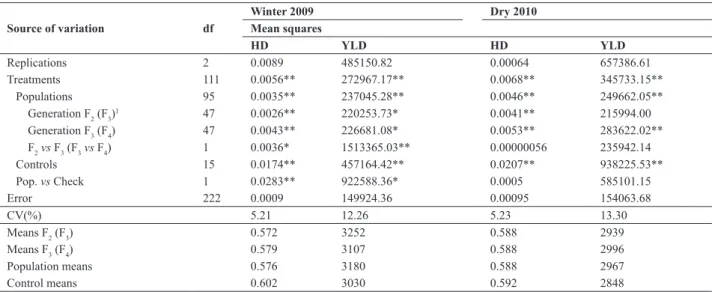
Significant population effects were also observed in the F2, F3 and F4 generations, except for YLD in F3, in the dry season. In the winter growing season, significant effects for the contrasts F2 vs F3 and Pop. vs Check indicated the presence of heterosis for the traits HD and YLD. However, in the dry season, the contrasts F3 vs F4 and Pop. vs. Check were not significant for either trait. These results suggest that the heterotic effects detected in F2 are small. The pre-dominance of pre-dominance effects associated with grain yield in common bean was reported by Rodrigues et al. (1998) and Gonçalves-Vidigal et al. (2008). However, other studies reported predominantly additive effects for YLD (Santos et al. 1985, Kurek et al. 2001).
The probabilities that populations originate lines that are 10% superior to the reference line A805 (PSS), consider-ing the hypocotyl diameter (Table 2) and 35% superior to cultivar Pérola for grain yield (Table 3), were inconsistent when compared in different generations and growing seasons, for most populations. The heritability estimates at the individual level for each population were generally low (Tables 2 and 3).
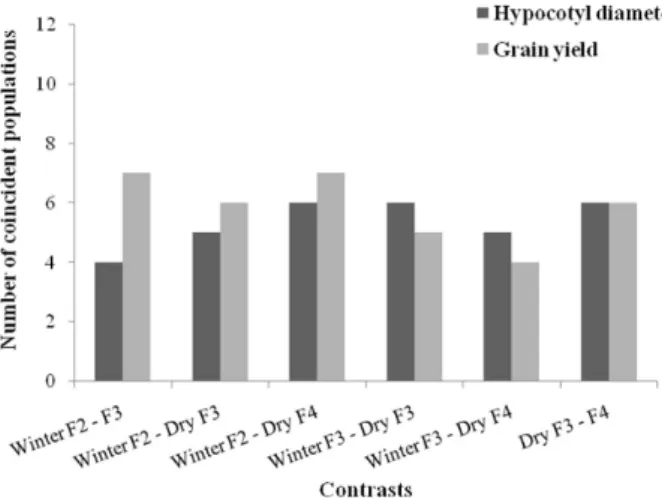
In the selection of the best 12 populations (25%), by the methodology of Jinks and Pooni (1976) based on the hypocotyl diameter or yield, it was observed that the num-ber of coincident populations in all six possible contrasts, given by the combination of different growing seasons and/ or by the generations, ranged from two to six (Figure 1). An analysis of the pairs of contrasts of these concordances showed less variation in HD than GY, indicating that the trait HD was less influenced by the environment.
When the 12 poorest populations were selected, the coincidence of the six prediction contrasts was also low (Figure 2). Thus, both in the selection of the best as in the elimination of the worst populations, the environmental effect on the prediction of the population potential by the methodology Jinks and Pooni (1976) was high. Triller and Toledo (1996) found that in soybean although the prediction by this method was not influenced by the heritability and complexity of the genetic control of the trait, the presence of genotype x environment interaction interfered with the prediction. These authors found that the use of two refer-ence cultivars, and especially data from two environments, increased the accuracy of grain yield estimates.
Table 1. Summary of individual analyses of variance for the traits hypocotyl diameter (HD) and grain yield (YLD) of common bean evaluated in the
winter of 2009 (generations F2 and F3, simultaneously) and dry growing seasons of 2010 (generations F3 and F4, simultaneously)
Winter 2009 Dry 2010
Source of variation df Mean squares
HD YLD HD YLD
Replications 2 0.0089 485150.82 0.00064 657386.61
Treatments 111 0.0056** 272967.17** 0.0068** 345733.15**
Populations 95 0.0035** 237045.28** 0.0046** 249662.05**
Generation F2 (F3)1 47 0.0026** 220253.73* 0.0041** 215994.00
Generation F3 (F4) 47 0.0043** 226681.08* 0.0053** 283622.02**
F2vs F3 (F3vs F4) 1 0.0036* 1513365.03** 0.00000056 235942.14
Controls 15 0.0174** 457164.42** 0.0207** 938225.53**
Pop. vs Check 1 0.0283** 922588.36* 0.0005 585101.15
Error 222 0.0009 149924.36 0.00095 154063.68
CV(%) 5.21 12.26 5.23 13.30
Means F2 (F3) 0.572 3252 0.588 2939
Means F3 (F4) 0.579 3107 0.588 2996
Population means 0.576 3180 0.588 2967
Control means 0.602 3030 0.592 2848
1 Source of variation in parentheses refers to the experiment of the dry season of 2010; ** and * significant, at 1% and 5% probability, respectively, by the F test.
Table 2. Probability of originating lines that are superior 10% (PSS, in %) to line A805, and heritability (h2, in %) of the hypocotyl diameter, of 48
common bean populations, evaluated in the winter 2009 (generations F2 and F3) and dry growing seasons of 2010 (generations F3 and F4)
Winter 2009 Dry 2010
Population Generation F2 Generation F3 Generation F3 Generation F4
PSS h2 PSS h2 PSS h2 PSS h2
BRS Valente x VC6 7.93 13.25 0.94 0.00* 14.69 30.37 11.9 15.82
BRS Valente x BRS MG Majestoso 12.10 33.46 16.11 50.51 6.55 26.31 0.73 0.00
BRS Valente x BRS MG Madrepérola 5.16 21.74 1.16 7.51 4.09 0.00 9.01 37.09
BRS Valente x L1 1.13 0.00 7.64 7.41 12.1 31.77 11.12 16.88
BRS Valente x L2 0.23 0.00 0.89 0.00 0.19 0.00 0.80 0.00
BRS Valente x L3 0.38 0.00 13.79 28.10 11.31 25.44 5.16 0.00
BRS Supremo x VC6 8.69 13.24 5.82 0.00 10.75 0.00 2.07 0.00
BRS Supremo x BRS MG Majestoso 8.85 10.09 9.68 33.09 10.20 31.84 5.48 0.00
BRS Supremo x BRS MG Madrepérola 2.39 0.00 3.22 23.86 7.21 21.19 1.70 0.00
BRS Supremo x L1 6.81 0.00 6.94 0.00 3.36 0.00 9.01 0.00
BRS Supremo x L2 7.93 21.58 10.38 29.06 0.96 0.00 3.75 11.22
BRS Supremo x L3 1.32 0.00 16.85 37.60 14.46 43.66 5.37 0.00
IPR Uirapuru x VC6 17.36 21.96 13.14 8.68 14.69 0.00 6.30 0.00
IPR Uirapuru x BRS MG Majestoso 7.35 7.65 10.56 7.91 5.71 0.00 11.12 0.00
IPR Uirapuru x BRS MG Madrepérola 2.12 0.00 8.08 21.22 9.85 28.92 5.71 27.63
IPR Uirapuru x L1 9.85 8.58 5.94 0.00 16.11 0.00 15.15 19.87
IPR Uirapuru x L2 12.71 33.20 7.08 26.98 8.69 8.16 4.09 5.66
IPR Uirapuru x L3 5.59 0.00 11.90 42.31 14.46 6.25 23.58 29.27
BRS Horizonte x VC6 5.26 0.00 9.68 25.13 12.71 18.53 18.41 52.48
BRS Horizonte x BRS MG Majestoso 5.26 14.19 0.59 0.00 1.29 0.00 0.96 0.00
BRS Horizonte x BRS MG Madrepérola 5.37 11.36 0.26 0.00 5.05 23.74 8.69 45.19
BRS Horizonte x L1 0.78 0.00 10.56 31.32 14.46 24.84 0.57 0.00
BRS Horizonte x L2 0.02 0.00 0.12 0.00 7.08 42.92 2.68 10.81
BRS Horizonte x L3 10.03 22.38 0.55 0.00 11.90 23.75 13.14 29.86
CNFC 9466 x VC6 14.23 19.93 20.90 27.89 11.90 17.26 22.96 40.56
CNFC 9466 x BRS MG Majestoso 1.79 0.00 2.56 0.00 0.96 0.00 0.84 0.00
CNFC 9466 x BRS MG Madrepérola 1.58 0.00 2.62 16.15 0.39 0.00 3.36 7.79
CNFC 9466 x L1 9.85 25.55 16.60 41.63 12.51 36.44 14.01 21.53
CNFC 9466 x L2 10.75 45.15 17.62 43.84 2.68 7.14 4.95 9.31
CNFC 9466 x L3 0.01 0.00 15.15 28.06 9.01 18.92 4.27 11.32
A805 x VC6 8.38 0.00 14.01 22.62 24.51 45.94 7.64 0.00
A805 x BRS MG Majestoso 14.01 30.72 1.10 0.00 2.22 0.00 0.99 0.00
A805 x BRS MG Madrepérola 3.67 5.40 2.94 5.57 4.01 22.28 6.68 43.87
A805 x L1 6.55 18.94 7.64 23.09 23.27 33.57 6.30 7.52
A805 x L2 0.87 0.00 3.22 9.95 1.02 0.00 0.84 0.00
A805 x L3 14.69 34.24 6.94 12.26 15.62 28.75 7.35 0.00
A170 x VC6 2.33 0.00 0.87 0.00 15.15 17.74 17.62 18.68
A170 x BRS MG Majestoso 4.36 0.00 5.26 5.91 0.09 0.00 3.75 0.00
A170 x BRS MG Madrepérola 1.16 0.00 1.50 8.63 1.54 0.00 4.27 0.00
A170 x L1 2.56 0.00 16.35 32.52 3.67 0.00 8.23 0.00
A170 x L2 3.51 0.00 0.64 0.00 0.68 0.00 7.35 25.52
A170 x L3 0.00 0.00 2.81 0.00 10.75 9.39 22.36 37.48
A525 x VC6 23.89 28.21 14.01 0.00 31.92 47.60 44.04 37.04
A525 x BRS MG Majestoso 2.44 0.00 16.85 28.45 23.27 39.68 12.71 27.32
A525 x BRS MG Madrepérola 4.46 17.64 3.36 0.00 7.93 35.16 2.28 0.00
A525 x L1 16.11 21.23 19.49 18.90 12.51 14.40 15.15 41.00
A525 x L2 5.05 9.53 11.90 36.11 9.68 31.46 14.92 43.45
A525 x L3 9.34 12.06 31.92 42.57 20.90 38.40 44.04 54.65
Table 3. Probability of originating lines that are superior 35% (PSS, in %) to cultivar Pérola, and heritability (h2, in %) of the grain yield, of 48 common
bean populations, evaluated in the winter 2009 (generations F2 and F3) and dry growing seasons of 2010 (generations F3 and F4)
Winter 2009 Dry 2010
Population Generation F2 Generation F3 Generation F3 Generation F4
PSS h2 PSS h2 PSS h2 PSS h2
BRS Valente x VC6 44.83 39.29 21.18 0.00* 41.29 26.70 37.07 0.00
BRS Valente x BRS MG Majestoso 45.22 70.31 48.80 65.16 39.74 41.69 39.74 0.00
BRS Valente x BRS MG Madrepérola 45.22 18.50 37.07 51.27 41.29 48.50 46.02 47.75
BRS Valente x L1 43.64 9.52 32.27 18.58 40.52 36.13 35.94 0.00
BRS Valente x L2 42.47 0.00 35.94 33.48 31.21 0.00 42.07 0.00
BRS Valente x L3 39.36 0.00 45.62 30.24 39.36 44.71 40.52 13.70
BRS Supremo x VC6 46.02 0.19 29.80 13.52 30.50 0.00 28.77 0.00
BRS Supremo x BRS MG Majestoso 38.21 22.93 33.36 29.26 38.97 9.95 36.32 27.61
BRS Supremo x BRS MG Madrepérola 41.68 42.70 37.07 40.59 39.36 43.67 43.64 17.74
BRS Supremo x L1 41.68 21.01 41.29 0.00 38.97 0.00 45.62 36.48
BRS Supremo x L2 34.46 16.73 34.83 64.98 35.94 0.00 37.07 0.00
BRS Supremo x L3 35.20 0.00 43.25 49.61 40.13 58.08 43.64 4.43
IPR Uirapuru x VC6 39.36 33.75 33.36 0.00 40.13 13.18 48.40 0.00
IPR Uirapuru x BRS MG Majestoso 37.07 26.06 35.20 17.38 33.36 0.00 46.02 22.88
IPR Uirapuru x BRS MG Madrepérola 37.07 21.51 39.36 50.58 42.07 27.03 38.59 36.05
IPR Uirapuru x L1 40.13 26.05 29.80 24.41 46.41 0.00 41.29 37.70
IPR Uirapuru x L2 38.59 34.78 32.27 0.00 36.32 15.61 40.52 16.73
IPR Uirapuru x L3 40.90 0.00 38.59 20.84 30.85 0.00 44.43 32.96
BRS Horizonte x VC6 38.21 0.00 36.32 22.27 39.36 22.74 41.29 34.94
BRS Horizonte x BRS MG Majestoso 35.20 49.01 38.21 0.00 25.14 0.00 35.94 0.00
BRS Horizonte x BRS MG Madrepérola 39.36 41.24 37.07 27.57 43.64 21.98 34.46 26.86
BRS Horizonte x L1 38.21 0.00 32.27 51.43 42.47 35.57 44.83 2.53
BRS Horizonte x L2 23.58 0.00 16.85 0.00 44.83 59.96 34.83 1.14
BRS Horizonte x L3 40.52 37.19 28.77 0.00 44.43 40.31 34.09 27.04
CNFC 9466 x VC6 42.86 0.00 38.21 0.00 40.13 12.58 44.83 34.84
CNFC 9466 x BRS MG Majestoso 40.13 39.60 43.25 8.15 42.47 0.00 49.20 0.00
CNFC 9466 x BRS MG Madrepérola 48.4 36.35 46.81 36.41 41.29 0.00 40.52 0.00
CNFC 9466 x L1 36.32 20.36 38.97 41.30 38.21 28.64 45.62 35.52
CNFC 9466 x L2 47.61 44.93 43.25 50.32 43.25 29.78 47.61 0.00
CNFC 9466 x L3 41.29 0.00 39.36 9.05 40.13 5.54 34.09 17.20
A805 x VC6 14.46 0.00 30.85 0.00 33.72 17.25 28.43 12.12
A805 x BRS MG Majestoso 37.45 28.84 22.66 0.00 37.83 0.55 36.32 14.17
A805 x BRS MG Madrepérola 44.04 29.19 25.14 0.00 48.40 52.80 39.36 48.33
A805 x L1 22.36 0.00 33.00 16.98 42.47 35.02 37.45 0.00
A805 x L2 26.76 0.00 26.43 0.61 37.07 0.00 36.32 0.00
A805 x L3 17.36 0.00 26.76 0.00 34.46 28.70 41.29 12.46
A170 x VC6 14.46 0.00 18.94 0.00 32.64 2.99 43.64 28.28
A170 x BRS MG Majestoso 33.00 6.80 34.83 2.98 45.22 0.00 42.86 1.98
A170 x BRS MG Madrepérola 33.72 0.00 34.09 0.00 40.52 0.00 31.92 0.00
A170 x L1 26.76 0.00 31.92 9.06 39.74 0.00 32.27 0.00
A170 x L2 39.74 36.76 14.23 0.00 39.74 0.00 41.68 0.29
A170 x L3 32.27 0.00 31.21 0.00 41.68 22.48 41.68 11.28
A525 x VC6 15.15 0.00 18.94 0.00 22.36 0.00 18.14 11.24
A525 x BRS MG Majestoso 0.00 0.00 27.76 28.02 38.21 44.25 40.13 39.54
A525 x BRS MG Madrepérola 25.14 0.00 27.09 10.66 28.10 0.00 34.46 0.00
A525 x L1 36.69 40.04 21.18 0.00 28.77 0.00 35.94 30.25
A525 x L2 26.43 0.00 20.04 0.00 21.48 0.00 27.09 0.00
A525 x L3 14.01 0.00 39.36 30.80 28.43 22.94 33.72 41.16
The use of individual plants as the basic unit of assess-ment is another limitation in the methodology of Jinks and Pooni (1976), because the estimates of genetic variance within plants are usually associated with large errors (Vello and Vencovsky 1974). The estimates of genetic variance were negative for several populations, indicating that the estimated environmental variance, based on controls, may not represent the real variation of the populations evaluated in this study. In these cases, the heritability (h2) for these populations was considered equal to zero (Tables 2 and 3). Importantly, for various populations, discrepant heritabil-ity estimates were obtained both between the two crops as within the same crop in different generations. An example of this situation was population BRS Valente x VC6, for both traits (Tables 2 and 3). Jinks and Pooni (1980), when assess-ing plant height and days to flowerassess-ing in tobacco, stressed the importance of obtaining estimates of variances free of interaction effects, since the interaction with the environ-ment for one of these traits led to deviations in predictions. Because of the large number of values of zero heritability
Table 4. Classification of the six best and the six worst-performing common bean populations for hypocotyl diameter (HD) and grain yield (YLD) in
the winter 2009 (F2 and F3) and dry growing seasons 2010 (generations F3 and F4)
Population Classification (Six best - HD) Sum of ranks
WIN/F2 WIN/F3 DRY/F3 DRY/F4
A525 x VC6 1 12 1 1 15
A525 x L3 13 1 5 2 21
CNFC 9466 x VC6 5 2 19 4 30
A525 x L1 3 3 16 9 31
CNFC 9466 x L1 12 7 15 11 45
A805 x VC6 16 11 2 21 50
Classification (Six worst - HD)
BRS Horizonte x BRS MG Majestoso 25 45 41 43 154
CNFC 9466 x BRS MG Madrepérola 38 36 46 37 157
BRS Horizonte x L2 46 48 30 38 162
CNFC 9466 x BRS MG Majestoso 37 37 44 44 162
A805 x L2 42 33 42 45 162
BRS Valente x L2 45 42 47 46 180
Classification (Six best - YLD)
CNFC 9466 x L2 2 6 7 3 18
CNFC 9466 x BRS MG Majestoso 17 5 9 1 32
BRS Valente x BRS MG Madrepérola 5 15 14 4 38
CNFC 9466 x BRS MG Madrepérola 1 2 15 23 41
BRS Valente x BRS MG Majestoso 4 1 22 25 52
CNFC 9466 x VC6 9 14 20 9 52
Classification (Six worst - YLD)
A525 x L3 47 10 44 42 143
A525 x L1 29 43 43 36 151
A805 x VC6 45 32 37 46 160
A525 x BRS MG Madrepérola 40 37 45 39 161
A525 x L2 39 44 48 47 178
A525 x VC6 44 46 47 48 185
in this work, alternatives must be proposed for less biased variance estimates. An alternative would be to estimate the environmental variance of each segregating population from the mean coefficient of environmental variation of its two parents, as suggested by Melo et al. (1997). These authors stated that if the parents and their segregating populations are evaluated in different plots, the variances can have different environmental effects, resulting in low or overestimated genetic variances. A second possibility would be to calculate the environmental variance for each population based on the average environmental variance of its two parents, as done by Carneiro et al. (2002). A third interesting alterna-tive would be the removal of outlier values from within the plots of controls, which are inbred lines, so the phenotypic variability contains only the environmental variance.
Based on the probabilities of obtaining lines superior to the standard cultivar (PSS), 48 populations of both genera-tions of each growing season were classified to select the six populations with the best and eliminate the six with the worst performance (Table 4). This selection was based on the sum of ranks, being the best populations identified by the lowest sums and the worst by the highest values.
Lines A525 and VC6 stood out in the formation of the best populations for HD (Table 4). For GY, parent CNFC 9466 performed best, represented in four of the six populations classified as best. The population CNFC 9466 x VC6 proved most promising for both HD and YLD, with the advantage of having parents with carioca grain. It is interesting to note
that four of the six best populations for HD were also among the worst for GY, while two populations of the worst for HD were classified as promising for GY. This result shows that the elimination of the worst populations, mainly when based on YLD, leads to the elimination of promising populations for breeding of lines with upright growth. Consequently, a strategy that would tend to improve both growth habit and grain yield would be the establishment of a recurrent selection program with the six most promising populations for each of these traits.
CONCLUSIONS
By the method Jinks and Pooni, when based on the hypo-cotyl diameter as well as grain yield, the environmental effect interferes with the selection of common bean populations. For greater reliability in selecting segregating common bean populations by the methodology of Jinks and Pooni, it is recommended to evaluate the populations in the greatest possible number of environments.
ACKNOWLEDGEMENTS
The authors are indebted to the Foundation for Research Support of the State of Minas Gerais (FAPEMIG) for financial support in the execution of the study, to the National Council for Scientific and Technological Development (CNPq) and the Coordination for improving Higher Education Personnel (CAPES) for scholarships.
Efeito de ambientes na predição do potencial genético de populações
segregantes de feijão
Resumo – O objetivo deste trabalho foi verificar o efeito de ambientes na predição do potencial genético de populações de feijoeiro
quanto ao diâmetro do hipocótilo e produtividade de grãos. Foram avaliadas 48 populações segregantes de feijão nas safras de inverno de 2009 (gerações F2 e F3 simultaneamente) e seca de 2010 (gerações F3 e F4 simultaneamente), além de 16 testemunhas. A predição
do potencial genético das populações foi feita utilizando a metodologia de Jinks e Pooni. Verificou-se baixa coincidência entre as melhores e entre as piores populações nas duas safras e nas diferentes gerações para os dois caracteres, evidenciando que o efeito de ambientes interfere na escolha das populações de feijoeiro, quando se utiliza o método de Jinks e Pooni. Assim, é recomendável que a predição do potencial seja realizada com base nas informações de um maior número de ambientes.
Palavras-chave:Phaseolus vulgaris, parâmetros genéticos e fenotípicos, arquitetura de planta, produtividade de grãos, seleção. REFERENCES
Abreu AFB, Ramalho MAP and Santos JB (2002) Prediction of seed-yield
potential of common bean populations. Genetics and Molecular
Biology 25: 323-327.
Acquaah G, Adams MW and Kelly JD (1991) Identification of effective
indicators of erect plant architecture in dry bean. Crop Science 31: 261-264.
Carneiro JES, Ramalho MAP, Abreu AFB and Gonçalves FMA (2002) Breeding potential of single, double and multiple crosses in common
bean. Crop Breeding and Applied Biotechnology 2: 515-524.
Cunha WG, Ramalho MAP and Abreu AFB (2005) Selection aiming at
upright-growth habit common bean with carioca type grains. Crop
Breeding and Applied Biotechnology 5: 379-386.
Gonçalves-Vidigal MC, Silvério L, Elias HT, Vidigal Filho PS, Kvitschal MV, Retuci VS and Silva CR (2008) Combining ability and heterosis
in common bean cultivars. Pesquisa Agropecuária Brasileira43:
1143-1150.
Jinks JL and Pooni HS (1980) Comparing predictions of mean performance
Jinks JL and Pooni HS (1976) Predicting the properties of recombinant
inbred lines derived by single seed descent. Heredity 36: 253-266.
Kurek AJ, Carvalho FIF, Assmann IC and Cruz PJ (2001) Capacidade
combinatória como critério de eficiência na seleção de genitores em
feijoeiro. Pesquisa Agropecuária Brasileira36: 645-651.
Melo LC, Santos JB and Ramalho MAP (1997) Choice of parents to
obtain common bean (Phaseolus vulgaris) cultivars tolerant to low
temperatures at the adult stage. Brazilian Journal of Genetics20:
283-292.
Mendes FF, Ramalho MAP and Abreu AFB (2009) Índice de seleção para
escolha de populações segregantes de feijoeiro-comum. Pesquisa
Agropecuária Brasileira44: 1312-1318.
Menezes Júnior JAN, Ramalho MAP and Abreu AFB (2008) Seleção recorrente para três caracteres do feijoeiro. Bragantia67: 833-838.
Otubo ST, Ramalho MAP, Abreu AFB and Santos JB (1996) Genetic control of low temperature tolerance in germination of the common
bean (Phaseolus vulgaris L.). Euphytica89: 313-317.
Ramalho MAP, Abreu AFB and Righetto GU (1993b) Interação de cultivares de feijão por épocas de semeadura em diferentes localidades
do estado de Minas Gerais. Pesquisa Agropecuária Brasileira28:
1183-1189.
Ramalho MAP, Abreu AFB and Santos PSJ (1998) Interações genótipos x épocas de semeadura, anos e locais na avaliação de cultivares de
feijão nas regiões sul e alto Paranaíba em Minas Gerais. Ciência e
Agrotecnologia 22: 176-181.
Ramalho MAP, Santos JB and Zimmermann MJO (1993a) Genética
quantitativa em plantas autógamas: aplicações ao melhoramento do feijoeiro. Editora UFG, Goiânia, 271p.
Rocha GS, Pereira LPL, Carneiro PCS, Paula Júnior TJ and Carneiro JES (2012) Common bean breeding for resistance to anthracnose
and angular leaf spot assisted by SCAR molecular markers. Crop
Breeding and Applied Biotechnology 12: 34-42.
Rodrigues R, Leal NR and Pereira MG (1998) Análise dialélica de seis
características agronômicas em Phaseolus vulgaris L. Bragantia
57: 241-250.
Santos JB, Vencovsky R and Ramalho MAP (1985) Controle genético da produção de grãos e de seus componentes primários em feijoeiro. Pesquisa Agropecuária Brasileira20: 1203-1211.
Santos PG, Soares AA and Ramalho MAP (2001) Predição do potencial genético de populações segregantes de arroz de terras altas. Pesquisa Agropecuária Brasileira36: 659-670.
Triller C and Toledo JFF (1996) Using the F3 generation for predicting
the breeding potential of soybean crosses. Revista Brasileira de
Genética 19: 289-294.
Vello NA and Vencovsky R (1974) Variâncias associadas às estimativas de variância genética e coeficiente de herdabilidade. In Escola
Superior de Agricultura Luiz de Queiroz. Relatório científico de