Vol.54, n. 6: pp. 1125-1133, November-December 2011
ISSN 1516-8913 Printed in Brazil BRAZILIAN ARCHIVES OF
BIOLOGY AND TECHNOLOGY
A N I N T E R N A T I O N A L J O U R N A L
Scale Up of Dextran Production from a Mutant of
Pediococcus pentosaceus (SPAm) Using Optimized Medium
in a Bioreactor
Seema Patel, Damini Kothari, Rishikesh Shukla, Debasish Das and Arun Goyal
*Department of Biotechnology; Indian Institute of Technology Guwahati; Guwahati, 781 039; Assam - India
ABSTRACT
The mutant of Pediococcus pentosaceus (SPAm) produced earlier by UV-mutagenesis exhibiting higher dextransucrase activity as compared to wild-type was used. The generated mutant SPAm gave 12.2 mg/ml, a 20% higher dextran than wild-type. Response surface methodology was carried out for further enhancement of dextran production. To enhance dextran production by the mutant SPAm, Plackett-Burman Design and a 22 full factorial Central Composite Design was employed. After response optimization, the optimum concentration of sucrose and yeast extract was 5.115% (w/v) and 0.635% (w/v), respectively. The experimental values of dextran 36.0 mg/ml at flask level and 35.0 mg/ml at bioreactor level were in good agreement with the predicted value of 40.8 mg/ml. The increase in dextran production by the mutant SPAm using the optimized medium was 3 fold higher as compared to unoptimized medium.
Key words: Pediococcus pentosaceus, dextran, Plackett-Burman Design, Central Composite Design, Response
Surface Methodology
*Author for correspondence: [email protected]
INTRODUCTION
Dextrans (C6H10O5)n are a class of
homopolysaccharides produced by the lactic acid
bacteria belonging to the genera Lactobacillus,
Leuconostoc, Streptococcus and Weissella (Katina
et al., 2009; Patel et al., 2011). Dextrans consist of
D-glucose units polymerized predominantly in α
-(1→6) linkage (Padmanabhan et al., 2003) and α
-(1→2), α-(1→3), α-(1→4) glycosidic linked
branches (Kim et al., 2003). Dextrans have enormous industrial applications due to their non-ionic, inert, stable, porous, gelling and pseudoplastic attributes (Patel et al., 2011). These are used as food syrup stabilizers, matrix of
chromatography columns, blood plasma
biomaterials (Sengupta et al., 2006).) Use of dextrans have ramified into paper, metal-plating processes and enhanced oil recovery (Patel et al., 2011). Dextrans from various microbial sources have been studied and characterized to evaluate their industrial potentials (Purama et al., 2009; Majumder and Goyal, 2009; Patel et al., 2010). The concentrations of medium components are crucial parameters regulating the microbial metabolite production. The direct and traditional measurement techniques as ‘one factor at a time’ used for optimization of multivariable system is time consuming, labour intensive and prone to erroneous data. Statistical approaches such as Plackett-Burman Design and Central Composite Design by Response surface methodology (RSM) are commonly used methods to optimize culture medium, enzyme synthesis, aqueous two phase separation of proteins and glucan production (Liu and Wang, 2007; Majumder et al., 2009a, Majumder et al., 2009b). To enhance the production of dextran concentration, combinatorial interactions of medium components is a good strategy. Considering the multifarious utility of dextran, a natural isolate of lactic acid bacterium,
Pediococcus pentosaceus (SPA) producing
significantly high dextran concentration was screened from the soil of Assam. The dextran
production ability of Pediococcus genus was
reported for the first time (Patel and Goyal,
2010b). Further this was the first report on
Pediococcus pentosaceus showing dextran
production which is more or comparable to other commercial Leuconostoc strains (Majumder et al., 2009a; Majumder et al., 2009b). In the present work, a high dextran yielding mutant (SPAm)
developed from wild-type Pediococcus
pentosaceus by UV-mutagenesis was used. The
dextran concentration from the mutant SPAm was enhanced by statistical optimization of the medium. Plackett-Burman Design was used to screen the significant factors and Central Composite Design was used to investigate their interactive effects.
MATERIAL AND METHODS
Culturing of mutant (SPAm) of Pediococcus pentosaceus
The mutant SPAm (Patel and Goyal, 2010a) was
obtained from the wild-type Pediococcus
pentosaceus (Patel and Goyal, 2010b). The
cultures were maintained as stab in modified MRS agar (Goyal and Katiyar, 1996) (containing 2%
(w/v) sucrose) at 4°C and sub-cultured every 2
weeks. From the cultures maintained as MRS agar
stab at 4°C, 1 loopful was inoculated in the
enzyme production medium described by Tsuchiya
et al. (Tsuchiya et al., 1952) and grown at 25°C at
180 rpm for 12h. This medium consisted of (%,
w/v) sucrose, 2; yeast extract, 2; K2HPO4, 2;
MgSO4. 7H2O, 0.02; MnSO4.4H2O, 0.001;
FeSO4.7H2O, 0.001; CaCl2, 0.001; NaCl, 0.001
and the pH of medium was adjusted to 6.9. 1% of this broth was transferred to 250 ml Erlenmeyer flask containing 50 ml of statistically designed medium with variable composition and incubated at the above mentioned culture conditions.
Estimation of dextran concentration
The carbohydrate content in the cell free supernatant of the lactic acid bacterium mutant SPAm grown in statistically designed enzyme production medium with variable ingredient composition was determined by phenol-sulphuric acid method (Dubois et al., 1956) in a micro-titre plate (Fox and Robyt, 1991). To 25 l of sample containing dextran in a microtitre plate, 25 l of 5% (v/v) phenol was added. The mixture was mixed by shaking the plate on a vortex mixer for 30s. Then the plate was placed on an ice bath and 125 l of concentrated sulphuric acid was added to each well containing the mixture. The plate was again shaken for 30s to ensure proper mixing of the contents of the wells. Then the plate was wrapped in cling film and incubated in water bath
at 80°C for 30 min. After cooling to room
temperature, the absorbance was determined at 490 nm on a multimode microplate reader (Tecan,
model InfiniteTM 200). A Standard graph was
plotted using dextran (40 kDa) in the concentration range 0.1-1 mg/ml.
Optimization procedure and experimental designs
data were done by Minitab statistical software (Majumder et al., 2009a).
Plackett-Burman Design
Five medium components were selected for
Plackett-Burman Design viz. sucrose, yeast
extract, K2HPO4, Tween 80 and CaCl2. Among the
nutrients, sucrose was selected as the carbon source as it is the substrate and inducer of dextran
production (Tsuchiya et al., 1952) full stop
needed. Yeast extract powder was chosen as the nitrogen source for its significant effect on dextran
production (Majumder et al., 2009a). K2HPO4 was
chosen as it acts as a buffering agent in the fermentation medium to maintain its pH for a longer duration (Goyal and Katiyar, 1997). The surfactant Tween 80 was selected as it alters the membrane permeability and enhances the release of the extracellular dextransucrase, which is expected to increase dextran biosynthesis (Goyal and Katiyar, 1997). CaCl2 was considered for its
stimulatory effect on dextransucrase production (Qader et al., 2008). Each of the 5 factors was examined in two levels: low level (-1) and high level (+1) (Plackett and Burman, 1946). The
factors considered, their levels and the design matrix were presented in Table 1. Plackett-Burman experimental design is based on the first order polynomial model:
(1)
Where, Y is the response (dextran
concentration), βo is the model intercept and βi is
the linear coefficient, and xi is the level of the
independent variable.
This model is useful for screening and evaluation of the key factors that influence the response. In this work, 5 variables were screened in 16 run orders. The experiments were carried out in duplicate and the averages of the dextran concentrations were taken as response (Table 1). From the regression analysis the variables, which were significant at 95% level (P < 0.05) were considered to have greater impact on dextran production and were further optimized by a central composite design. The experimental design and statistical analysis of the data were done by Minitab statistical software package (Version15) (Majumder et al., 2009a).
Table 1 - Plackett-Burman Design for two levels of 5 variables in uncoded values along with the observed dextran
concentrations.
Central Composite Design
The 22 full-factorial central composite design
(CCD) with two medium constituents, i.e. sucrose and yeast extract was generated by Minitab statistical software. In this study, the experimental plan consisted of 13 run orders. The experiments were carried out in duplicate and the averages of
the dextran concentration were taken as the
response. The relationships among the variables
were determined by fitting the following second-order polynomial equation to the data obtained from 13 experiments.
(2)
Run Order Sucrose (A) Yeast extract (B) K2HPO4(C) Tween 80 (D) CaCl2 (E) Dextran (mg/ml)
1 6 1 1 1 0.002 15.6
2 1 1 3 0.1 0.0002 5.2
3 6 1 1 0.1 0.0002 16.5
4 1 3 1 0.1 0.0002 2.9
5 1 3 1 1 0.002 3.0
6 1 3 3 0.1 0.002 4.2
7 6 3 1 1 0.0002 11.5
8 1 3 3 1 0.0002 3.0
9 6 1 3 1 0.0002 16.8
10 6 3 3 0.1 0.0002 13.7
11 1 1 3 1 0.002 5.4
12 1 1 1 0.1 0.002 5.6
13 6 1 3 0.1 0.002 21.7
14 6 3 3 1 0.002 12.2
15 6 3 1 0.1 0.002 11.8
16 1 1 1 1 0.0002 7.2
o i i
Y
=
β
+
∑
β
x
2
k k
o i i ii i i j i j
Where, Y is the predicted response, k is the number
of factor variables, βo is the model constant, βi is
the linear coefficient, βii is the quadratic
coefficient, βij is the interaction coefficient. Xi is
the factor variable in its coded form. The data were analyzed statistically by ANOVA method. P-values below 0.1 were regarded as statistically
significant.The quality of the fit of the polynomial
model equation was expressed by the coefficient of
determination R2 and the significance of the
regression coefficients were checked by F-test and p-value (Zhong and Wang, 2010).
Validation of the model at shake flask and bioreactor level
The confirmation and validation of data under shake flask and bioreactor level was done by using the RSM optimized medium composition. In one set, the experiment was performed in 500 ml flask with 200 ml optimized culture medium and grown at 25°C at 180 rpm. The parameters like dextran concentration, enzyme activity, pH, sucrose concentration and cell optical density were analyzed at every 2h interval as described above. In another set of experiment the fermentation was carried out in 1L volume of culture medium in a 3L bioreactor (Applikon, model Bio Console ADI 1025). 1% inoculum from 12h grown culture was inoculated in the bioreactor. The pH 7.0 and
temperature 25oC were kept constant throughout
the fermentation process. The Dissolved Oxygen (DO) was adjusted to 100% before inoculation. The agitation was set to 180 rpm at the beginning of the run but changed accordingly to keep the DO above 40%. The parameters like dextran
concentration, enzyme activity, sucrose
concentration and cell optical density were analyzed at every 2h interval. The cell optical density was taken at 600 nm. The dextran concentration was measured as described in earlier section. The enzyme activity was analysed by estimating the reducing sugars by the Nelson-Somogyi protocol (Nelson, 1944; Nelson-Somogyi, 1945). The sucrose concentration was determined by estimating the reducing sugars by the method of Sumner and Sisler (1944).
RESULTS AND DISCUSSION
Estimation of dextran of wild-type Pedio-coccus pentosaceus and its mutant SPAm
The mutant SPAm showed 12.2 mg/ml dextran,
whereas the wild-type Pediococcus pentosaceus
exhibited 10.2 mg/ml. The mutant showed higher dextran production by 20% as compared to the wild-type. The dextran structure from the mutant as analysed by FTIR, NMR spectroscopy was identical to that of wild-type, however, surface morphology by SEM analysis showed larger pore size of dextran from the mutant (data not shown).
Fitting the model
The interpretation of data in Table 1 revealed that there was an extreme variation in the dextran concentration in the 16 trials ranging from 2.9 mg/ml to 21.7 mg/ml. This variation can be attributed to the variable medium composition. Regression coefficients of the 5 ingredients were analysed (Table 2).
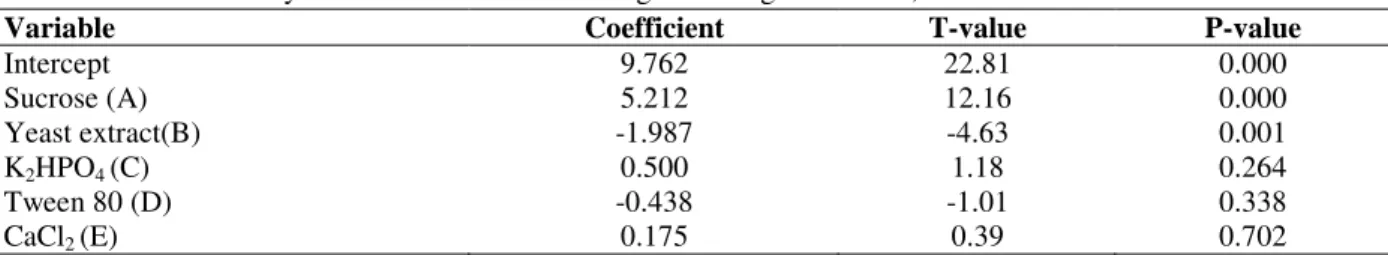
Table 2 - Statistical analysis of Plackett-Burman Design showing coefficient, T and P values for each variable
Lower the P-value higher the significance of the variable (Majumder et al., 2009a). The variable sucrose and yeast extract had confidence levels greater than 95% as revealed by Pareto chart, so were considered significant. Sucrose having coefficient 5.212 was positively significant and its presence in the medium in higher concentrations
enhanced dextran production. Yeast extract having coefficient -1.987 was found negatively significant and its presence in the medium in lower concentrations stimulated dextran production. Excluding insignificant variables the model equation for dextran concentration after screening by Plackett-Burman Design can be written as
Variable Coefficient T-value P-value
Intercept 9.762 22.81 0.000
Sucrose (A) 5.212 12.16 0.000
Yeast extract(B) -1.987 -4.63 0.001
K2HPO4 (C) 0.500 1.18 0.264
Tween 80 (D) -0.438 -1.01 0.338
Y = 9.762 + 5.212A – 1.987B (3)
Where, Y= Dextran concentration, A = Sucrose
and B = Yeast extract
On the basis of the significant coefficients (Table 2), sucrose and yeast extract were selected for further medium optimization to maximize dextran production. All other variables used in all the trials were kept to their median levels. At the end of the screening experiments for different nutritional factors, the conditions were optimized by Central Composite Design (CCD). Taking five levels of both the significant factors, thirteen experiments were carried out from the design (Table 3). The results of the second order response surface model fitting in the form of ANOVA are given in Table 4. To test the fit of the model, the regression
equation and determination coefficient R2 were
evaluated. The model presented a high R2 value of
94.35% and adjusted R2 value of 90.32% for
dextran concentration. The coefficients of regression for the dextran concentration were
calculated and the following regression equation was obtained.
Y= 27.2171 + 24.5989X1 - 25.3429X2-12.5250
X1X2 +7.5709X1 2
– 0.9282X2
2 (4)
Where, Y = Response (Dextran concentration),
X1= Sucrose and X2=Yeast extract.
The ANOVA of quadratic regression models for dextran concentration demonstrated that the model is highly significant, and is evident from the Fisher’s F-test with a very low probability value [(Pmodel > F = 0.0000)]. The significance of each coefficient was determined by t-values and P-values which are listed in Table 5. Larger magnitude of t-test and smaller P-value indicates the high significance of the corresponding coefficient (Tanyildizi et al., 2005).
The result showed that the interaction, X1X2
(sucrose. yeast extract) is highly significant with a P value of 0.066 and a negative coefficient of −12.5250.
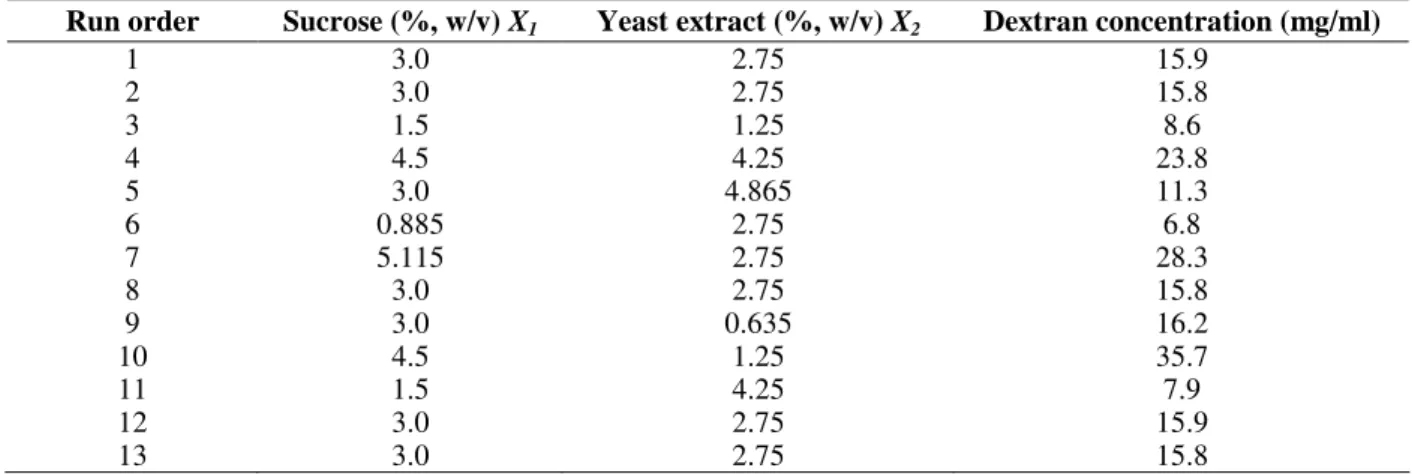
Table 3 - 22 full factorial Central Composite Design matrix of two variables in uncoded units and experimental
response.
Table 4 - ANOVA of Central Composite Design for dextran concentration.
Run order Sucrose (%, w/v) X1 Yeast extract (%, w/v) X2 Dextran concentration (mg/ml)
1 3.0 2.75 15.9
2 3.0 2.75 15.8
3 1.5 1.25 8.6
4 4.5 4.25 23.8
5 3.0 4.865 11.3
6 0.885 2.75 6.8
7 5.115 2.75 28.3
8 3.0 2.75 15.8
9 3.0 0.635 16.2
10 4.5 1.25 35.7
11 1.5 4.25 7.9
12 3.0 2.75 15.9
13 3.0 2.75 15.8
Source DF Sum of squares Mean Square F-value Prob. P > F
Model 5 773.81 65.743 23.4 0.00
Residual (error) 7 46.30 1.138 - -
Lack of fit 3 46.29 2.277 5143.5 0.00
Pure error 4 0.012 0.000 4.74 -
Table 5 - Model coefficient of dextran estimated by multiple linear regression.
Analysis of response surface
The 3D response surface and 2D contour plots are the graphical representations of regression
equations (Zhong and Wang, 2010). They
conveniently illustrate the relationship between responses and experimental levels of each variable and the type of interactions between two test variables. The shapes of the contour plots indicate the significance of mutual interactions between the variables. Circular contour plot symbolises negligible interactions between the corresponding
variables, whereas elliptical contour plot indicates
the significant interactions between the
corresponding variables (Zhong and Wang, 2010). The contour and surface plot representing the regression equation for yield of dextran from the mutant SPAm was presented in Figure 1.
The plot illustrated that the interaction between the independent variable sucrose and yeast extract
(X1X2) is negative but very strong. The dextran
production was increased at high sucrose and low yeast extract concentration (Fig. 1).
Figure 1 - Contour and surface plot of the combined effects of sucrose and yeast extracton dextran
concentration of mutant (SPAm).
Optimization of medium composition and experimental validation of the model
Response optimization predicted the maximum dextran production of 40.8 mg/ml with desirability 1, at sucrose concentration 51.15 g/L and yeast extract concentration 6.35 g/L. Response surface methodology (RSM) showed that a medium containing (g/L) sucrose, 51.15; yeast extract,
6.35; K2HPO4, 20; MgSO4·7H2O, 0.2;
MnSO4·4H2O, 0.01; FeSO4·7H2O, 0.01;
CaCl2·2H2O, 0.01; NaCl 0.01 and Tween 80, 5
(ml/L) was optimum for the production of dextran. The dextran production by the mutant of
Pediococcus pentosaceus (SPAm) using optimized
medium was compared at shake flask level and batch fermentation in a bioreactor. The fermentation profile of dextran production from the mutant in flask and bioreactor is shown in Figure 2 and Figure 3, respectively. The
maximum dextran concentration obtained
experimentally using the above medium
composition was 36.0 mg/ml at shake flask level which showed good agreement with the predicted value 40.8 mg/ml (Fig.2).
The increase in dextran concentration of the mutant after medium optimization (36.0 mg/ml) was 3 fold higher as compared to unoptimized medium (12.2 mg/ml). For the bioreactor the
Model Term Coefficient Standard error of Coefficient T-value P-value
Inter-cept 27.2171 15.936 1.708 0.131
X1 24.5989 14.587 1.686 0.136
X2 -25.3429 14.105 -1.797 0.115
X12 7.5709 4.362 1.736 0.126
X22 -0.9282 4.362 -0.213 0.838
online data such as dissolved oxygen, pH, temperature and agitation were monitored and the offline data like dextran concentration, enzyme
activity, sucrose concentration and cell optical density were plotted with time (Fig.3).
Figure 2 - Variation of dextran concentration, enzyme activity, sucrose concentration, cell optical
density and pH during batch fermentation of the mutant of Pediococcus pentosaceus
(SPAm) in flask.
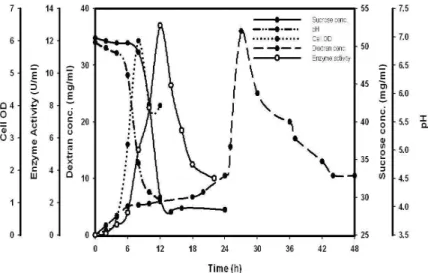
Figure 3 - Variation of dextran concentration, enzyme activity, sucrose concentration and cell
optical density during batch fermentation of the mutant of Pediococcus pentosaceus
(SPAm) in bioreactor.
The dextran concentration after 14-16h was 35 mg/ml which was also in good agreement with the predicted value. The %DO dropped to 40% after 6h of fermentation showing the micro-aerophillic nature of microorganism.
In both cases sucrose concentration profiles showed no consumption of sucrose during first 10-12h. On comparison of dextran and sucrose concentration profiles in the bioreactor, it was found that the dextran concentration peaked after
the commencement of sucrose consumption. In bioreactor, the enzyme activity (10.9 U/ml) and the cell optical density both, reached maximum at
14h, which is in agreement with the report of
growth associated biosynthesis of dextransucrase (Santos et al., 2000; Rodrigues et al, 2003, Michelena et al., 2003). Oxygen is known to have positive effects on the growth of certain strains of
L. mesenteroides (Veljkovic et al. 1992). Thus the
compared to flask culture, is possibly be due to the effect of oxygen mass transfer rates on biosynthesis of dextransucrase and hence dextran.
CONCLUSIONS
Dextran concentration of Pediococcus pentosaceus
(SPAm) mutant was 12.2 mg/ml with unoptimized medium. Using statistical methods the medium composition was optimized. The response optimization gave 5.115% sucrose and 0.635% yeast extract resulting in enhanced dextran production. The predicted value of dextran (40.8 mg/ml) was in good agreement with the experimental values from flask culture (36.0 mg/ml) and from bioreactor run (35.0 mg/ml). The RSM optimized medium gave 3-fold higher dextran production from the mutant SPAm as compared to unoptimized medium. The results show that the optimized medium can be implemented for large scale dextran production
from Pediococcus pentosaceus (SPAm).
ACKNOWLEDGEMENT
The research work was financially supported by a project grant from Council of Scientific and Industrial Research (CSIR), New Delhi, India to AG.
REFERENCES
Aumelas, A., Serrero, A., Durand, A., Dellacherie, E., Leonard, M. (2007), Nanoparticles of hydro-phobically modified dextrans as potential drug carrier systems. Colloids and Surfaces B: Biointerfaces, 59,
74-80.
Baba, M., Schols, D., De Clercq, E., Pauwels, R., Nagy, M., Gyorgyi-Edelitnyi, J., Low, M., Gorog, S. (1990), Novel sulfated polymers as highly potent and selective inhibitors of human immunodeficiency virus replication and giant cell formation. Antimicrob. Agents Chemother.,34, 134-138.
Bautista, M.C., Bomati-Miguel, O., Morales, M.P., Serna, C.J., Veintemillas-Verdaguer, S. (2005), Surface characterisation of dextran-coated iron oxide nanoparticles prepared by laser pyrolysis and coprecipitation. J. Magnetism and Magnetic Materials, 293, 20-27.
Dubois, M., Gilles, K.A., Hamilton, J. K., Rebers, P.A., Smith, F. (1956), Colorimetric method for determination of sugars and related substances. Anal. Chem., 28, 350-356.
Fox, J.D., Robyt, J.F. (1991), Miniaturization of three carbohydrate analyses using microsample plate reader. Anal. Biochem., 19, 593-596.
Goyal, A., Katiyar, S.S. (1996), Regulation of dextransucrase productivity of Leuconostoc mesenteroides B-512F by the maintenance media. J. Gen. Appl. Microbiol., 42, 81-85.
Goyal, A., Katiyar, S.S. (1997), Effect of certain nutrients on the production of dextransucrase from
Leuconostoc mesenteroides B-512F. J. Basic Microbiol., 37, 197-204.
Katina, K., Maina, N.H., Juvonen, R., Flander, L., Johansson, L., Virkki, L., Tenkanen, M., Laitila, A. (2009), In situ production and analysis of Weissella confusa dextran in wheat sourdough. Food Microbiol., 26, 734-743.
Kim, D., Robyt, J.F., Lee, S.Y., Lee, J.H., Kim, Y.M. (2003), Dextran molecular size and degree of branching as a function of sucrose concentration, pH and temperature of reaction of Leuconostoc mesenteroides B-512FMCM dextransucrase. Carbohydr. Res., 338, 1183-1189.
Ko, W.H., Wong, C.C., Yeung, H.W., Yung, M.H., Shaw, P.C., Tam, S.C. (1991), Increasing the plasma half-life of trichosanthin by coupling to dextran.
Biochem. Pharmacol., 42, 1721-1728.
Liu, G.C., Wang, X.L. (2007), Optimization of critical medium components using response surface methodology for biomass and extracellular polysaccharide production by Agaricus blazei. Appl. Microbiol. Biotechnol., 74, 78-83.
Majumder, A, Goyal, A. (2009), Rheological and gelling properties of a novel glucan from
Leuconostoc dextranicum NRRL B-1146. Food Res. Int., 42, 525-528.
Majumder, A., Singh, A., Goyal, A. (2009a), Application of response surface methodology for glucan production from Leuconostoc dextranicum
and its structural characterization. Carbohydr. Polym., 75, 150-156.
Majumder, A., Bhandari, S., Purama, R.K., Patel, S., Goyal, A. (2009b), Enhanced production of a novel dextran from Leuconostoc mesenteroides NRRL
B-640 by response surface methodology. Ann. Microbiol., 59, 1-7.
Michelena, G.L., Martínez, A., Bell, A., Carrera, E., Valencia, R. (2003), Scale-up of dextransucrase production by Leuconostoc mesenteroides in fed
batch fermentation. Braz. Arch. Biol. Technol., 46,
Nelson, N. (1944), A photometric adaptation of the Somogyi method for the determination of glucose. J. Biol. Chem., 153, 375-380.
Padmanabhan, P.A., Kim, D.S., Pak, D., Sim, S.J. (2003), Rheology and gelation of water-insoluble dextran from Leuconostoc mesenteroides NRRL
B-523. Carbohydr. Polym., 53, 459-468.
Patel, S., Goyal, A. (2010a), Isolation, characterization and mutagenesis of exopolysaccharide synthesizing new strains of lactic acid bacteria. Internet J. Microbiol., 8 (1), 1-14.
Patel, S., Goyal, A. (2010b), 16S rRNA based identification and phylogenetic analysis of a novel dextran producing Pediococcus pentosaceus isolated
from north-east Indian microbial diversity. Curr. Trends Biotechnol. Pharm., 4 (3), 746-754.
Patel, S., Majumder, A., Goyal, A. (2011), Potentials of exopolysaccharides from lactic acid bacteria. Indian J. Microbiol., DOI 10.1007/s12088-011-0148-8
Patel, S., Kasoju, N., Bora, U., Goyal, A. (2010), Structural analysis and biomedical applications of dextran produced by a new isolate Pediococcus pentosaceus screened from biodiversity hotspot
Assam. Bioresour. Technol., 101, 6852-6855.
Plackett, R.L., Burman, J.P. (1946), The design of optimum multifactorial experiments. Biometrika, 33,
305-325.
Purama, R.K., Goyal, A. (2005), Dextransucrase production by Leuconostoc mesenteroides. Ind. J. Microbiol., 2, 89-101.
Purama, R.K., Goswami, P., Khan, A.T., Goyal, A. (2009), Structural analysis and properties of dextran produced by Leuconostoc mesenteroides NRRL
B-640. Carbohydr. Polym., 76, 30-35.
Qader, S.A., Aman, A., Saeeda, B., Syed, N., Azhar, A. (2008), Role of calcium ions and temperature on dextransucrase production. Ind. J. Biotechnol., 7,
404-406.
Rodrigues, S., Lona, L.M., Franco, T.T. (2003), Effect of phosphate concentration on the production of dextransucrase by Leuconostoc mesenteroides NRRL
B-512. Bioprocess. Biosyst. Eng., 26, 57-62.
Santos, M., Teixeira, J., Rodrigues, A. (2000), Production of dextransucrase, dextran and fructose from sucrose using Leuconostoc mesenteroides
NRRL B-512. Biochem. Eng. J., 4, 177-188.
Sengupta, A., Wang, S., Link, E., Anderson, E.H., Hofmann, C., Lewandowski, J., Kottke-Marchant, K., Marchant, R.E. (2006), Glycocalyx-mimetic dextran modified poly (vinyl amine) surfactant coating reduces platelet adhesion on medical-grade polycarbonate surface. Biomaterials, 27, 3084-3095.
Somogyi, M. (1945), A new reagent for determination of sugars. J. Biol. Chem., 160, 61-68.
Sumner, J.B., Sisler, E.B. (1944), A simple method for blood sugar. Arch. Biochem., 4, 433-436.
Tanyildizi, M.S., Ozer, D., Elibol, M. (2005), Optimization of α-amylase production by Bacillus sp.
using response surface methodology. Process Biochem., 40, 2291-2296.
Tsuchiya, H.M., Hellman, N.N., Koepsell, H.J., Corman, J., Stringer, C.S., Rogovin, S.P., Bogard, M.O., Bryant, G., Feger, V.H., Hoffman, C.A., Senti, F.R., Jackson, R.W. (1952), Factors affecting molecular weight of enzymatically synthesized dextran. J. Am. Chem. Soc., 77, 2412-2419.
Veljkovic, V.B., Lazic, M.L., Rutic, D.J., Jovanovic, S.M., Skala, D.U. (1992), Effect of aeration on extracellular dextran production by Leuconostoc mesenteroides. Enzym. Microb. Technol., 14,
665-668.
Zhong, K., Wang, Q. (2010), Optimization of ultrasonic extraction of polysaccharides from dried longan pulp using response surface methodology. Carbohydr. Polym., 80, 19-25.