Optimizing a culture medium for biomass and phenolic compounds production using
Ganoderma lucidum
Carlos Andrés Zárate-Chaves
1, María Camila Romero-Rodríguez
1,
Fabián Camilo Niño-Arias
2, Jorge Robles-Camargo
2, Melva Linares-Linares
1,
María Ximena Rodríguez-Bocanegra
1, Ivonne Gutiérrez-Rojas
1 1Unidad de Investigaciones Agropecuarias, Departamento de Microbiología, Facultad de Ciencias, Pontificia Universidad Javeriana, Bogotá, D.C., Colombia.
2
Grupo de Investigación Fitoquímica, Universidad Javeriana, Departamento de Química, Facultad de Ciencias, Pontificia Universidad Javeriana, Bogotá, D.C., Colombia.
Submitted: July 11, 2011; Approved: July 2, 2012.
Abstract
The present work was aimed at optimizing a culture medium for biomass production and phenolic compounds by using Ganoderma lucidum. The culture was optimized in two stages; a Plackett-Burman design was used in the first one for identifying key components in the medium and a central composite design was used in the second one for optimizing their concentration. Both responses (bio-mass and phenolic compounds) were simultaneously optimized by the latter methodology regarding desirability, and the optimal concentrations obtained were 50.00 g/L sucrose, 13.29 g/L yeast extract and 2.99 g/L olive oil. Maximum biomass production identified in these optimal conditions was 9.5 g/L and that for phenolic compounds was 0.0452 g/L, this being 100% better than that obtained in the media usually used in the laboratory. Similar patterns regarding chemical characterization and bi-ological activity towardsAspergillussp., from both fruiting body and mycelium-derived secondary metabolites and extracts obtained in the proposed medium were observed. It was shown that such sta-tistical methodologies are useful for optimizing fermentation and, in the specific case ofG. lucidum, optimizing processes for its production and its metabolites in submerged culture as an alternative to traditional culture.
Key words:Medium optimization,Ganoderma lucidum, Plackett-Burman, central composite de-sign, phenolic compounds.
Introduction
Ganoderma lucidum is a Basidiomycetes fungus from the order Polyporales, which is widely known in tradi-tional western medicine for its immunomodulating proper-ties and its antitumor effects. It has been shown that this fungus is useful in treating and preventing high blood pres-sure, hyperglycemia, hepatitis, chronic bronchitis, asthma, heart diseases, cancer and HIV (Mei-Chun et al., 2006; Mulleret al., 2006; Laiet al., 2010; Leskosek-Cukalovicet al., 2010), as well as its great effect on slowing down cell senescence and its antioxidant content (Sudheesh et al., 2010).G. lucidum‘s beneficial properties are related to a
broad variety of bioactive compounds present in the fruiting body, mycelium and spores. Polysaccharides, tri-terpens, phenols, steroids, amino acids, nucleosides and nu-cleotides can be found amongst such compounds. The first two have been most studied, more than 100 compounds have been identified as having biological activity;b-1-3 andb-1-6 D-glucans are the polysaccharides having the greatest biological activity and A and B ganoderic acids in the triterpens (Russell and Paterson, 2006; Leskosek-Cuka-lovicet al., 2010).
Phenolic compounds are widely distributed amongst living organisms, particularly in plants where they play an
Send correspondence to I. Gutiérrez-Rojas. Unidad de Investigaciones Agropecuarias, Departamento de Microbiología, Facultad de Ciencias, Pontificia Universidad Javeriana, Carrera 7ª 43-82, Edificio Carlos Ortiz, S.J. Oficina 608, Bogotá D.C., Colombia. E-mail: [email protected].
important role in response to pathogenic agents, having an-tibacterial and antiparasitic activity, sometimes being highly specific (Del Signoreet al., 1997). Such compounds have one or more aromatic rings, with one or more hydro-xyl groups; they can be found as simple molecules (pheno-lic acids, phenylpropanoids, flavonoids) or as highly poly-merized compounds (lignin, melanin, tannins) and most of their biological effects have been attributed to their antioxi-dant activity (Barroset al., 2009). Even though their pres-ence has been reported in many species of edible and non-edible macromycetes, such asAmanita rubescens, Bo-letus edulis, Cantharellus cibarius, Fistulina hepática, Hydnum repandum, Hygrophoropsis aurantiaca, Hygrophorus agathosmus, Hygrophorus olivaceo-albus, Laccaria amethystine, Lactarius aurantiacus, Lactarius salmonicolor, Lepista inversa, Mycena haematopus, Russula caerulea, Russula cyanoxantha, Russula delica, Russula sardonia, Suillus bellini, Suillus collinitus, Suillus granulatus, Suillus luteus, Suillus mediterraneensis, Tricholoma atrosquamosum, Tricholoma equestre, Tricholoma sulphureumandTricholomopsis rutilans (Ri-beiroet al., 2008; Barroset al., 2009; Vazet al., 2011), these compounds have been little studied in the genus
Ganoderma. It has been reported that polyphenols are the principal antioxidant components in methanol extracts of
G. lucidum(16.5 to 27.9 mg.g1) (Saltarelliet al., 2009) and ofG. tsugae(24.0 to 35.6 mg/g) (Mauet al., 2005), such values being similar to those reported for other macro-mycetes such asAntrodia camphorata (38.0± 0.7 mg/g) (Song and Yen, 2002),Ramaria botrytis(20.32±0.7 mg/g),
Hypholoma fasciculare(17.67±0.27 mg.g1) (Barroset al., 2009) and significantly higher than those found in other species, such as Agaricus bisporus (4.49 ± 0.16 mg/g),
Lactarius deliciosus(3.40±0.18 mg/g) andCantharellus cibarius(1.75±0.50 mg/g) (Barroset al., 2009).
ManyG. lucidum-based products are available on the market in the form of tea, powders and extracts due to their beneficial human health properties (Xuanweiet al., 2007). They are normally produced from the fruiting body and cul-tured by solid state fermentation; however, this production method has serious disadvantages, including an extensive culture time (around six months), the difficulty in control-ling product quality and the culture’s susceptibility to envi-ronmental changes (Changet al., 2006). Efforts have thus been directed towards producing bioactive substances in submerged fermentation, mainly by studying culture condi-tions and media formulated for producing biomass and me-tabolites such as polysaccharides and ganoderic acid (Yang and Liau, 1998; Yanget al., 2000; Fanget al., 2002; Tang and Zhong., 2002; Changet al., 2006; Tanget al., 2010; Zhuet al., 2010). However, there are no reports of studies for producing phenolic compounds in submerged culture.
The present study thus established the composition of a culture medium for producing biomass and phenolic
com-pounds fromG. lucidumin submerged culture. A two-stage experimental strategy was used: 1) exploratory (a Plackett-Burman design was used for identifying the me-dium’s key components) and 2) optimization (a central composite design was applied for optimizing their concen-tration). A desirability function was used in the latter stage for simultaneously optimizing both responses (i.e.biomass and phenolic compounds).
Materials and Methods
Microorganism
TheG. lucidum basidiocarp (fruiting body) isolates were obtained from a commercial culture in Cumaral (Meta, Colombia) for the mycelium to be produced by the optimized culture medium. The fungi was conserved by plating it in YGC agar (Oxoid®) and incubated at 24 °C for nine days; discs of this agar were then placed in distilled sterile water and kept at 4 °C.
Culture media and growth conditions
The culture medium used for inoculum reactivation and production was YGC agar (Oxoid®). The liquid fer-mentation medium consisted of a base solution (in g/L: 1, K2HPO4 Carlo Erba®; 1, KH2PO4 Merck®; 0.5, MnSO4.7H2O Merck®; 0.1, chloramphenicol Sigma®), added from the substrates to be evaluated, according to the detailed experimental design described later on. The myce-lium conserved at 4 °C was plated in YGC agar and incu-bated for nine days at 24 °C. Seven discs of this agar (6 mm diameter) were inoculated in 125 mL Erlenmeyer flasks with 35 mL liquid fermentation medium; they were incu-bated in a shaker at 120 rpm for 10 days at 24 °C. All exper-iments were done in triplicate.
Analytical methods
concentra-tion was calculated as being the difference between the concentration of extracts without PVPP and PVPP-treated extracts. The standard curve for this reaction was prepared using gallic acid. The evaluated extracts were kept at -20 °C from the time of being collected until being analyzed.
Experimental design
Selecting significant variables for a Plackett-Burman design (PBD)
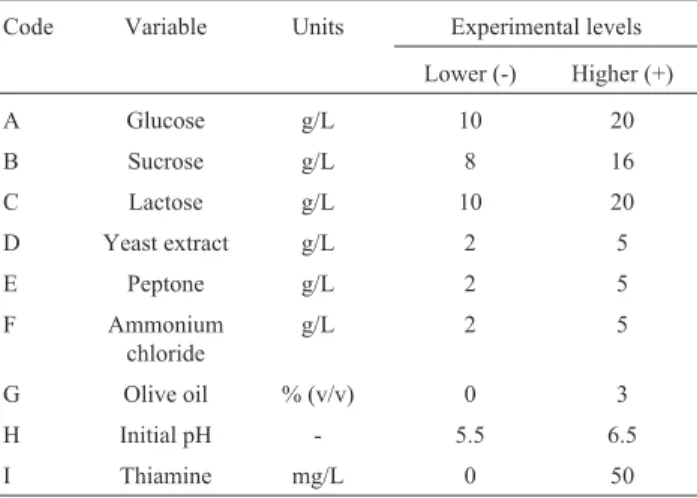
PBD was initially used for evaluating the relative im-portance of nine parameters inG. lucidumbiomass produc-tion in submerged culture. The following were evaluated: three carbon sources (glucose, sucrose and lactose), two or-ganic nitrogen sources (yeast extract and peptone), an inor-ganic nitrogen source (ammonium chloride), adding olive oil and thiamine to the culture medium and initial pH as cul-ture condition. Table 1 gives the experimental design, along with the variables and levels which were evaluated; each variable’s effects on biomass production were esti-mated as well as the difference between averages for high (+) and low (-) measurements (23). Statgraphics Centurion 15.2 software was used for both design and statistical anal-ysis, multiple regression and ANOVA.
Optimizing a central composite design (CCD)
A CCD was used for identifying optimum levels for the significant variables selected by PBD (Table 2) to ob-tain maximum biomass production (Y1) and maximum EPC
concentration (Y2). The design consisted of eight factorial
points, six axial points (star) and six central points in two blocks for a total of 20 experiments. The quadratic model for predicting the optimum point was expressed by the fol-lowing equation:
Y =b0+
å
b Xi i +å
b Xii i +å
b X Xij i j2
(1)
whereYwas the response variable,bthe model’s regres-sion coefficient andX the independent variables’ coded levels.
A desirability function (Eq. (2)) was used after the polynomial equations related to cell growth and EPC had been generated for selecting the most relevant factors for the response of interest in a combined response. This func-tion was defined as being a shared funcfunc-tion having two lim-iting values (minimum and maximum desirability), where values less than the established minimum were assumed to be 0, whilst values exceeding the established maximum were assumed to be 1.
0
1 ,
,
,
min
min
max min
min max
max
y y
d y y
y y y y y
y y
£
=
-- £ £
³ ì
í ï ï
î ï ï
(2)
The values from the desirability functions for each replicate point, in each response evaluated (biomass and EPC) were obtained for generating a combined response; the geometric mean of both values were then calculated by assigning 3 and 5 coefficients of importance, respectively (Eq. (3)), thereby obtaining an average desirability index (D). The theoretical values used for adjusting the desirabil-ity function were assigned in line with the pertinent litera-ture and experimental results; 18.7 g/L was thus determined for biomass, since this value was the maximum for biomass reported in optimizing biomass production using G. lucidum(Changet al., 2006) and the greatest experimental value obtained was used in the same design for EPC.
Dp =(db´dc)
3 5 18 (3)
Statgraphics Centurion 15.2 software was used for all design, statistical analysis, multiple regression and ANOVA operations.
Chemical characterization of biomass and culture medium extracts
MatureG. lucidumfruiting bodies obtained from the commercial culture and mycelium produced by the opti-mized culture medium were freeze-dried prior to solid-liquid extraction fractionation with petroleum ether (ben-zene), dichloromethane (CH2Cl2) and ethyl acetate (EtOAc). Each fraction was concentrated by vacuum evap-oration after 96 h extraction. Concentrated fractions were then dissolved in the same solvent (for chemical character-ization) or DMSO (for antifungal activity assay). The
re-Table 1- Experimental variables at different levels in Plackett-Burman
design forG. lucidumbiomass production.
Code Variable Units Experimental levels Lower (-) Higher (+)
A Glucose g/L 10 20
B Sucrose g/L 8 16
C Lactose g/L 10 20
D Yeast extract g/L 2 5
E Peptone g/L 2 5
F Ammonium
chloride
g/L 2 5
G Olive oil % (v/v) 0 3
H Initial pH - 5.5 6.5
I Thiamine mg/L 0 50
Table 2- Independent variable levels tested for the central composite
de-sign.
Code Variable Units Experimental levels -1.5 -1 0 +1 +1.5
X1 Olive oil % (v/v) 0 1 3 5 6
X2 Yeast extract g/L 3 6 12 18 21
maining mycelium production culture medium was extracted by liquid-liquid fractionation in the same condi-tions as for fruiting bodies and mycelium.
The fractions were characterized by thin layer chro-matography on silica gel plates (Alugram Nano-Sil G/UV254 – Macherey-Nagel). The separated compounds were detected by vanillin staining (phenolics and steroids), antimony III chloride–SbCl3 (terpenoids), diphenylboric acid-2-aminoethyl ester–Neu reagent (flavonoids) and po-tassium hydroxide–KOH (coumarins), hydroxylami-ne-FeCl3 (lactones) and 2, 4-dinitrophenylhydrazine-2,4 DNPH (ketones) (Merck, 1980; Jorket al., 1990).
Biomass and culture medium extract antifungal activity assay
The biomass and culture medium extracts’ antifungal activity regarding two clinical Aspergillus sp. isolates (strains 1 and 10) was evaluated by disk diffusion test fol-lowing National Committee for Clinical Laboratory Stan-dards guidelines (2003). Whatman grade No. 1 filter paper disks (6 mm diameter) were activated with 100mg of each extract or 25mg terbinafine as positive control for inhibit-ing fungal growth.
Results and Discussion
Plackett-Burman design
PBD methodology is a powerful and useful tool which is used for the rapid screening of key variables in a
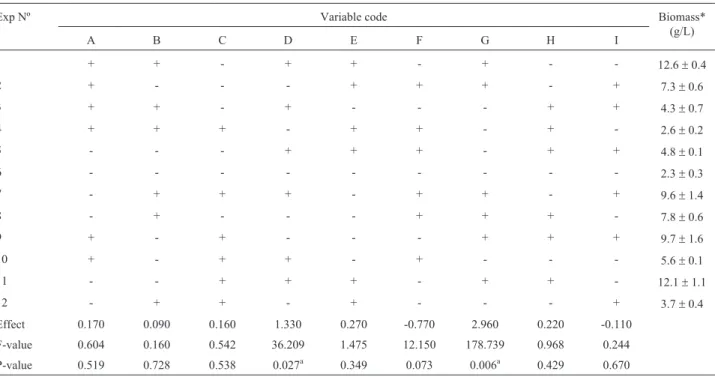
multivariable system; even though it does not determine exact amounts, it does provide important information about each factor by using very few experiments (Plackett and Burman, 1946; De Souzaet al., 2008; Prasadet al., 2010). A 12 experiment PBD was used during the first optimiza-tion phase for evaluating the effect of nine variables (glu-cose, sucrose, lactose, yeast extract, peptone, ammonium chloride, olive oil, thiamine and initial pH) on biomass pro-duction fromG. lucidum. The variables’ interaction on two levels in PBD has revealed that yeast extract (p = 0.027) and olive oil (p = 0.006) significantly affect G. lucidum
growth (Table 3).
Similar results have been obtained by other authors; a positive relationship has been found between adding olive oil and biomass production usingG. lucidumand when us-ingCordyceps militaris(Parket al., 2002). The olive oil is formed by several fatty acids, such as oleic, linoleic and linolenic acid, their main component being oleic acid (55%-83%). Song and Yen (2002), have proposed that oleic acid is able to directly incorporate itself into fungi cell membrane, increasing its fluidity and thereby facilitating the entry of other substrates present in culture medium. On the other hand, yeast extract is a vitamin B complex source (growth factors), amino acids, peptides and some carbohy-drates, supporting effective cell development. Similar re-sults have been obtained by Changet al. (2006), whom found that yeast extract and olive oil are two substrates sig-nificantly influencing biomass development when usingG. lucidum. Fanget al.(2002), have also reported that adding
Table 3- Plackett Burman design results. The medium components and initial pH significance onG. lucidumbiomass production are showed after 10
fer-mentation days.
Exp Nº Variable code Biomass*
(g/L)
A B C D E F G H I
1 + + - + + - + - - 12.6±0.4
2 + - - - + + + - + 7.3±0.6
3 + + - + - - - + + 4.3±0.7
4 + + + - + + - + - 2.6±0.2
5 - - - + + + - + + 4.8±0.1
6 - - - 2.3±0.3
7 - + + + - + + - + 9.6±1.4
8 - + - - - + + + - 7.8±0.6
9 + - + - - - + + + 9.7±1.6
10 + - + + - + - - - 5.6±0.1
11 - - + + + - + + - 12.1±1.1
12 - + + - + - - - + 3.7±0.4
Effect 0.170 0.090 0.160 1.330 0.270 -0.770 2.960 0.220 -0.110
F-value 0.604 0.160 0.542 36.209 1.475 12.150 178.739 0.968 0.244 P-value 0.519 0.728 0.538 0.027a 0.349 0.073 0.006a 0.429 0.670 *Results shown are average of three replicate experiments.
organic nitrogen sources significantly promotes greater fungal growth during liquid fermentation, suggesting that some amino acids cannot be synthetized from inorganic ni-trogen sources.
Regarding carbon source, no significant effect was de-tected for any of the three sources evaluated: glucose (p = 0.5179), sucrose (p = 0.728) or lactose (p = 0.538). Con-tradictory reports about this are found in the literature, since it has been shown that sucrose (in brown sugar form) has a stimulating effect on biomass production when using G. lucidum(Changet al., 2006), whilst other authors, such as Tang and Zhong (2002), have found that lactose was the best carbon source for biomass and ganoderic acid production by theG. lucidumCCGMC 5.616 strain and that sucrose was the carbohydrate which least promoted biomass production. Bearing the foregoing in mind, the decision to use sucrose as carbon source for later optimization was based on the results obtained in this work, since PBD did not detect differences or negative effects for the sugars evaluated regarding bio-mass production and/or the economic aspect.
Central composite design
A full 23factorial design (eight factorial points) was used in the second optimization phase, increased by six
ax-ial points (star) and six central point replicates, giving a to-tal of 20 experiments, for optimizing the concentration of olive oil (X1), yeast extract (X2) and sucrose (X3) in the
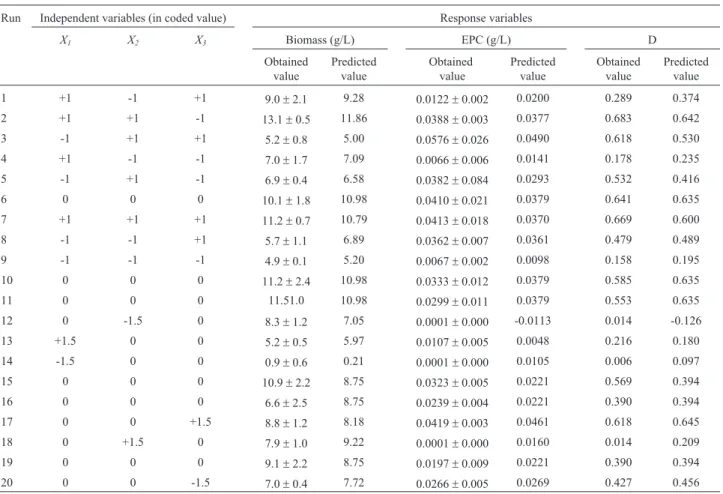
cul-ture medium. Table 4 shows the results of these experi-ments, as well as the values predicted by the second order model for the three response variables (Y1, biomass; Y2, CEF andY3,D).
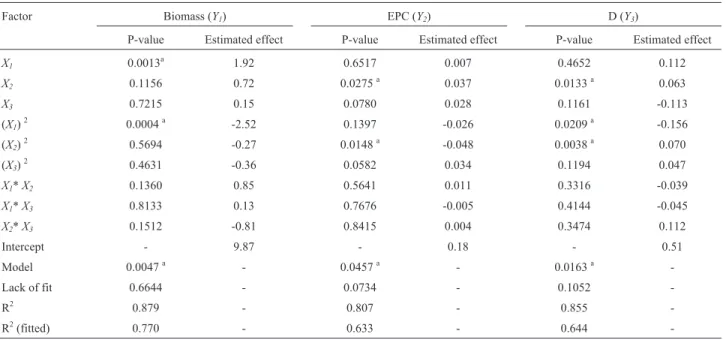
Table 5 presents the corresponding analysis of vari-ance (ANOVA) results. The coefficient of determination (R2) value provided a measure of how the variability in val-ues observed in the response variables could be explained by the experimental factors and their interactions. So, the model’s R2(Table 5) (0.879 forY1, 0.807 forY2and 0.855 for Y3) indicated that the model could explain 87.9%,
80.7% and 85.5%, respectively, of total variation in each case. P values (0.0047 forY1, 0.0457 forY2and 0.0163 for
Y3) showed that the model represented a good prediction for
the experimental results. When each response was sepa-rately analyzed, it was observed that olive oil had a signifi-cant influence on both lineal (p = 0.0013) and quadratics terms (p = 0.0004) regardingG. lucidumgrowth (Y1). EPC
concentration (Y2) was seen to be influenced by yeast
ex-tract (p = 0.0275, lineal term, p = 0.0148 quadratic term). Regarding the combined response of biomass and EPC (D),
Table 4- Central composite design results. The coded values of independent variables and obtained and predicted values for the three response variables
are showed. The biomass and EPC responses were determined after 10 fermentation days.
Run Independent variables (in coded value) Response variables
X1 X2 X3 Biomass (g/L) EPC (g/L) D
Obtained value
Predicted value
Obtained value
Predicted value
Obtained value
Predicted value
1 +1 -1 +1 9.0±2.1 9.28 0.0122±0.002 0.0200 0.289 0.374
2 +1 +1 -1 13.1±0.5 11.86 0.0388±0.003 0.0377 0.683 0.642
3 -1 +1 +1 5.2±0.8 5.00 0.0576±0.026 0.0490 0.618 0.530
4 +1 -1 -1 7.0±1.7 7.09 0.0066±0.006 0.0141 0.178 0.235
5 -1 +1 -1 6.9±0.4 6.58 0.0382±0.084 0.0293 0.532 0.416
6 0 0 0 10.1±1.8 10.98 0.0410±0.021 0.0379 0.641 0.635
7 +1 +1 +1 11.2±0.7 10.79 0.0413±0.018 0.0370 0.669 0.600
8 -1 -1 +1 5.7±1.1 6.89 0.0362±0.007 0.0361 0.479 0.489
9 -1 -1 -1 4.9±0.1 5.20 0.0067±0.002 0.0098 0.158 0.195
10 0 0 0 11.2±2.4 10.98 0.0333±0.012 0.0379 0.585 0.635
11 0 0 0 11.51.0 10.98 0.0299±0.011 0.0379 0.553 0.635
12 0 -1.5 0 8.3±1.2 7.05 0.0001±0.000 -0.0113 0.014 -0.126
13 +1.5 0 0 5.2±0.5 5.97 0.0107±0.005 0.0048 0.216 0.180
14 -1.5 0 0 0.9±0.6 0.21 0.0001±0.000 0.0105 0.006 0.097
15 0 0 0 10.9±2.2 8.75 0.0323±0.005 0.0221 0.569 0.394
16 0 0 0 6.6±2.5 8.75 0.0239±0.004 0.0221 0.390 0.394
17 0 0 +1.5 8.8±1.2 8.18 0.0419±0.003 0.0461 0.618 0.645
18 0 +1.5 0 7.9±1.0 9.22 0.0001±0.000 0.0160 0.014 0.209
19 0 0 0 9.1±2.2 8.75 0.0197±0.009 0.0221 0.390 0.394
the influence of yeast extract (p = 0.0133 lineal term, p = 0.0038 quadratic term) and olive oil (p = 0.0209 qua-dratic term) was observed. Sucrose did not have a signifi-cant influence regarding any of the three responses.
It was not surprising that the two variables signifi-cantly affecting biomass production (X1 andX2) in PBD
(Table 3) had equal positive influence when analyzing the combined response in CCD (Table 5). It is well-known that the synthesis of phenolic compounds in most plants, fungi and bacteria happens through the shikimic acid route where they become simple glycolysis-derived carbohydrate pre-cursors, and the pentose shikimic acid pathway which is the precursor for most aromatic compounds in the cell (Mandal
et al., 2010). Such synthesis could thus be promoted by a continuous carbon flow towards the cell (Ryanet al., 2002). Results obtained by some other authors have suggested that increased biomass inG. lucidumis directly related to the production of metabolites such as ganoderic acid and poly-saccharides (Fang and Zhong, 2002; Tang and Zhong, 2002; Tanget al., 2010), such results being similar to those found in this study for EPCs.
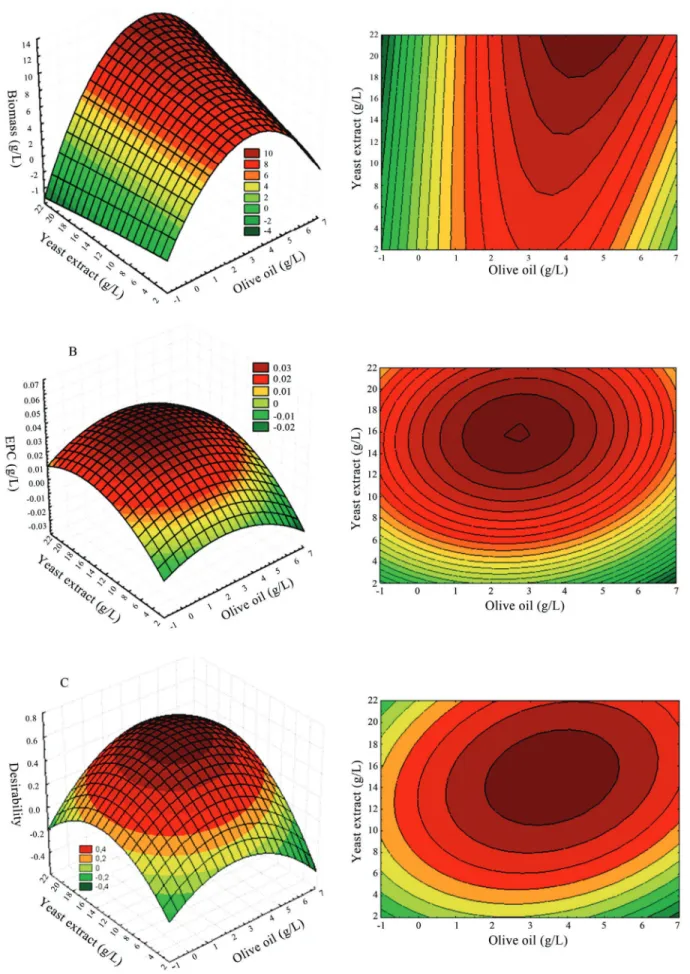
The relationship between both significant variables (X1yX2) and the responses variables can be visualized in
the Figure 1. The surface response curvature reflected the two independent variables’ degree of influence on the de-pendent variables: Biomass (Figure 1A), EPC (Figure 1B) and D (Figure 1C), whilst the third variable (X3) maintained
its central value. Canonic analysis of the regression equa-tion (Eq. (4)) revealed that the optimum concentraequa-tion for the three variables leading to obtaining the maximum D re-sponse was 2.99, 13.29 and 50.00 (g/L) for olive oil (X1),
yeast extract (X2) and sucrose (X3), respectively.
D X X X
X
= - + + -
-0 226 -0 2147 01412 0 0346
0 0283 4 34
1 2 3
1 2
. . . .
. . 29 6 9654
3 8750 19375 7 50
3 2
2 4
3 2
3 1 2
3 1 2
-
--
-+ +
-
-X X
X X X X
.
. . . 0 4
1 3
-X -X
(4)
A validation experiment was carried out using the model’s predicted values, maximum biomass production was 9.35 g/L (the average of three repeats: 0.535 SD) and that for phenolic compounds was 0.0452 g/L(the average for three repeats: 0.0064 SD). Comparatively, the expected desirability index was 0.653 and the experimentally index obtained (using same maximum and minimum values es-tablished for DCC) was 0.662, demonstrating the effective-ness of the method. This value was 100% higher than that obtained in the growth medium usually used in the labora-tory (data not shown), indicating that optimization had been satisfactory.
Biomass and culture medium extract chemical characterization and antifungal activity
Chemical characterization revealed similar metabo-lite patterns for mature fruiting bodies and mycelium ex-tracts, except for coumarins and lactones (Table 6), while terpenoids were only detected in the benzene fraction in culture medium extracts. It is probable that metabolite con-centration in culture medium extracts was too low to be de-tected by TLC staining, but was sufficient to inhibit
Aspergillussp. growth (Table 6). The benzene extracts did not preventAspergillus sp. isolates growth, thereby con-firming G. lucidum bioactive compounds’ polar nature (Ofodileet al., 2005). AnotherG. lucidumpolar compound (ganodermin) has demonstrated mycelia growth inhibition
Table 5- Central composite design variance analysis. The desirability was determined using importance coefficients of 3 and 5 for biomass and EPC,
re-spectively.
Factor Biomass (Y1) EPC (Y2) D (Y3)
P-value Estimated effect P-value Estimated effect P-value Estimated effect
X1 0.0013a 1.92 0.6517 0.007 0.4652 0.112
X2 0.1156 0.72 0.0275a 0.037 0.0133a 0.063
X3 0.7215 0.15 0.0780 0.028 0.1161 -0.113
(X1)2 0.0004a -2.52 0.1397 -0.026 0.0209a -0.156
(X2)2 0.5694 -0.27 0.0148a -0.048 0.0038a 0.070
(X3)2 0.4631 -0.36 0.0582 0.034 0.1194 0.047
X1*X2 0.1360 0.85 0.5641 0.011 0.3316 -0.039
X1*X3 0.8133 0.13 0.7676 -0.005 0.4144 -0.045
X2*X3 0.1512 -0.81 0.8415 0.004 0.3474 0.112
Intercept - 9.87 - 0.18 - 0.51
Model 0.0047a - 0.0457a - 0.0163a
-Lack of fit 0.6644 - 0.0734 - 0.1052
-R2 0.879 - 0.807 - 0.855
-R2(fitted) 0.770 - 0.633 - 0.644
-a
Figure 1- 3D response surface and contours plot, showing interactive effects of olive oil (X1) and yeast extract (X2), sacarose (X3) maintained at 30 g/L.
of phytopathogens such as Botrytis cinerea, Fusarium oxysporumandPhysalospora piricola(Vazet al., 2011).
Medium optimization research for G. lucidum has been focused on polysaccharide and terpenoid synthesis (Changet al., 2006, Fang and Zhong, 2002; Tanget al., 2010), leaving apart other metabolites having diverse bio-logical activity, such as flavonoids and ketones. Such me-tabolites (detected in mature fruiting bodies and mycelium extracts) have been shown to have antifungal activity re-garding clinical fungal isolates (Cushnie and Lamb, 2005; Kocsiset al., 2009).
Conclusion
It has been shown in this study how a culture medium for production biomass and phenolic compounds by using
Ganoderma lucidumwas optimized by using a statistical design strategy combining Plackett-Burman design, central composite design and a desirability function for optimizing both factors simultaneously. Biomass production was ob-tained in the optimized medium which was 100% greater than that obtained in the media usually employed in the lab-oratory and extracts having a biological composition and activity similar to that obtained in fruiting bodies. This showed, once more, that these methods are very useful for optimizing fermentation and, in the specific case of G. lucidum, optimizing processes for producing it and its me-tabolites in submerged culture as a sound alternative to tra-ditional culture.
Acknowledgments
We would like to thank Pontificia Universidad Javeriana for financing this project (ID project 002952).
Abbreviatures
TCA: Trichloroacetic acid. PVPP: Polyvinyl-polypyrrolidone. PBD: Plackett-Burman design. CCD: Central composite design. D: Extra average desirability index. EPC: Extracellular phenolic compounds.
References
Barros L, Dueñas M, Ferreira IC, Baptista P, Santos-Buelga C (2009) Phenolic acids determination by HPLC-DAD-ESI/MS in sixteen different Portuguese wild mushrooms species. Food Chem Toxicol 47:1076-1079.
Chang MY, Tsai GJ, Houng JY (2006) Optimization of the
me-dium composition for the submerged culture ofGanoderma
lucidum by Taguchi array design and steepest ascent method. Enzyme Microbial Technol 38:407-414.
Cliffe S, Fawer M, Maier G, Takata K, Ritter G (1994) Enzyme assays for the phenolic content of natural juices. J Agricult Food Chem 42:1824-1828.
Cushnie T, Lamb AJ (2005) Antimicrobial activity of flavonoids. Int J Antimicrob Ag 26:343-356.
De Souza RA, Batista FS, Gomes FLS (2008) Production of
6-pentyl-a-pyrone byTrichoderma harzianumin solid-state
fermentation. Braz J Microbiol 39:712-717.
Del Signore A, Romeo F, Giaccio M (1997) Content of phenolic substances in basidiomycetes. Mycol Res 101:552-556. Fang QH, Tang YJ, Zhong JJ (2002) Significance of inoculation
density control in production of polysaccharide and
gano-deric acid by submerged culture ofGanoderma lucidum.
Process Biochem 37:1375-1379.
Fang QH, Zhong JJ (2002) Submerged fermentation of higher
fungusGanoderma lucidumfor production of valuable
bio-active metabolites-ganoderic acid and polysaccharide. Biochem Eng J 10:61-65.
Jork H, Funk W, Fischer W, Wimmer H (1990)Thin-layer
chro-matography. Reagents and detection methods. VCH, Weinheim, Federal Republic of Germany.
Kocsis B, Kustos I, Kilár F, Nyul A, Jakus PB, Kerekes S, Villarreal V, Prókai L, Loránd T (2009) Antifungal unsatu-rated cyclic Mannich ketones and amino alcohols: Study of mechanism of action. Eur J Med Chem 44:1823-1829. Lai CY, Hung JT, Lin HH, Yu AL, Chen SH, Tsai YC, Shao LE,
Yang WB, Yu J (2010) Immunomodulatory and adjuvant
activities of a polysaccharide extract ofGanoderma lucidum
in vivo and in vitro. Vaccine 28:4945-4954.
Leskosek-Cukalovic I, Despotovic S, Lakic N, Niksic M, Nedovic
V, Tesevic V (2010)Ganoderma lucidum- Medical
mush-room as a raw material for beer with enhanced functional properties. Food Res Int 43:2262-2269.
Mandal SM, Chakraborty D, Dey S (2010) Phenolic acids act as signaling molecules in plant-microbe symbioses. Plant Sig-naling & Behavior 5:359-368.
Mau JL, Tsai S-Y, Tseng Y-H, Huang S-J (2005) Antioxidant
properties of hot water extracts from Ganoderma tsugae
Murrill. LWT 38:589-597.
Mei-Chun K, Ching-Yi W, Choi-Lan H, Ming-Jiuan W (2006)
Ganoderma lucidummycelia enhance innate immunity by activating NF-kB. J Ethnopharmacol 103:217-222.
Merck (1980)Dyeing reagents for thin layer and paper
chroma-tography. Merck, Darmstadt, Germany.
Muller CI, Kumagai T, O’Kelly J, Seeram NP, Heber D, Koeffler
HP (2006)Ganoderma lucidumcauses apoptosis in
leuke-mia, lymphoma and multiple myeloma cells. Leuk Res 30:841-848.
National Committee for Clinical Laboratory Standards (2003) Method for Antifungal Disk Diffusion Susceptibility Testing of Yeasts: Proposed Guideline M44-P. National Committee for Clinical Laboratory Standard, Wasyne. Ofodile L, Uma N, Kokubun T, Grayer R, Ogundipe O,
Sim-monds M (2005) Antimicrobial activity of some Ganoderma species from Nigeria. Phytotherapy Res 19:310-313. Park J, Kim S, Hwang H, Cho J, Yun J (2002) Stimulatory effect
of plant oils and fatty acids on the exo-biopolymer produc-tion in Cordyceps militaris. Enzyme Microbial Technol 31:250-255.
Plackett R, Burman J (1946) The design of optimum multi-factorial experiments. Biometrika 33:305-325.
Prasad PB, Javed S, Ali M (2010) Production of Angkak through
co-culture of Monascus purpureus and Monascus ruber.
Braz J Microbiol 41:757-764.
Ribeiro B, Lopes R, Andrade PB, Seabra RM, Goncalves RF, Baptista P, Quelhas I, Valentao P (2008) Comparative study of phytochemicals and antioxidant potential of wild edible mushroom caps and stipes. Food Chem 110:47-56. Russell M, Paterson R (2006) Ganoderma - A therapeutic fungal
biofactory. Phytochemistry 67:1985-2001.
Ryan D, Antolovich M, Prenzler P, Robards K, Lavee S (2002)
Biotransformaions of phenolic compounds inOlea europea.
Eur Sci Hortic 92:147-176.
Saltarelli R, Ceccaroli P, Lotti M, Zambonelli A, Buffalini M, Casadei L, Vallorani L, Stocchi V (2009) Biochemical char-acterisation and antioxidant activity of mycelium of
Ganoderma lucidum from Central Italy. Food Chem 116:143-151.
Song T, Yen G (2002) Antioxidant properties of Antrodia
camphorata in submerged culture. J Agricult Food Chem 50:3322-3327.
Sudheesh N, Ajith T, Ramnath V, Janardhanan K (2010)
Thera-peutic potential of Ganoderma lucidum (Fr.) P. Karst.
against the declined antioxidant status in the mitochondria of post-mitotic tissues of aged mice. Clin Nutr 29:406-412. Tang YJ, Zhang W, Liu RS, Zhu LW, Zhong J-J (2010) Scale-up
study on the fed-batch fermentation ofGanoderma lucidum
for the hyperproduction of ganoderic acid and Ganoderma
polysaccharides. Process Biochem
doi:10.1016/j.procbio.2010.08.013.
Tang YJ, Zhong JJ (2002) Fed-batch fermentation ofGanoderma
lucidum for hyperproduction of polysaccharide and gano-deric acid. Enzyme Microbial Technol 31:20-28.
Vaz JA, Barros L, Martins A, Morais JS, Vasconcelos HM, Ferreira IC (2011) Phenolic profile of seventeen Portuguese wild mushrooms. Food Sci Technol 44:343-346.
Wang H (2006) Ganodermin, an antifungal protein from fruiting
bodies of the medicinal mushroom Ganoderma lucidum.
Peptides 44:27-30.
Xuanwei Z, Juan L, Yizhou Y, Jingya Y, Xiaofen S, Kexuan T (2007) Ganodermataceae natural products and their related pharmacological functions. Am J Chin Med 35:559-574. Yang FC, Ke YF, Kuo SS (2000) Effect of fatty acids on the
mycelial growth and polysaccharide formation by
Ganoderma lucidumin shake flask cultures. Enzyme Micro-bial Technol 27:295-301.
Yang F-C, Liau C-B (1998) The influence of environmental
con-ditions on polysaccharide formation byGanoderma lucidum
in submerged cultures. Process Biochem 33:547-553. Zhu LW, Zhong JJ, Tang YJ (2010) Multi-fed batch culture
inte-grated with three-stage light irradiation and multiple addi-tions of copper ions for the hyperproduction of ganoderic acid and Ganoderma polysaccharides by the medicinal
mushroom Ganoderma lucidum. Process Biochem
doi:10.1016/j.procbio.2010.03.010.