http://www.uem.br/acta ISSN printed: 1806-2636 ISSN on-line: 1807-8672
Acta Scientiarum
Doi: 10.4025/actascianimsci.v35i3.19443
Growth curves of Nile tilapia (
Oreochromis niloticus
) strains cultivated
at different temperatures
Vander Bruno dos Santos1*, Edson Assunção Mareco2 and Maeli Dal Pai Silva2
1
Agência Paulista de Tecnologia dos Agronegócios, Cx. Postal 298, 19001-970, Polo Regional Alta Sorocabana, Presidente Prudente, São Paulo,
Brazil. 2Instituto de Biociências, Universidade Estadual Paulista, Botucatu, São Paulo, Brazil. *Author for correspondence. E-mail:
vander@apta.sp.gov.br
ABSTRACT. Growth of Red, GIFT and Supreme Nile tilapia strains were evaluated. Fish were cultivated in indoor recirculation systems in 0.5 m³ tanks with controlled temperatures of 22, 28 and 30°C. Random samples of 20 fish from each strain (10 fish tank-1) were weighed at day 7, 30, 60, 90 and 120. Exponential
model (y=AeKx) and Gompertz model (y = Aexp(-Be-Kx)) were fitted and the estimates parameters were
obtained by Weighted Least Squares. At 22°C, Red, GIFT and Supreme strain presented similar growth and fit of exponential model. GIFT and Supreme strain presented higher growth rate at 30°C of cultivation when compared to Red strain. Temperature influences weight and age at the inflection point. The temperature of cultivation influences the growth description of Red, GIFT and Supreme tilapia strains. It changes the age and weight at inflection point and the qualities of growth model fits, changing the variation of the batch.
Keywords: exponential model, growth rate, supreme, GIFT, red tilapia, weighted model.
Curvas de crescimento de linhagens de tilapias do Nilo (
Oreochromis niloticus
) cultivadas em
diferentes temperaturas
RESUMO. Avaliou-se o crescimento de tilápias das linhagens Vermelha, GIFT e Supreme. Os peixes foram cultivados em sistemas de recirculação em tanques de 0,5 m³ nas temperaturas de 22, 28 e 30°C. Amostras aleatórias de 20 peixes de cada linhagem (10 peixes tanque-1) foram pesadas aos 7, 30, 60, 90 e 120
dias de cultivo. O modelo exponencial (y = AeKx) e o modelo de Gompertz (y = Aexp(-Be-Kx)) foram
ajustados e as estimativas dos parâmetros foram obtidas por Quadrados Mínimos Ponderados. A 22°C o crescimento das linhagens Vermelha, GIFT e Supreme e o ajuste do modelo exponencial foram semelhantes. As linhagens GIFT e Supreme apresentaram maior taxa de crescimento a 30°C quando comparadas à linhagem Vermelha. Pode-se observar influência da temperatura no peso e idade ao ponto de inflexão. A temperatura de cultivo influencia a descrição do crescimento de tilápias das linhagens Vermelha, GIFT e Supreme, alterando a idade e o peso ao ponto de inflexão, a qualidade dos ajustes dos modelos e a uniformidade dos lotes.
Palavras-chave: modelo exponencial, taxa de crescimento, Supreme, GIFT, tilápia vermelha, modelo ponderado.
Introduction
Tilapias are among the most important warm water fishes used for aquaculture production (CHARO-KARISA et al., 2006). The adaptability of tolerance of tilapias to a wide range of environments and intensification of cultivation systems have resulted in a rapid expansion of tilapia farming and introduction of these fish into many subtropical and temperate regions of the world.
Among the wide variety of tilapias, Nile tilapia
(Oreochromis niloticus) is the most common in
aquaculture and the need for a systematic effort to secure and to further improve the genetic quality of farmed stocks is widely recognized (BENTSEN
et al., 1998). The growth of some species of fish has been improved by selection programs and many farmers consider it the main characteristic of performance. Thus, the search for tilapia strains of superior performance is becoming more and more frequent by producers, because of the increasing demands for healthy food, among the world population (SANTOS et al., 2008). This demand has required assessments of these fish cultured in different environments.
Acta Scientiarum. Animal Sciences Maringá, v. 35, n. 3, p. 235-242, July-Sept., 2013
Center, Malaysia. The Supreme strain in Brazil, from Genomar Supreme TilapiaTM strain, is the
continuation of the GIFT breeding program run over a 10-year period, ending in 1998. The two major changes made for Genomar were to apply DNA-fingerprinting as an identification tool and to change to a revolving mating scheme, in order to complete the generation after nine monthly batches. DNA-typing gave several advantages in form of increased selection intensity, shorter generation interval and operational benefits (EL-SAYED, 2006).
Selection for red color in Nile tilapia in some countries has been made because fish consumers prefer the red morph to the common black morph and it was sold at a premium price. A number of red tilapia strain/hybrids has been developed and commercially produced generating high market acceptance for tilapia (EL-SAYED, 2006; MAJUMDAR et al., 1997; NG; HANIM, 2007; RAMÍREZ-PAREDES et al., 2011), but it has showed low production levels in response to their lower growth in comparison with the wild tilapia (MACARANAS et al., 1997; MOREIRA et al., 2005; NG; HANIM, 2007; RAMÍREZ-PAREDES et al., 2011).
Martinez et al. (1996) related that growth of fish is a complex process affected by many abiotic factors and the temperature is recognized as one of the most important. Furthermore, in captivity, the determination of optimal environmental conditions to reach the best growth performance is essential for the maximization and optimization of its production (AZAZA et al., 2008). Effects of water temperature on growth and development of fish have been well documented for many species, but studies have not been done fitting growth curves for Nile tilapia strains cultivated at different temperatures.
In generally the growth curves relate the animal weight with its age. They can be simplest like exponential model or more complexly like Gompertz model both with high useful on aquaculture. The growth rate (g day-1) can be
easily calculated fitting exponential model, using only the initial and final weight during the period of time considered necessary, however it is not recommended for a long period of time (GAMITO, 1998). Growth rate is not constant, but modifies throughout the growth period of the
young until adult fish, and in this case, using the Gompertz model can be more adequate.
Thus, the objective of this study was to evaluate the growth of Nile tilapia (Oreochromis niloticus), of the Red, GIFT and Supreme strains cultivated in different temperatures. A set of weight data in function of the age had been fitted in nonlinear models.
Material and methods
The fish were cultivated in water recirculation system under a greenhouse with internal control of the temperature. The Red, GIFT and Supreme tilapia strains from a monosex male population (fed with 17α -methyltestosterone) were cultivated in three indoor recirculation systems with temperatures about 22 (by use of chillers cooling systems), 28 (ambient temperature, without cooling or heating) and 30°C (by use of heating systems). Seventy fish of each strain, weighing about 1.5 g, were cultivated tanks of 0.5 m³ (in duplicates) in each temperature and were fed with the same commercial ration specific for each growth stage, supplied according to biomass (according to the manufacturer's recommendations) and the water temperature (100% of ration to water at 25-26°C; 80% at 22-24°C, 120% at 27-28°C and 140% at 29-30°C).
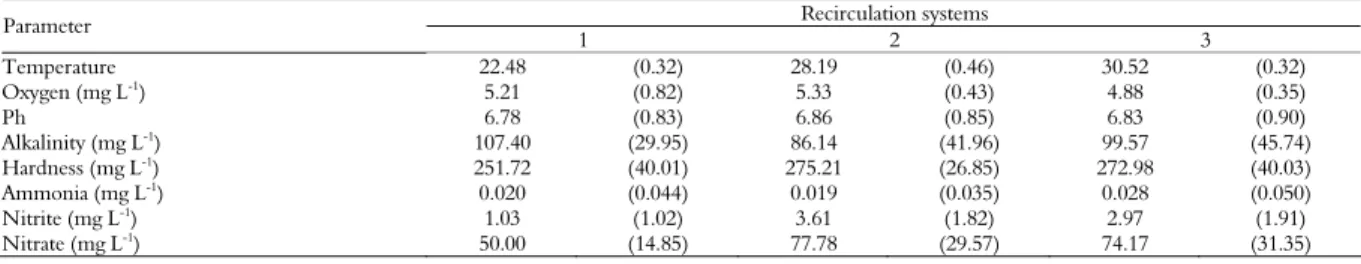
The oxygen and temperature were checked twice daily and pH, alkalinity, hardness, ammonia, nitrite and nitrate were checked weekly. Mean of limnological conditions of temperature, oxygen, pH, alkalinity, hardness from systems are presented in Table 1.
With the animal growth (day 7, 30, 60, 90 and 120), after 24 hour fast, samples of 10 fish of each tank were collected. They were stunned by thermal shock and then sacrificed. Initial and final weights were analyzed by ANOVA considering design as completely randomized in a factorial scheme (three strains and three temperatures of cultivation) and two repetitions (tanks). Results are presented as mean and coefficient of variation (%) and Tukey test was used to verify differences between temperatures and strains (p < 0.05).
Table 1. Mean and standard deviation of limnological parameters of water recirculation systems of tilapia cultivation.
Recirculation systems Parameter
1 2 3
Temperature 22.48 (0.32) 28.19 (0.46) 30.52 (0.32)
Oxygen (mg L-1) 5.21 (0.82) 5.33 (0.43) 4.88 (0.35)
Ph 6.78 (0.83) 6.86 (0.85) 6.83 (0.90)
Alkalinity (mg L-1) 107.40 (29.95) 86.14 (41.96) 99.57 (45.74)
Hardness (mg L-1
) 251.72 (40.01) 275.21 (26.85) 272.98 (40.03)
Ammonia (mg L-1) 0.020 (0.044) 0.019 (0.035) 0.028 (0.050)
Nitrite (mg L-1) 1.03 (1.02) 3.61 (1.82) 2.97 (1.91)
Temperature and tilápia growth 237
The growth study was made by non-linear regression analysis, plotting all data from fish weight. The exponential equation given by y = AeKx
was fit. In this model y represents the observed weight of each fish; A, the initial weight estimate; e, the base of the natural logarithm; K, the specific growth rate; x, the age of each fish. Additionally, the Gompertz growth model given by y = Aexp(-Be-Kx),
was fitted too. In Gompertz model, A is asymptotic value for weight or size at maturity, B is a scaling parameter (constant of integration), K is a function of the ratio of maximum growth rate to mature size or maturing index. In these models the error associated with each observation is N (0, σ²), by assumption.
The first derived of Gompertz function measures absolute (AGR) and relative (RGR) growth rates. AGR and RGR were given by Kyln(u-1) and Kln(u-1), respectively and u = y/A. The
weight and age at inflection points were given by A/e and (lnB)/K, respectively (FITZHUGH JUNIOR, 1976; GAMITO, 1998).
The curve parameters for each strain were compared by their confidence intervals at 95% of probability. The estimates were obtained by Weighted Least Squares (DRAPER; SMITH, 1998) because the variances of the observations are not all equal and according to time increasing, the weight variances increase too (SANTOS et al., 2008). Inverse of weight variance was used as a weighting factor and thus the F-tests and confidence intervals were valid.
Results and discussion
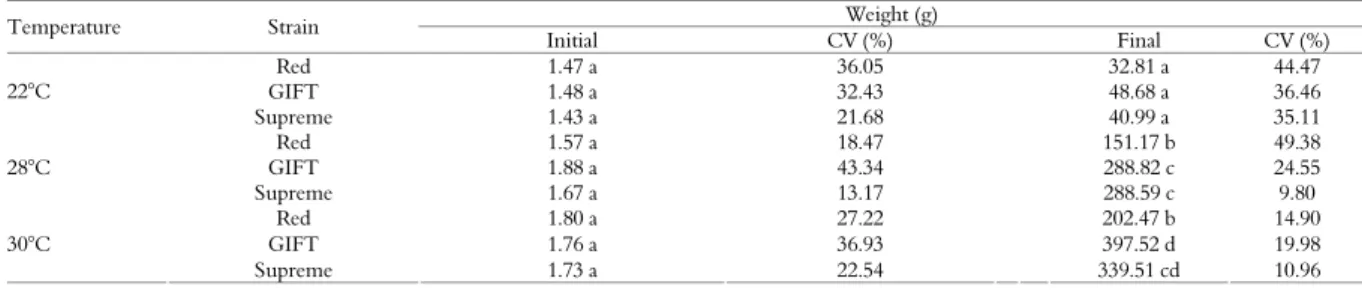
Variance analysis showed influence of temperature on final weight of Red, GIFT and Supreme strains after 120 days of cultivation. Table 2 shows these differences. The estimate parameters of exponential growth model are presented in Table 3.
The estimates of “A” presented differences between GIFT strain at 28°C and Red and GIFT at 22°C, but they were not different from the other ones. In relation to the growth rate “K”, the estimates have indicated differences between strains depending of the temperature of cultivation. GIFT and Supreme strain presented highest growth rate at 30°C of cultivation, and it was the same at the 28°C. Red strain presented lower growth rate than GIFT and Supreme strain at 30°C, and it’s was similar at 28°C when compared to other ones. The lowest growth rate was observed at 22°C of cultivation and difference between tilapia strains was not observed.
Exponential growth curves can be visualized in Figure 1. Exponential model has been fitted to fish weight-age data to describe the growth in some species to determine the growth rate due its simplicity (GAMITO, 1998; LÕHMUS et al., 2010; SANTOS et al., 2008; TAYLOR et al., 2005; VERA CRUZ; BROWN, 2009). It has been used to compare different diet or conditions of cultivation on the fish growth and its growth rate (k) can be calculated only initial (w0) and final weight (wt) in a determinate number of days (t) as k = (ln wt – ln w0)/t. In this case, growth rate is constant, so this model should be used to describe short periods of the fish growth and not total growth.
Table 2. Mean of initial and final weight and coefficient of variation (CV) of tilapia strains cultivated at different temperature.
Weight (g) Temperature Strain
Initial CV (%) Final CV (%)
Red 1.47 a 36.05 32.81 a 44.47
GIFT 1.48 a 32.43 48.68 a 36.46
22°C
Supreme 1.43 a 21.68 40.99 a 35.11
Red 1.57 a 18.47 151.17 b 49.38
GIFT 1.88 a 43.34 288.82 c 24.55
28°C
Supreme 1.67 a 13.17 288.59 c 9.80
Red 1.80 a 27.22 202.47 b 14.90
GIFT 1.76 a 36.93 397.52 d 19.98
30°C
Supreme 1.73 a 22.54 339.51 cd 10.96
Values in the same column with different letters are different by Tukey test (p < 0.05).
Table 3. Estimate parameters and confidence intervals of the exponential growth model to Nile tilapia strains cultivated in different temperature.
Estimate parameters Confidence Intervals A (g) K (g day-1
) Temperature Strain
A (g) K (g day-1)
Lower Upper Lower Upper Red 1.2614 a* 0.0259 a 1.0274 1.4953 0.0234 0.0285 GIFT 1.3191 a 0.0285 a 1.0935 1.5447 0.0263 0.0308 22°C
Supreme 1.4323 ab 0.0284 a 1.2239 1.6406 0.0262 0.0305 Red 1.3791 ab 0.0416 bc 1.0970 1.6611 0.0388 0.0445 GIFT 2.2194 b 0.0390 bc 1.6325 2.8063 0.0363 0.0417 28°C
Supreme 1.4171 ab 0.0419 bc 1.1536 1.6806 0.0400 0.0437 Red 1.7787 ab 0.0374 b 1.2920 2.2654 0.0348 0.0400 GIFT 1.8023 ab 0.0431 c 1.2552 2.3494 0.0402 0.0459 30°C
Supreme 1.5917 ab 0.0419 c 1.2249 1.9585 0.0401 0.0441
Acta Scientiarum. Animal Sciences Maringá, v. 35, n. 3, p. 235-242, July-Sept., 2013
Table 4 presents the estimate parameters of the Gompertz model in weighted least squares, as well as the existing differences between strains. Data of Red and GIFT strain cultivated at 22°C didn’t fit adequately, presenting estimates not applicable and lacking of trustworthiness. It was noticed that Supreme strain presented lower estimate of “A” when cultivated at 22°C and it was similar to Red strain cultivated at 28 or 30°C. GIFT and Supreme strain cultivated at 28 or 30°C presented similar estimated of “A”. The growth rate “K” related at the maturity didn’t present differences on the estimates.
Since that animal growth can be better described by a non-constant growth rate, Gompertz model could be more adequate. Absolute (g day-1) and relative (%) growth rate of
the Supreme strain cultivated at 22°C are presented in Figure 2. At this temperature the weight at the inflection point was 44.91 g and the age at the inflection point was 135.50 days of cultivation and these correspond to maximum value growth of 0.52 g day-1.
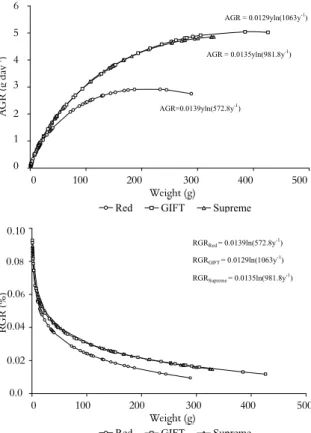
Figure 3 presents the absolute and relative growth rate of Red, GIFT and Supreme strains cultivated at 28°C. At this temperature the weight at the inflection point were 210.72, 391.06 and 361.18 g and the age at inflection point were 134.57, 150.01 and 144.12 days of cultivation to Red, GIFT e Supreme respectively. These points correspond to maximum value growth of 2.93, 5.04 and 4.86 g day-1, respectively.
Figure 4 presents the absolute and relative growth rate of Red, GIFT and Supreme strains cultivated at 30°C. At this temperature the weight at the inflection point was 132.33, 506.83 and 393.08 g and the age at inflection point was 100.10, 146.26 and 140.69 days of cultivation to
Red, GIFT e Supreme respectively. These points correspond to maximum value growth of 2.37, 6.89 and 5.46 g day-1, respectively.
Weig
h
t (g
)
60
50
40
30
20
10
0
y = 1.43e0.0284x
R² Adj.= 0.79
y = 1.32e0.0285x
R² Adj.= 0.75
y = 1.26e0.0259x
R² Adj.= 0.72
0 20 40 60 80 100 120 140
A Supreme GIFT Red Time (days)
Weig
h
t (g
)
400 350 300 250 200 150 100 50 0
y = 1.38e0.0416x
R² Adj. = 0.67 y = 1.42e0.0419x
R² Adj. = 0.83 y = 2.22e0.039x
R² Adj. = 0.78
0 20 40 60 80 100 120 140 B
Supreme GIFT Red Time (days)
Weig
h
t (g
)
500 450 400 350 300 250 200 150 100 50 0
y = 1.78e0.0374x
R² Adj.= 0.77
y = 1.59e0.0419x
R² Adj. = 0.83
y = 1.80e0.0431x
R² Adj. = 0.79
0 20 40 60 80 100 120 140 C
Supreme GIFT Red Time (days)
Figure 1. Exponential growth of Nile tilapia strains in different temperatures of cultivation. A) 22°C. B) 28°C. C) 30°C. Each point represents the mean estimates of twenty fish.
Table 4. Estimate parameters “A” and “K” and confidence intervals of Gompertz growth model of Nile tilapia strains cultivated in different temperatures.
Estimate parameters Confidence intervals
A (g) K (%)
Temperature Strain
A (g)** K (%)**
Lower Upper Lower Upper
Red* --- --- --- --- --- ---
GIFT* --- --- --- --- --- ---
22°C
Supreme 122.1 a 0.0116 a 63.1 348.7 0.0082 0.0153 Red 572.8 ab 0.0139 a 300.9 1335.7 0.0109 0.0173 GIFT 1063.0 b 0.0129 a 589.8 2590.6 0.0099 0.0161 28°C
Supreme 981.8 b 0.0135 a 733.2 1421.8 0.0120 0.0151 Red 359.7 a 0.0179 a 279.5 497.7 0.0151 0.0206 GIFT 1377.7 b 0.0136 a 877.1 2522.4 0.0113 0.0159 30°C
Supreme 1068.5 b 0.0139 a 774.1 1641.1 0.0120 0.0158
Temperature and tilápia growth 239
AGR
(g
da
y
-1)
0.6
0.5
0.4
0.3
0.2 0.1
0
AGR = 0.0116yln(122.1y-1
)
RGR = 0.0116ln(122.1y-1
)
0.06
0.05
0.04
0.03
0.02
0.01
0
RGR
(%
)
0 10 20 30 40 50 60 70
Weight (g)
AGR RGR
Figure 2. Absolute (AGR) and relative (RGR) growth rate of the Supreme strain cultivated at 22°C. Each point represents the estimate of each observation.
AGR
(g
da
y
-1)
6
5
4
3
2
1
0
AGR=0.0139yln(572.8y-1)
AGR = 0.0135yln(981.8y-1)
AGR = 0.0129yln(1063y-1)
0 100 200 300 400 500 Weight g (g) (g)
Red GIFT Supreme
R
G
R
(%
)
0.10
0.08
0.06
0.04
0.02
0.0
RGRRed = 0.0139ln(572.8y-1)
RGRSupreme = 0.0135ln(981.8y -1)
RGRGIFT = 0.0129ln(1063y -1)
0 100 200 300 400 500 Weight g (g) (g)
Red GIFT Supreme
Figure 3. Absolute (AGR) and relative (RGR) growth rate of the Red, GIFT and Supreme strain cultivated at 28°C. Each point represents the estimate of each observation.
Gompertz and von Bertalanffy models are two useful functions and the most appropriated in aquaculture to describe the fish growth (GAMITO, 1998; GÓMEZ et al., 2008; JIMÉNEZ, 2006; KATSANEVAKIS, 2006; KATSANEVAKIS; MARAVELIAS, 2008; LIN; TZENG; 2009) but the major part of these studies has been demonstrating the dynamic population captured and not in fish farms. Moreover these fittings haven’t used Weighted
Least Squares and some mistakes can occur due heteroscedastic variance of the fish weight (SANTOS et al., 2008).
AGR
(g
da
y
-1)
8 7 6
5 4 3 2 1 0
AGR = 0.0136yln(1377.7y-1)
AGR = 0.0139yln(1068.5y-1)
AGR = 0.0179yln(359.7y-1)
0 100 200 300 400 500 600
Weight g (g)(g)
Red GIFT Supreme
RGR
(%
)
0.12
0.10
0.08
0.06
0.04
0.02
0.0
RGRGIFT = 0.0136ln(1377.7y-1)
RGRRed = 0.0179ln(359.7y
-1)
RGRSupreme = 0.0139ln(1068.5y-1)
0 100 200 300 400 500 600
Weight g (g)(g)
Red GIFT Supreme
Figure 4. Absolute (AGR) and relative (RGR) growth rate of the Red, GIFT and Supreme strain cultivated at 30°C. Each point represents the estimate of each observation.
In tilapia farms new strains are available presenting different growth rate, mortality, resistance for environmental conditions, food intake and conversion and fingerlings uniformity. These variables influence the relation weight-age thus, studies of growth fitting growth curves is an important tool to improve the production. Many authors consider temperature the most important variable that influence the fish growth and some studies has been done in relation to tolerance and optimum temperature for tilapia species and strains (ATWOOD et al., 2003; AZAZA et al., 2008; AZAZA et al., 2010; DAN; LITTLE, 2000; EL SAYED, 2006; EL SAYED; KAWANNA, 2008; LIKONGWE et al., 1996; SIFA et al., 2002).
Acta Scientiarum. Animal Sciences Maringá, v. 35, n. 3, p. 235-242, July-Sept., 2013
Sudanese and Egyptian ones. According these authors, this could be related to selection in a tropical country and had not previously been exposed to the selective pressures or the GIFT strain might have been contaminated with O. mossambicus, a species which have poor cold tolerance. Sudanese strain presented the best cold tolerance, it had been introduced into China for several years and has been subjected to cold temperature and some selection response for cold temperature tolerance may have taken place.
GIFT and Supreme strains did not present differences in growth rate (K) considering exponential model (Table 2) at 22, 28 and 30°C of cultivation. Gompertz model showed no differences between these strains at 28 and 30°C, including AGR (g day-1), RGR (%) and these strains presented
same final weight (Table 1). At 22°, Red strain showed similar growth rate and final weight when compared to GIFT and Supreme strains, although its improved program was made to color instead of growth rate. This contradicts the belief that performances of improved animals are better than non-improved ones in any environment. Macaranas et al. (1997) suggest that genotype-environment interactions in O. niloticus strains are low, so that a selected strain good for one environment is likely to perform well in other environments. It is possible that this is not applicable in fish due ectothermic characteristic in the majority of species.
On the other hand Red and GIFT strain presented higher influence of temperature on weight and age at the inflection point. The increase of 2 °C at temperature of cultivation reduces the weight and age at inflexion point on Red strain and increase the weight on GIFT strain. The reduction on Red strain was about 60 g and 30 days and the final weight was similar (Table 2). The increase on the GIFT strain was about 110 g and similar days of cultivation was observed. These differences were not found on Supreme strain.
According to Mamun et al. (2007) the better growth performance of the GIFT tilapia may be due to behavioural factors rather than physiological ones because they could not find any significant differences in the metabolic efficiency between the improved and non-improved Nile tilapia strains. Ng and Hanim, (2007) used a restricted feeding regime study and obliterated differences in feed intake as a variable affecting growth in Nile tilapia strains and showed that the GIFT tilapia was actually more efficient compared with Red tilapia in converting ingested feed into fish body mass.
Likongwe et al. (1996) reported the combined effects of water temperature and salinity on growth and feed utilization of juvenile Nile tilapia. They showed that the growth was greater at 28 and 32°C than at 24°C and salinity levels higher than 8 g L-1
depressed growth. They didn’t find differences in specific growth rate and harvest weight of tilapias in 28 or 32°C. Moreover, in a static environment with salinity close to 16 g L-1 (about half-strength
seawater) combined with elevated water temperature (32°C) may be injurious to the health of juvenile Nile tilapia.
The majority of aquaculture takes place in waters that are not thermoregulated and undergo more or less pronounced daily variations (AZAZA et al., 2010). In captivity, it may be possible to control and maintain optimal rearing temperature according to species requirements (AZAZA et al., 2008). Azaza et al. (2010) demonstrated that the effects of daily thermal fluctuations on the growth of O. niloticus are size dependent: small juveniles grow slightly faster when raised under fluctuating temperatures than under constant temperatures, but strong thermal fluctuations become increasingly unsuitable in fish of increasing size. They also demonstrated that slower growth is accompanied by greater dispersal of size.
Temperature control is essential for optimizing the development of younger stages, as especially the earlier stages of growth are more sensitive to thermal conditions than other stages (AZAZA et al., 2008) and this control can be better in recirculating systems. According to El-Sayed and Kawanna (2008) determination of the best culture practices and optimal environmental conditions in recirculation systems is essential for the maximization of production and profitability. Moreover, temperature is one of the most important factors affecting the physiology, growth, reproduction and metabolism of tilapia, especially in temperate and subtropical regions, which are characterized by seasonal fluctuations in water temperature. These authors rearing tilapia fry in recirculating systems, related that this must be practiced at the optimum water temperature, which is about 28 °C, in order to achieve the best growth, feed conversion and survival, and in turn, the highest profitability.
Temperature and tilápia growth 241
ones (21-24°C), resulting in best growth performance in the fish. In this experiment, they observed maximum growth of O. niloticus at 30°C in relation with maximum feed consumption and better food conversion rate. This temperature value also produced more homogeneous batches indicated by lower coefficients of variation of final body weights. The lower coefficient of variation (CV) of batch reared at 30°C was also observed by Watanabe et al. (1993) on juvenile sex-reversed male Florida red tilapia at 22, 27, and 32°C temperatures with CVs 58.2, 46, and 44.1%, respectively.
In this work, a lower CV of batch also was observed in higher temperatures of cultivation for tilapia strains (Table 1). In this case, tilapia cultivated at 30°C was more homogeneous and Supreme strain presented lower CV at 22, 28 and 30°C of cultivation when compared to Red and GIFT strain. Actually, the higher homogeneity of Supreme strain also can be observed by better fit of exponential and Gompertz curves. First of all, Supreme strain has presented higher adjusted coefficient determination on the fits and only this strain growth was fit to Gompertz model at 22°C.
Conclusion
The temperature of cultivation influences the description growth of Red, GIFT and Supreme tilapia strain. It changes the age and weight at inflection point and the qualities of exponential and Gompertz growth model fits, changing the variation of batch.
Acknowledgements
Financial support for this study was given by São Paulo Research Foundation - FAPESP, SP, in a special program from Young Investigators in Emerging Institutions Grants, Process n° 2008/05984-0.
References
ATWOOD, H. L.; TOMASSO, J. R.; WEBB, H.; GATLIN, D. M. Low-temperature tolerance of Nile tilapia, Oreochromis niloticus; effects of environmental and dietary factors. Aquaculture Research, v. 34, n. 3, p. 241-251, 2003.
AZAZA, M. S.; DHRAÏEF, M. N.; KRAÏEM, M. M. Effects of water temperature on growth and sex ratio of juvenile Nile tilapia Oreochromis niloticus (Linnaeus) reared in geothermal waters in southern Tunisia. Journal of Thermal Biology, v. 33, n. 2, p. 98-105, 2008.
AZAZA, M. S.; LEGENDRE, M.; KRAIEM, M. M.; BARAS, E. Size-dependent effects of daily thermal
fluctuations on the growth and size heterogeneity of Nile tilapia Oreochromis niloticus Journal of Fish Biology, v. 76, n. 3, p. 669-683, 2010.
BENTSEN, H. B.; EKNATH, A. E.; VERA, M. S. P.; DANTING, J. C.; BOLIVAR, H.; REYES, R. A.; DIONISIO, E. E.; LONGALONG, F. M.; CIRCA, A. V.; TAYAMEN, M. M.; GJERD, B. Genetic improvement of farmed tilapias: growth performance in a complete diallel cross experiment with eight strains of Oreochromis niloticus. Aquaculture, v. 160, n. 1-2, p. 145-173, 1998.
CHARO-KARISA, H.; KOMEN, H.; REZK, M.; PONZONI, R. W.; VAN ARENDONK, J. A. M.; BOVENHUIS, H. Heritability estimates and response to selection for growth of Nile tilapia (Oreochromis niloticus) in low-input earthen ponds. Aquaculture, v. 261, n. 2, p. 479-486, 2006.
DAN, N. C.; LITTLE, D. C. Overwintering performance of Nile tilapia Oreochromis niloticus (L.) broodfish and seed at ambient temperatures in northern Vietnam. Aquaculture Research, v. 31, n. 6, p. 485-493, 2000. DRAPER, N. R.; SMITH, H. Applied regression analysis. 3th ed. New York: Wiley, 1998.
SAYED, A.-F. M. Environmental requirements. In: EL-SAYED, A.-F. M. (Ed.). Tilapia Culture. Oxfordshire: CABI Publishing, Wallingford, 2006. p. 34-46.
EL-SAYED, A.-F. M.; KAWANNA, M. Optimum water temperature boosts the growth performance of Nile tilapia (Oreochromis niloticus) fry reared in a recycling system Aquaculture Research, v. 39, n. 6, p. 670-672, 2008. FITZHUGH JUNIOR, H. A. Analysis of growth curves and strategies for altering their shapes. Journal of Animal Science, v. 42, n. 4, p. 1036-1051, 1976.
GAMITO, S. Growth models and their use in ecological modelling: an application to a fish population. Ecological Modelling, v. 113, n. 1-3, p. 83-94, 1998.
GÓMEZ, M. J. L.; PEÑA, M. B.; SALGADO, U. I. H.; ARREDONDO, F. J. L. Age and growth of the tilapia,
Oreochromis niloticus (Perciformes: Cichlidae) from a tropical shallow lake in Mexico. Revista de Biología Tropical (International Journal of Tropical Biology and Conservation), v. 56, n. 2, p. 875-884, 2008.
JIMÉNEZ, B. L. Age-growth models for tilapia
Oreochromis aureus (Perciformes, Cichlidae) of the
Infiernillo reservoir, Mexico and reproductive behaviour. Revista de Biología Tropical, v. 54, n. 2, p. 577-588, 2006.
KATSANEVAKIS, S. Modelling fish growth: Model selection, multi-model inference and model selection uncertainty. Fisheries Research, v. 81, n. 2-3, p. 229-235, 2006.
KATSANEVAKIS, S.; MARAVELIAS, C. D. Modelling fish growth: multi-model inference as a better alternative to a priori using von Bertalanffy equation. Fish and Fisheries, v. 9, n. 2, p. 178-187, 2008.
Acta Scientiarum. Animal Sciences Maringá, v. 35, n. 3, p. 235-242, July-Sept., 2013 utilization of juvenile Nile tilapia Oreochromis niloticus
(Linneaus). Aquaculture, v. 146, n. 1-2, p. 37-46, 1996. LIN, Y. J.; TZENG, W. N. Modelling the growth of Japanese eel Anguilla japonica in the lower reach of the Kao-Ping River, southern Taiwan: an information theory approach. Journal of Fish Biology, v. 75, n. 1, p. 100-12, 2009. LÕHMUS, M.; SUNDSTRÖM, L. F.; BJÖRKLUND, M.; DEVLIN, R. H. Genotype-Temperature interaction in the regulation of development, growth, and morphometrics in wild-type, and growth-hormone transgenic coho salmon. PLoS One, v. 5, n. 4. p. 1-11. 2010.
MACARANAS, J. M.; MATHER, P. B.; LAL, S. N.; VEREIVALU, T.; LAGIBALAVUB, M.; CAPRA, M. F. Genotype and environment: A comparative evaluation of four tilapia stocks in Fiji. Aquaculture, v. 150, n. 1-2, p. 11-24, 1997.
MAJUMDAR, K. C.; NASARUDDIN, K.; RAVINDER, K. Pink body colour in Tilapia shows single gene inheritance. Aquaculture Research, v. 28, n. 8, p. 581-589, 1997.
MAMUN, S. M.; FOCKEN, U.; BECKER, K. Comparison of metabolic rates and feed nutrient digestibility in conventional, genetically improved (GIFT) and genetically male (GMNT) Nile tilapia, Oreochromis
niloticus (L.). Comparative Biochemistry and
Physiology Part A: Molecular and Integrative Physiology, v. 148, n. 1, p. 214-222, 2007.
MARTINEZ, C. A. P.; CRISTINA, C. S.; ROSS, L. G. The effects of water temperature on food intake, growth and body composition of Cichlasoma urophthalmus (Güter) juveniles. Aquaculture Research, v. 27, n. 6, p. 455-461, 1996. MOREIRA, A. A.; MOREIRA, H. L. M.; HILSDORF, A. W. S. Comparative growth performance of two Nile tilapia (Chitralada and Red-Stirling), their crosses and the Israeli tetra hybrid ND-56. Aquaculture Research, v. 36, n. 11, p. 1049-1055, 2005.
NG, W.-K.; HANIM, R. Performance of genetically improved Nile tilapia compared with red hybrid tilapia fed diets containing two protein levels. Aquaculture Research, v. 38, n. 9, p. 965-972, 2007.
RAMÍREZ-PAREDES, J. G.; GARDUÑO-LUGO, M.; MUÑOZ-CÓRDOVA, G. Productive performance of a new synthetic red tilapia population ‘Pargo-UNAM’ compared with that of wildtype Nile tilapia (Oreochromis niloticus L.). Aquaculture Research, v. 43, n. 6, p. 870-878, 2011.
SANTOS, V. B.; YOSHIHARA, E.; FREITAS, R. T. F.; REIS NETO, R. V. Exponential growth model of Nile tilapia (Oreochromis niloticus) strains considering heteroscedastic variance. Aquaculture, v. 274, n. 1, p. 96-100, 2008.
SIFA, L.; CHENHONG, L.; DEY, M.; GAGALAC, F.; DUNHAM, R. Cold tolerance of three strains of Nile tilapia, Oreochromis niloticus, in China. Aquaculture, v. 213, n. 1-4, p. 123-129, 2002.
TAYLOR, J. F.; MIGAUD, H.; PORTER, M. J. R.; BROMAGE, N. R. Photoperiod influences growth rate and plasma insulin-like growth factor-I levels in juvenile rainbow trout, Oncorhynchus mykiss. General and Comparative Endocrinology, v. 142, n. 1-2, p. 169-185, 2005.
VERA CRUZ, E. M.; BROWN, C. L. Influence of the photoperiod on growth rate and insulin-like growth factor-I gene expression in Nile tilapia Oreochromis niloticus. Journal of Fish Biology, v. 75, n. 1, p. 130-141, 2009. WATANABE, W. O.; ERNST, D. H.; CHASAR, M. P.; WICHLUND, R. I.; OLLA, B. L. The effects of temperature and salinity on growth and feed utilization of juvenile, sex-reversed male Florida red tilapia cultured in a recirculating system. Aquaculture, v. 112, n. 4, p. 309-320, 1993.
Received on December 14, 2012. Accepted on 22 January, 2013.