Edgar Vladimiro Mantilla Carrasco1, Amanda Rocha Teixeira2
(received: June 11, 2010; accepted: March 30, 2012)
aBstRaCt: Awareness has been on the rise on the part of society about the importance of wooden structures, in particular historic buildings. This concern is reflected in continued maintenance of historic heritage and has been increasingly leading professionals working in the field of wooden structures to seek improved techniques for inspection of such structures. Methods involving nondestructive testing (NDT) are the most recommended for inspection, as they do not affect the relevant architecture and thus help maintain the integrity and originality of the building. Among the various existing NDT methods, a widespread and promising option is the ultrasound technique. This work introduces a methodology for inspection of wooden structural elements using ultrasonic pulses. The methodology was applied to a glued laminated timber beam with signs of decay on its interior. Ultrasound results helped map the damaged areas of the beam on a plane by using isochromatic patterns. The contribution of this work is a methodology to help investigate wood pathologies which, in combination with other complementary techniques, will allow more accurate and reliable evaluations of wooden structures, avoiding unnecessary replacement of sound structural elements mistakenly presumed to be damaged, or else ensuring maintenance of extremely deteriorated elements that would otherwise compromise the overall stability of the structure.
Key words: Wooden structures, ultrasound, nondestructive testing, phytosanitary evaluation.
MetodologIa paRa a Inspeção de patologIas na MadeIRa poR MeIo de pUlsos UltRassônICos
RESUMO: Atualmente, há uma maior conscientização, por parte da sociedade, da importância das construções em madeira, principalmente as históricas. Essa preocupação se reflete na manutenção desse patrimônio e faz com que cada vez mais profissionais da área de estruturas de madeira busquem melhores técnicas para inspecionar as edificações. Os ensaios não-destrutivos (ENDs) são os mais indicados para essa inspeção, pois não proporcionam qualquer interferência na arquitetura, mantendo, assim, a integridade e a originalidade da obra. Entre os diversos ENDs existentes, uma das opções mais difundidas e promissoras é a técnica do ultrassom. Este trabalho apresenta uma metodologia para inspeção de elementos estruturais de madeira utilizando pulsos ultrassônicos. A metodologia foi aplicada em uma viga de madeira laminada colada com degradações no seu interior. Com os resultados do ultrassom, foi possível mapear, no plano, por meio de isocromáticas, as áreas degradadas da viga. A contribuição deste trabalho é a metodologia para investigação de patologias na madeira que aliada a outras técnicas complementares possibilitará uma avaliação mais precisa e confiável de estruturas de madeira, evitando a troca desnecessária de elementos estruturais sadios, supostamente deteriorados ou mesmo a manutenção de elementos extremamente deteriorados que poderiam comprometer a estabilidade global da estrutura.
Palavras-chave:Estruturas de madeira, ultrassom, ensaios não-destrutivos, avaliação fitossanitária.
1Civil Engineer, Professor PhD in Structural Engineering – Universidade Federal de Minas Gerais/UFMG – Departamento de Engenharia de Estruturas/DEES – 31270-901 – Belo Horizonte, MG, Brasil – [email protected]
2Civil Engineer, MSc in Structural Engineering – Universidade Federal de Minas Gerais/UFMG – Departamento de Engenharia de Estruturas/DEES – 31270-901 – Belo Horizonte, MG, Brasil – [email protected]
1 IntRodUCtIon
Awareness has been on the rise on the part of society about the importance of wooden structures, in particular historic buildings. This concern is reflected in continued maintenance of historic heritage and has been increasingly leading professionals in the field of wooden structures to seek improved techniques for inspection of such structures. In Brazil, a country strongly influenced by European architecture and engineering, there is a large number of building structures made of wood, including
churches, farmhouses, bridges and housing complexes, some of which dating back to the Brazilian colonial and imperial times (Figures 1 and 2). Consequently, continued inspection is of vital importance in order to ensure proper maintenance of such structures.
have no influence on their use. Among the various existing NDT methods, one widespread and promising option is the ultrasound technique.
According to Emerson et al. (2002), ultrasonic pulses can help evaluate the decomposition state of structural elements of wooden bridges affected by wood-destroying fungi. These researchers introduced a methodology whereby ultrasonic pulses are emitted at each mapping point of the structural elements and, after
analyzing velocity, they identified exact locations of decay, categorizing their size. The wood pieces were then cut open and the internal condition was visually compared with velocity values of pulse propagation obtained by the ultrasound.
Teles (2002) proposed a methodology aimed at exploring ultrasound as a tool to monitor degradation of the mechanical properties of wood by termites. Specimens were exposed to dry wood termites in order to induce various deterioration stages and to measure ultrasonic properties. These specimens were subjected to compression parallel to the fibers, for determination of the breaking stress and modulus of elasticity. Correlations were established between ultrasound readings and the mechanical wood properties. The weight loss found after 40 days of exposure to termites did not significantly affect the mechanical properties of the wood sample, preventing identification of correlations between mechanical properties and ultrasonic pulse velocity.
Bucur (2005) and Sandoz (1996) discussed ultrasound techniques for inspection and detection of defective areas on the inner part of trees, ultimately looking to assess tree integrity in public gardens and parks.
Emerson et al. (2001) used perforated laminates simulating defective wood in order to perform ultrasound testing on a glued laminated timber beam, by mapping the wood piece. Results allowed the authors to zone the perforated area.
Figure 1 – (a) Picture of an old bridge; (b) picture of a wooden structure. Figura 1 – (a) Vista de uma ponte antiga; (b) vista de uma estrutura em madeira.
Figure 2 – Headquarters of a historic estate from the Brazilian
imperial times.
Figura 2 – Edificação da sede de uma fazenda histórica do período imperial brasileiro.
Other procedures using ultrasound for analysis of the properties and sanitary integrity of wood materials are also proposed in the works of Ballarin and Nogueira (2005), Feio (2005), Fuller, Ross and Dramm (1994), Shaji, Somayaji and Mathews (2000) and Wilcox (1988).
The method being proposed here helps detect and evaluate internal defects in a wood beam through use of plane mapping and isochromatic patterns to show potentially attacked areas.
This study aimed to present a methodology for inspection, by means of ultrasonic pulses, of conventional and historic wooden structures attacked by wood-destroying organisms.
2 MateRIal and MetHods 2.1 site, equipment and materials used
Tests were conducted at the nondestructive testing laboratory (LEND) of the advanced research center for furniture, wood and materials (CPAM3), engineering college of the federal university of Minas Gerais, in Belo Horizonte, Minas Gerais.
Materials used in the experiment included a glued laminated timber beam from species Eucalyptus grandis (Figure 3), a James Mark II ultrasound device with a pair of ultrasonic pulse transducers acting as the emitter and the receiver, at a 500 kHz frequency (Figure 4).
The selection of a glued laminated timber beam was based on the fact that the piece not only had largely intact areas that allowed measurement of a reference time but also areas with presence of cracks, holes and galleries (caused by insects) of various shapes and sizes. The beam was intentionally manufactured with these internal defects.
The recommended transducer frequency in this experiment is 500 kHz as it is sensitive to small openings (galleries made by termites or borers) and cracks on the interior of the wood piece. Detection of holes and cracks was done in the direction of the pulse path. This detection is directly related to the wavelength of the pulse in the laminate where propagation time is being measured. The longer pulse propagation time is, the lower the velocity and, consequently, the shorter the wavelength will be. Detection is only possible if dimension ‘a’ of the hole or crack follows a a ≥ λ ratio, where λ is wavelength. 2.2 Methodology used for determination of defects
The methodology introduced here is an adaptation of the methodology developed by Emerson et al. (2001, 2002) and consisted primarily in determining the dimensions and
Figure 3 – Dimensions of the glued laminated timber beam. Figura 3 – Viga de madeira laminada colada e suas dimensões.
Figure 4 – Ultrasound device (a) and transducers (b). Figura 4 – Aparelho de ultrassom (a) e transdutores (b).
visually inspecting the outside of the wood piece, which enabled locate points potentially attacked or defective with cracks, fissures or knots. As regards the inner part of the beam, although laminates were known to be defective, the exact location of the defects was unknown, as the laminates had been glued at random when manufactured.
(a)
(b) 95.8
15
The reference time of pulse propagation was measured. This measurement refers to reference time in sound areas of the beam, and is given as the average time value from five distinct, randomly selected points along the laminate.
The reference values of propagation time allowed determination of the reference velocity and average wavelength of the ultrasonic pulse, in each laminate, helping estimate the minimum size of defects detectable by the pulse through its path.
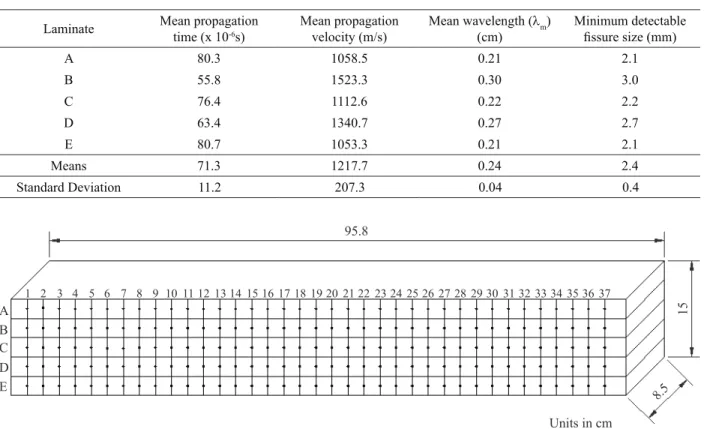
Table 1 lists reference propagation time, reference propagation velocity, wavelength and smallest detectable fissures on each laminate of the beam. Results provided in Table 1 refer to mean values found in each laminate.
After measuring the reference propagation time, an inspection grid was designed on the beam (Figure 5). A square grid was considered whose edge corresponded to approximately 10λm, or ten mean wavelengths, adopting
the value 2.5 cm to facilitate the marking of grid points. The drawing of a grid pattern is critical as it is through this pattern that ultrasonic pulses are measured. The more refined it is, the better the characterization of the attacked area.
The measurement of pulse propagation times was made according to the grid pattern. In some points, the measured propagation times diverged from the mean reference time, requiring a refinement of the grid around such points for assessing the surroundings. Grid refinement should always be done whenever a given point (or points) exceeds considerably the mean reference time, that way ensuring a more accurate assessment of the area.
Two grid patterns were drawn on the beam for inspection. The first was drawn evenly across the beam and the second only covered supposedly degraded areas.
The first pattern consisted of a preliminary grid, intended only to spot potentially degraded areas.
Figure 5 – Schematic representation of the first grid pattern.
Figura 5 – Representação esquemática do primeiro traçado.
table 1 – Reference time and determination of pulse propagation velocity, wavelength and minimum detectable fissure size.
Tabela 1 – Medição de referência do tempo e determinação da velocidade de propagação do pulso, do comprimento de onda e da dimensão mínima da fissura detectável.
Laminate Mean propagation time (x 10-6s)
Mean propagation velocity (m/s)
Mean wavelength (lm) (cm)
Minimum detectable fissure size (mm)
A 80.3 1058.5 0.21 2.1
B 55.8 1523.3 0.30 3.0
C 76.4 1112.6 0.22 2.2
D 63.4 1340.7 0.27 2.7
E 80.7 1053.3 0.21 2.1
Means 71.3 1217.7 0.24 2.4
Standard Deviation 11.2 207.3 0.04 0.4
95.8
15
8.5
Units in cm A
B
C
D
E
Measurements were taken every 2.5 cm (≈10λm) starting on one side of the beam, in all five laminates, as illustrated in Figure 5. Then, propagation times of ultrasonic pulses were measured in all points of the grid pattern.
The second grid pattern was based on the results of the first. Propagation times of pulses obtained with the first grid were compared with reference times of each laminate. Whenever pulse time readings from the first grid pattern exceeded reference time values, the area was considered one with high potential of degradation. The second grid pattern covered only such areas, as seen in Figures 6 and 7. Figures 8, 9 and 10 illustrate such areas in greater detail.
Finally, data was transferred to SigmaPlot® software in order to develop isochromatic patterns of time readings, identifying and highlighting potentially attacked areas.
Figure 6 – Actual representation of the second grid.
Figura 6 – Representação real da segunda malha.
Figure 7 – Schematic representation of the second grid.
Figura 7 – Representação esquemática da segunda malha.
Figure 8 – Area 1 in detail.
Figura 8 – Detalhamento da região 1.
95.8
15
8.5
Units in cm 1
3 ResUlts and dIsCUssIon
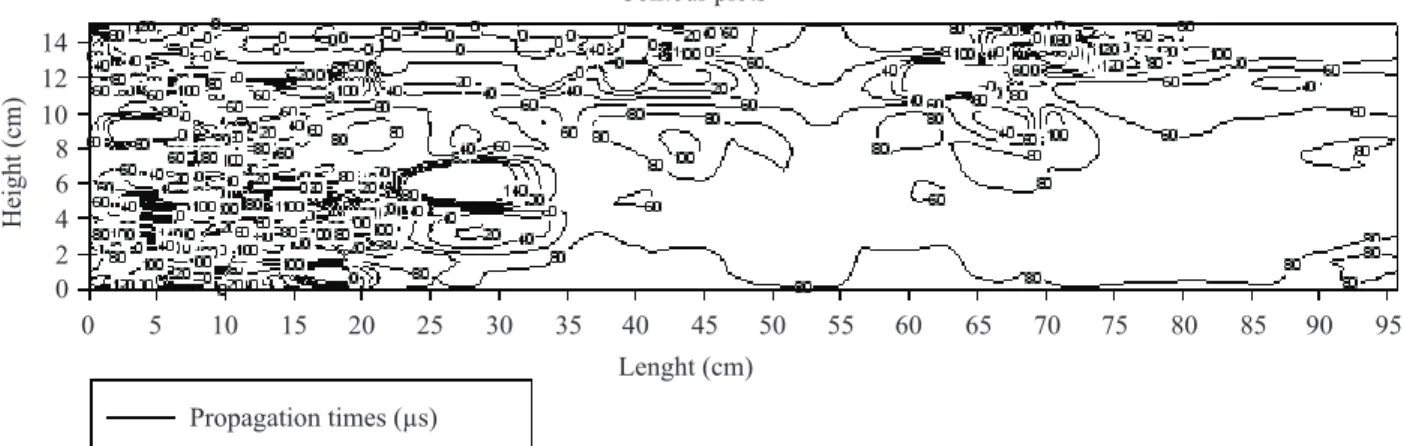
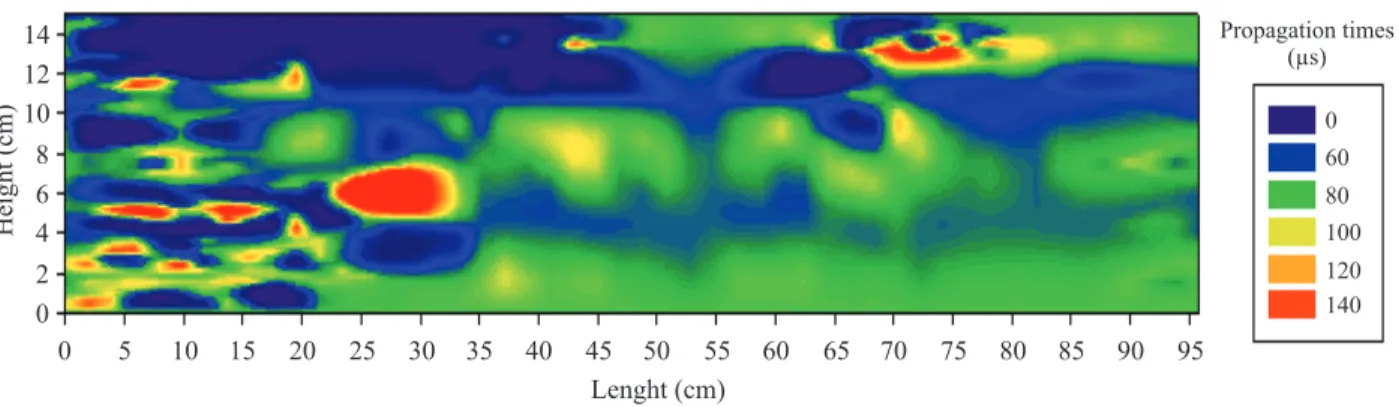
With the propagation time readings obtained from the second grid, curves were generated, using SigmaPlot® version 10, to represent areas with same propagation times, as seen in Figure 11. This software allowed converting these curves into isochromatic patterns for better viewing of the areas considered degraded (Figure 12).
The legend in Figure 12 indicates propagation times, in ms, required for a pulse to travel from one side of the beam to the other.
A 0 m s value in propagation time can be related to pulse reflection, possibly indicating an obstacle along the path preventing the pulse from passing . And given that the ‘acoustic impedance’ between the interfaces of wood and holes/fissures is substantial (a >> λ ), the ultrasonic energy is reflected on this interface (hole/wood) and thus fails to reach the receiver transducer positioned on the opposite side of the emitter transducer. These holes or fissures can be highly indicative of defects, including attack by wood-destroying insects Where v alues ranged from 60 μs to 80 μs, the wood piece was considered sound , that is, free from insect attack, holes or fissures, a fact confirmed by visual inspection.
Values above 100 ms, according to reference propagation times, suggest occurrence of attenuation
Figure 11 – Contour plots indicating areas with same propagation times.
Figura 11 – Contornos indicando regiões de mesmos tempos de propagação. Figure 9 – Area 2 in detail.
Figura 9 – Detalhamento da região 2.
Figure 10 – Area 3 in detail.
Figura 10 – Detalhamento da região 3.
Contour plots
Lenght (cm)
Height (cm)
14 12 10 8 6 4 2 0
0 5 10 15 20 25 30 35 40 45 50 55 60 65 70 75 80 85 90 95
caused by fungi or by pulse diffraction due to presence of fissures and cracks, often resulting from the very nature of the wood in question. Whenever a pulse deviates from empty space, the propagation time increases.
Based on visual inspection, it was possible to observe that the areas outlined by the second grid pattern were indeed damaged, with small cracks, crevices and insect galleries.
4 ConClUsIons
Experimental results demonstrated that the methodology presented here provide satisfactory results for identification of areas with high potential of deterioration in wooden structures.
This study will enable a more accurate and reliable evaluation of wooden structures, avoiding unnecessary replacement of sound structural elements mistakenly presumed to be damaged, also ensuring maintenance of extremely deteriorated structural elements that would otherwise significantly compromise the overall stability of the structure.
This work, in combination with other complementary techniques, will help identify deteriorated wooden elements, thereby increasing the reliability and safety of wooden structures, in particular historic buildings.
5 aCknoWledgeMents
The authors wish to thank the National Research Council (CNPq) and the Research Aid Foundation of Minas Gerais State (FAPEMIG) for providing financial support.
6 ReFeRenCes
BALLARIN, A. W.; NOGUEIRA, M. Determinação do módulo de elasticidade da madeira juvenil e adulta de Pinus taeda por ultrassom. engenharia agrícola, Jaboticabal, v. 25, n. 1, p. 19-28, jan./abr. 2005.
BUCUR, V. Ultrasonic inspection for nondestructive testing of standing trees. Ultrasonics, Amsterdam, v. 43, n. 4, p. 237-239, Feb. 2005.
EMERSON, R. N.; POLLOCK, D.; MCLEAN, D.; FRIDLEY, K.; PELLERIN, R.; ROSS, R. Ultrasonic inspection of large bridge timbers. Forest products Journal, Madison, v. 52, n. 9, p. 88-95, Sept. 2002.
EMERSON, R. N.; POLLOCK, D.; MCLEAN, D.; FRIDLEY, K.; ROSS, R.; PELLERIN, R. Ultrasonic inspection of a glued laminated timber fabricated with defects. In: ANNUAL MEETING OF THE TRANSPORTATION RESEARCH BOARD, 90., 2001, Washington. proceedings... Washington, 2001. p. 875-887.
FEIO, A. J. O. Inspection and diagnosis of historical timber structures: NDT correlations and structural behavior. 2005. 135 p. Tese (Doutorado em Engenharia Civil) - Universidade do Minho, Guimarães, 2005.
FULLER, J. J.; ROSS, R. J.; DRAMM, J. R. Honeycomb and surface check detection using ultrasonic
nondestructive evaluation. Madison: USDA, 1994. 6 p. Note FPL-RN-0261.
Figure 12 – Deteriorated areas in the glued laminated beam.
Figura 12 – Localização das deteriorações na viga de MLC.
Filled contour plots
Lenght (cm) Height (cm) 14 12 10 8 6 4 2 0
0 5 10 15 20 25 30 35 40 45 50 55 60 65 70 75 80 85 90 95
SANDOZ, J. L. Structural timber quality assurance using ultrasound. In: INTERNATIONAL WOOD ENGINEERING CONFERENCE, 4., 1996, New Orleans. proceedings.... New Orleans, 1996. v. 3, p. 233-238.
SHAJI, T.; SOMAYAJI, S.; MATHEWS, M. S. Ultrasonic pulse velocity technique for inspection and evaluation of timber. Journal of Materials in Civil engineering, New York, v. 12, n. 2, p. 180-185, May 2000.
TARGA, L. A.; BALLARIN, A. W.; BIAGGIONI, M. A. M. Avaliação do módulo de elasticidade da madeira com uso de
método não-destrutivo de vibração transversal. engenharia agrícola, Jaboticabal, v. 25, n. 2, p. 291-299, maio/ago. 2005.
TELES, C. D. estruturas de madeira: proposta de metodologia de inspeção e correlação da velocidade ultrassônica com o dano por cupins. 2002. 145 p. Dissertação (Mestrado em Engenharia Civil) - Universidade Federal de Santa Catarina, Florianópolis, 2002.