http://www.uem.br/acta ISSN printed: 1679-9275 ISSN on-line: 1807-8621
Doi: 10.4025/actasciagron.v39i3.32612
Identification of QTL underlying agronomic, morphological and
physiological traits in barley under rainfed conditions using SNP
markers
Osvin Arriagada1, Freddy Mora1*, Yerko Quitral2 and Alejandro Del Pozo2
1
Instituto de Ciencias Biológicas, Universidad de Talca, Av. Lircay, s/n, Talca, Chile. 2Centro de Mejoramiento Genético y Fenómica Vegetal, Facultad de Ciencias Agrarias, PIEI Adaptación de la Agricultura al Cambio Climático, Universidad de Talca, Talca, Chile. *Author for correspondence. E-mail: [email protected]
ABSTRACT. Barley (Hordeum vulgare L.) is considered a good genetic model for evaluating mechanisms of drought tolerance, and it is the most important threat to crop production worldwide. This study aimed to identify single-nucleotide polymorphisms (SNPs) associated with agronomic, morphological and physiological traits in a population of 137 recombinant chromosome substitution lines (RCSL) of barley, which were evaluated under rainfed conditions, in Cauquenes, southern Chile (35°58’ S, 72°17’ W). The annual precipitation was 299 mm during the growing season. Fifty-two significant QTLs were detected for the studied traits, which explained between 5% and 13.8% of the phenotypic variation. A genomic region on chromosome 1H (that comprises SNPs 2711-234 and 1923-265) accounted for 13.4% and 13.8%, respectively, of the grain yield variation. In addition, SNPs 8388-578 and 7639-122 on the chromosome 5H had a moderate effect, explaining 12.8% of the plant height variation. Moreover, some SNPs were associated with more than one trait, and clusters of QTLs for yield and related traits were also found. Finally, the QTLs identified in the present study are of particular interest for barley-breeding purposes under rainfed conditions.
Keywords:Hordeum vulgare, mixed model, recombinant chromosome substitution lines, segregation distortion.
Identificação de QTL associados a características agronômicas, morfológicas e fisiológicas
em cevada sob condições de sequeiro, usando marcadores SNP
RESUMO. Cevada (Hordeum vulgare L.) é uma cultura modelo para a avaliação genética dos mecanismos de tolerância à seca; a ameaça mais importante para a produção agrícola a nível mundial. Objetivou-se identificar polimorfismos de nucleotídeo único (SNP) associados a características agronômicas, morfológicas e fisiológicas numa população de 137 linhas recombinantes com substituição cromossômica (RCSL) de cevada, avaliadas sob condições de sequeiro, em Cauquenes, sul do Chile (35°58’ S, 72°17’ O). A precipitação anual foi de 299 mm durante o período vegetativo. Cinquenta e dois QTLs foram encontrados para as características estudadas, explicando entre 5% e 13.8% da variação fenotípica. A região genômica no cromossomo 1H (que compreende os SNPs 2711-234 e 1923-265) foi responsável de ~13% da variação no rendimento de grãos. Além disso, os SNPs 8388-578 e 7639-122 no cromossomo 5H teve um efeito moderado, explicando 12,8% da variação para altura da planta. Além disso, alguns SNPs foram associados com mais de uma característica, e grupos de QTLs para rendimento de grãos e características relacionadas também foram encontrados. Finalmente, os QTLs identificados no presente estudo podem ser de particular interesse para fins de melhoramento de cevada em ambiente de sequeiro.
Palavras-chave: Hordeum vulgare, modelo misto, linhas recombinantes com substituição cromossômica, distorção de segregação.
Introduction
Abiotic stress is the primary cause of crop loss worldwide, reducing average yields for most major crop plants by more than 50% (Bray, Bailey-Serres, & Weretilnyk, 2000). Among the abiotic stresses, drought has a major impact on plant growth and productivity because water is required in all physiological processes, and it is the main medium for transporting nutrients
& Léon, 2012; Ballesta, Mora, Contreras-Soto, Ruiz & Perret, 2015).
Tolerance to drought stress is a complex phenomenon with a number of physio-biochemical processes (e.g., reduction in water loss by increasing stomatal resistance, increase in water uptake by developing large and deep root systems and accumulation of osmolytes) that are activated at different stages of plant development (Rampino, Pataleo, Gerardi, Mita & Perrotta, 2006). The complexity of drought tolerance mechanisms explains the slow progress in yield improvement in drought environments (Cattivelli et al., 2008).
Barley (Hordeum vulgare L.) is the fourth-most cultivated species worldwide, and it is one of the cereal crops that is best adapted to drought (Lakew et al., 2011). In addition, barley (2n = 2x = 14) is considered a good genetic model (Triticeae) for evaluating mechanisms of drought tolerance. This is an annual species with a relatively short life cycle, wide range of adaptability, and high degree of self-fertility, and it has cross compatibility with species within the primary gene pool (Close et al., 2009; Inostroza et al., 2009).
The availability of genetic variability is a pre-requisite for any breeding program; however, the genetic diversity available in cultivated barley is limited due to selection processes that are mainly targeted for a high yield under favorable conditions (Kalladan et al., 2013). Breeders have long recognized the inherent value of wild species for the genetic improvement of important traits in cultivated varieties (Lakew et al., 2011). For barley, the wide ecological range of the wild species (Hordeum vulgare subsp. spontaneum) differs in several environmental conditions, including water availability (Nevo & Chen, 2010). This adaptive genetic diversity indicates the potential of wild barley as a source for drought-tolerance alleles that can be transferred to cultivated varieties, enabling improvements in the drought tolerance and yield under water limited conditions (Tuberosa & Salvi, 2006; Nevo & Chen, 2010). The introgression of genomic segments from wild to cultivated barley has been a useful procedure for increasing the genetic variation of traits that contribute to drought tolerance (Lakew et al., 2011). However, only 40% of wild barley alleles are represented in cultivated barley (Ellis et al., 2000).
Many morphological and physiological traits have been found to be linked to drought tolerance in barley (Araus, Slafer, Royo, & Serret, 2008; Del Pozo et al., 2012), and most of these traits are controlled by a large number of minor genes (Mora et al., 2015). In addition, the grain yield under
water-stressed conditions has been hampered by the low heritability, polygenic control, epistasis and significant genotype by-environment interaction (Piepho, 2000). Given that these traits are quantitatively inherited, the discovery of the quantitative trait locus (QTL) plays a central role in improvement through marker-assisted selection (MAS) (Tuberosa & Salvi, 2006). Moreover, comparisons among QTL studies can reveal chromosome regions and provide guidance for the eventual identification of specific genes that are responsible for quantitative trait variation (Wang et al., 2014). On the other hand, the advent of the single nucleotide polymorphism (SNP) markers has made it possible to develop high-density genetic maps in a wide range of species, including barley (Close et al., 2009). These high-density SNP-based genetic maps are used in QTL mapping for dissecting the genetic architecture of complex traits and for identifying favorable alleles in diverse germplasm (Gyenis et al., 2007).
In barley, advanced mapping populations, such as recombinant chromosome substitution lines (RCSLs), have been developed to facilitate the genetic dissection of complex traits (Matus et al., 2003). As a result, hundreds of QTLs have been mapped that control a variety of morphological and agronomic traits (Gyenis et al., 2007). However, few studies have identified QTLs for drought-related morphological and physiological traits (Mir, Zaman-Allah, Sreenivasulu, Trethowan & Varshney, 2012; Mora et al., 2016). Therefore, this study aims to identify SNP markers associated with thirteen complex traits (agronomic, morphological and physiological) in a population of 137 RCSLs of barley growing under rainfed conditions.
Material and methods
Plant material and field trial
A recombinant chromosome substitution line (RCSL) population was developed using the crossing scheme of Matus et al. (2003). Briefly, an accession of Hordeum vulgare subsp. spontaneum
(Caeserea 26-24 from Israel) was the donor parent, and Hordeum vulgare subsp. vulgare ‘Harrington’ (a North American malting quality standard) was the recurrent parent. The recurrent parent was used as the female and donor as the male to obtain the F1
generation. To develop the RCSL population, the F1
was backcrossed twice with the recurrent parent ‘Harrington’ to produce BC2F1 individuals. These
A total of 137 RCSL were evaluated outdoors in a rainfed environment in Cauquenes, Chile (35°58’ S, 72°17’ W). The annual precipitation was of 299 mm during the growing season 2008-2009. Fertilizer and field management practices recommended for optimum barley production were employed (Inostroza et al., 2009; Del Pozo et al., 2012). The field trial was arranged in a 14×10 alpha-lattice design (‘Harrington’ cultivar was replicated more times for arrangement v = 14×10 = 140).
Phenotyping
The recorded traits were classified into the following three groups: morphological, agronomic and physiological traits. Morphological traits included the peduncle length (PL, in cm), peduncle extrusion (PE, in mm) and spike length without the awns (SL, in cm). The agronomic traits were the plant height (PH, in cm), dry weight in tillering (DWT, in g⋅m-2), biological yield (BY, in g⋅m-2),
hectoliter weight (HW, in gr), harvest index (HI), kernel per spike (KS), thousand kernel weight (TKW, in k) and grain yield (GY, in ton⋅ha-1). The
relative water content (RWT, in %) and interception of photosynthetically active radiation (IPAR) were included in the phenotyping of physiological traits.
DNA isolation and SNP genotyping
For DNA isolation, 200–300 mg of leaf tissue was harvested and genomic DNA was extracted using a Qiagen DNeasy Plant mini kit (QIAGEN Co). DNA samples were sent to the Southern California Genotyping Consortium (SCGC), Illumina BeadLab at the University of California, Los Angeles (http://scgc.genetics.ucla.edu/), and were genotyped with the 1,536-SNP barley BOPA1 set (Close et al., 2009). Genotyping was performed on 137 RCSL samples and their parents using the Illumina GoldenGate BeadArray. The SNP loci were designated by HarvEST:Barley unigene assembly #32 numbers (http://harvest.ucr.edu/). The order of polymorphic markers from BOPA1 was performed using MEGA5 software (Tamura et al., 2011).
QTL detection
Severe segregation distortion of SNP markers against the Mendelian expectation ratio (1:1 ratio for RCSL populations) was observed based on the P values obtained by a Chi-square test. This phenomenon implies that the genetic covariance between genotypes (i.e., genetic relatedness) in the population is not homogeneous, and, therefore, according to Malosetti et al., (2011) a mixed model approach that includes information about the
genetic relatedness between RCSLs genotypes was employed to avoid false positives in the QTL analysis:
=μ+ + +
where is the phenotype of the ith RCSL, μ is a constant, is the SNP genotype of RCSL ith, is the additive allele substitution effect (SNP effect), is the random genetic background effect of RCSL
ith and is a random residual effect. The random effects are assumed to follow a normal distribution with a mean zero and variance-covariance matrix , with = 2 , and is the coefficient of coancestry matrix between RCSLs. Residual effects were assumed to be normally distributed with a mean of zero and variance of .
The Kinship (K-matrix) was estimated with 497 SNP markers in the program TASSEL 5.0 (Bradbury et al., 2007). Marker–trait association was evaluated with the mixed model method described by Malosetti et al. (2011), incorporating the relative kinship matrix as a covariate (K-model) in the software TASSEL 5.0 (Bradbury et al., 2007). Additionally, only for purposes of comparison, a simple model (S-model) that ignores kinship information was performed where the genetic relatedness between lines was represented by the identity matrix. Corrections for multiple testing were performed using the q-value false discovery rate (FDR) package in R software (Storey & Tibshirani, 2003), and an SNP was consequently declared significant at a threshold of q-value ≤ 0.01. The proportion of observed phenotypic variance explained by a QTL was estimated as the coefficient of determination (R2), and the sum of the individual
QTL contributions was calculated as the total phenotypic variance (Rt2) explained by all QTLs for
each trait (Yang et al., 2010).
(1984) the total additive- by-additive interaction effect ( ) may be estimated by:
=12( + ) −
where and denote the means for the
groups of maximal and minimal lines, respectively, and denotes the mean for all lines.
Results and discussion
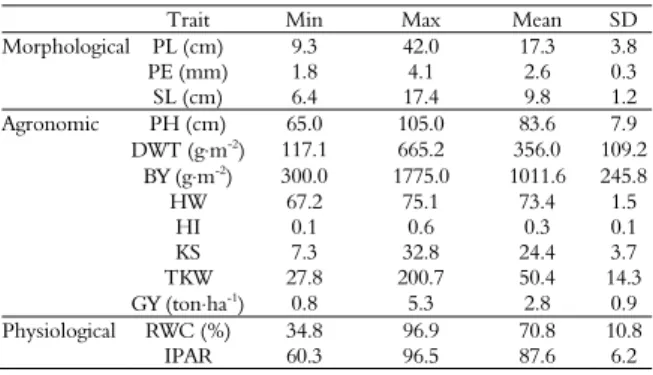
Descriptive statistics for all morphological, agronomic and physiological traits measured in the RCSL population are presented in Table 1. The average plant height was 83.6 cm, with a standard deviation (SD) of 7.9 cm, and the average grain yield (GY) was 2.8 ton⋅ha-1,with an SD of 0.9 during the
studied growing season.
Table 1. Descriptive statistics for all morphological, agronomic and physiological traits measured in an RCSL population of rainfed barley.
Trait Min Max Mean SD
Morphological PL (cm) 9.3 42.0 17.3 3.8
PE (mm) 1.8 4.1 2.6 0.3
SL (cm) 6.4 17.4 9.8 1.2
Agronomic PH (cm) 65.0 105.0 83.6 7.9
DWT (g⋅m-2) 117.1 665.2 356.0 109.2
BY (g⋅m-2) 300.0 1775.0 1011.6 245.8
HW 67.2 75.1 73.4 1.5
HI 0.1 0.6 0.3 0.1
KS 7.3 32.8 24.4 3.7
TKW 27.8 200.7 50.4 14.3
GY (ton⋅ha-1) 0.8 5.3 2.8 0.9
Physiological RWC (%) 34.8 96.9 70.8 10.8
IPAR 60.3 96.5 87.6 6.2
SD: standard deviation.
Of the 1,536 SNPs, 497 markers gave useful genotype information in the RCSL population and were used for subsequent analyses. These markers provided a good coverage of the genome (seven chromosomes) with between 58 and 92 markers (on chromosomes 1H and 2H, respectively). The biggest gaps were detected on top of chromosomes 5H (with ~27 cM). The result of chi-squared (χ2) test (α = 0.05)
showed that all markers deviated from the Mendelian segregation ratios expected in this RCSL population (1:1), which was due probably to selection that operated during the inbreeding process. This result is agreement with the findings of Malosetti et al. (2011), who reported severe allele frequency distortions in many chromosomal regions in an RIL population of barley.
The deviation from the Mendelian segregation ratios implies that the genetic covariance between genotypes (genetic relatedness) in the population is not homogeneous (Malosetti et al., 2011). This
confounding effect has been recognized as one of the major problems in QTL mapping studies given that it can result in spurious associations and, therefore, in a high number of false-positive QTLs (Würschum, 2012). A solution to this problem is to use a mixed model that can accommodate the extra genetic covariance by embedding kinship information in the model, leading to appropriate tests and minimizing the rate of false QTL (Malosetti et al., 2011). This was confirmed in our study, in which a total of 288 QTLs were detected using the simple model (without kinship information); 236 were spurious associations. Moreover, the model that accounts for the heterogeneous genetic relatedness between RCSL lines (K model) was the best model for most of the target traits according to the Bayesian information criterion (BIC). Similar to this study, Kang et al. (2008) and Malosetti et al. (2011) demonstrated that the inclusion of genetic relatedness between individuals in the model resulted in fewer false positives and higher power than the traditional QTL mapping approach.
Most economically important traits in plants are controlled by QTLs, which are known to be affected by many factors, such as populations, environments, molecular markers and QTL mapping methods. However, despite these uncertainties, comparisons among QTL studies can reveal chromosome regions and provide guidance for the eventual identification of specific genes that are responsible for quantitative trait variation (Wang et al., 2014). A total of fifty-two significant QTLs were found for all traits under study, except for the relative water content (RWC). Figure 1 shows Manhattan plots of genome-wide association results for all traits with the presence of QTLs. The proportion of phenotypic variance explained by a single QTL ranged from 5% (SNPs ABC05818-1-2-271 and 4240-749) to 13.8% (SNP 1923-265). For each trait, the total variance explained by significant detected QTLs varied from 6.9 to 84% for SL and IPAR, which are the traits with lower and higher numbers of identified QTLs, respectively. In fact, only one SNP (2726-852) was associated with SL on chromosome 5H at ~288 cM, while twelve QTLs for IPAR were detected on chromosomes 4H(1) and 6H(11).
The number of QTLs detected for each trait, including the chromosome number, proportion of phenotypic variance explained by QTLs and total
additive-by-additive interaction effect, is summarized in Table 2.
Figure 1. Manhattan plots of genome-wide association results for all agronomic, morphological and physiological traits with the presence of QTLs. The x-axis shows the chromosome number and SNP order. The y-axis shows the −Log10(P-value) for each SNP marker.
0 1 2 3 4 PL Chromosome − log 10 ( p )
1H 2H 3H 4H 5H 6H 7H
0.0 0.5 1.0 1.5 2.0 2.5 3.0 PE Chromosome − log 10 ( p )
1H 2H 3H 4H 5H 6H 7H
0.0 0.5 1.0 1.5 2.0 2.5 3.0 SL Chromosome − log 10 ( p )
1H 2H 3H 4H 5H 6H 7H
0.0 0.5 1.0 1.5 2.0 2.5 3.0 PH Chromosome − log 10 ( p )
1H 2H 3H 4H 5H 6H 7H
0.0 0.5 1.0 1.5 2.0 2.5 3.0 DWT Chromosome − log 10 ( p )
1H 2H 3H 4H 5H 6H 7H
0.0 0.5 1.0 1.5 2.0 2.5 3.0 BY Chromosome − log 10 ( p )
1H 2H 3H 4H 5H 6H 7H
0 1 2 3 4 HW Chromosome − lo g10 ( p )
1H 2H 3H 4H 5H 6H 7H
0 1 2 3 4 HI Chromosome − lo g10 ( p )
1H 2H 3H 4H 5H 6H 7H
0.0 0.5 1.0 1.5 2.0 2.5 3.0 KS Chromosome − lo g10 ( p )
1H 2H 3H 4H 5H 6H 7H
0.0 0.5 1.0 1.5 2.0 2.5 3.0 TKW Chromosome − lo g10 ( p )
1H 2H 3H 4H 5H 6H 7H
0 1 2 3 4 5 GY Chromosome − lo g10 ( p )
1H 2H 3H 4H 5H 6H 7H
0 1 2 3 4 IPAR Chromosome − lo g10 ( p )
Table 2. Summary of all marker-trait associations detected in an RCSL population of barley under rainfed conditions
Trait NQTL ChN R2 R
t 2
Morphologic PL 7 1H, 3H, 7H 5.6 - 10.0 49 1.9 PE 3 3H, 4H, 7H 5.0 - 5.6 16 0.2
SL 1 5H 6.9 6.9 0.4
Agronomic PH 3 4H, 5H 5.1 - 7.7 19 0.8
DWT 2 4H 6.3 - 6.6 13 13.8
BY 4 2H, 5H 5.0 - 6.7 23 12.3 HW 3 1H, 5H 7.2 - 11.0 26 35.4 HI 3 1H, 5H 5.8 - 11.0 27 0.02
KS 8 2H 5.1 - 5.7 44 -1.2
TKW 3 2H, 4H 5.2 - 5.7 16 5.2
GY 3 1H 5.8 - 13.8 33 0.2
Physiological RWC 0 - - - -
IPAR 12 4H, 6H 5.1 - 9.4 82 5.4
NQTL: number of significant QTLs; ChN: chromosome number; R2: proportion
of phenotypic variance explained by a single QTL; Rt2: total phenotypic variation
explained by all QTLs detected for each trait under study; : phenotypic estimates
of the total additive-by-additive interaction effect for each trait.
The plant height (PH) and grain yield (GY) are important traits in barley breeding programs, given that an appropriate plant height is a prerequisite for achieving the desired yield (Ren, Sun, Dong, Sun, & Li, 2014). Plant height is a complex trait determined by many genes with small effects (Alheit et al., 2014). Therefore, many QTLs have been mapped on all seven chromosomes using different types of molecular markers, such as SSRs (Inostroza et al., 2009), DArT (Wang et al., 2014) and SNPs (Zhou, Zhang, Zhang, Tan, & Li, 2015). For example, Rode, Ahlemeyer, Friedt and Ordon (2012) associated 25 SNPs with PH on chromosomes 1H, 2H, 3H, 4H and 5H, which explained between 1.5 and 15.4% of the phenotypic variance. Recently, major QTLs for PH have been mapped on chromosomes 3H and 7H, which explained 44.5% and 23.2% of the phenotypic variation, respectively (Wang et al., 2014; Zhou et al., 2015). In the present study, only three markers (SNPs 4773-1009, 8388-578 and 7639-122) were significantly associated with PH on chromosomes 4H and 5H, explaining between 5.1% and 7.7% of the phenotypic variation. However, the genomic region that comprises SNPs 8388-578, and 7639-122 on chromosome 5H at ~196 cM had a considerable effect explaining 12.8% of the plant height variation.
The low number of QTLs detected in our population is in agreement with Wang et al. (2014) because most of the QTLs associated with the plant height explains a small level of phenotypic variation. Additionally, this trait is strongly influenced by the environment, particularly by drought (Baum et al., 2003; Inostroza et al., 2009). Wang et al. (2014), for instance, identified nine
QTLs for plant height; however, most of them had a small allelic effect. On the other hand, Inostroza et al. (2009) reported twelve SSR-trait associations for plant height on chromosomes 1H, 2H, 4H, 5H, 6H, and 7H, and the associations on chromosomes 4H and 5H were significant for the marker main effect.
Grain yield is generally controlled by many genes, which can be dissected into a series of component parts, including the spike number, kernel number, kernel weight and thousand-kernel weight (Wang et al., 2014). In the study performed by Inostroza et al. (2009), twelve markers showed significant associations with the grain yield on chromosomes 1H, 2H, 3H, 5H, 6H and 7H; seven were significant for the marker main effect and five were environment-dependent. Consistently, Wang et al. (2014) found six QTLs were associated with GY on chromosomes 1H, 2H, 3H, 4H, and 7H, which explained between 4.7 and 16.1% of the phenotypic variation; however, these QTLs depended on the environment. In this study, three SNPs were associated with GY on chromosome 1H, representing two genomic regions. Among these, two moderate QTLs were detected in a genomic region at ~140 cM; SNPs 2711-234 and 1923-265 accounted for 13.4 and 13.8% of the grain yield variation, respectively. This result is consistent with the study developed by Kalladan et al. (2013), who found three stable QTLs for yield on chromosome 1H under both control and drought conditions, and explained most of the phenotypic variation for yield.
The thousand kernel weight (TKW) is one of the major yield components with a direct effect on the final yield (Pasam et al., 2012). Studies have shown that QTLs for TKW have a genome-wide distribution (Pasam et al., 2012; Kalladan et al., 2013). However, in the present study, three significant QTLs were associated with TKW on chromosomes 2H and 4H, which explained between 5.2 and 5.7% of the phenotypic variation. This result can be explained by TKW being influenced by the environmental conditions that occur during the grain filling period when the crop is more susceptible to drought (Mengistu et al., 2012). The QTL detected for TKW on chromosome 2H at ~45 cM has been reported on a similar position in other studies (Rode et al., 2012; Kalladan et al., 2013).
co-localization and/or clusters of QTLs for the yield and related traits have been reported well in barley (Comadran et al., 2011; Kalladan et al., 2013; Mansour et al. 2014; Wang et al., 2014). In this study, the genomic region on chromosome 1H at ~140 cM was concomitantly associated with HI and GY, which explained between 21.2 and 27.2% of the phenotypic variation, respectively. Similarly, but on chromosome 2H at 63.5 cM, Comadran et al. (2011) detected a significant QTL for HI and yield in an association panel consisting of 185 accessions of barley. Additionally, the SNP 1923-265 was concomitantly associated with PL, HW and HI, explaining between 7.9% (for PL) and 11% (for HW and HI) of the phenotypic variation, while that for SNP 2711-234 was also associated with HI, accounting for 10.2%. Similarly, SNP 3026-1011 on chromosome 4H at ~5 cM was associated with IPAR and TKW, and SNP 8258-330 on chromosome 5H at ~160 cM was associated with BY and HI, which accounted for 5.3% and 5.8% of the phenotypic variation under rainfed conditions.
The plant water status plays an important role in plant growth, development and yield. Under rainfed conditions, the crop must increase water use efficiency to resist drought, and sustains normal growth (Liu, Sun, Ren, Li, & Sun, 2015). The relative water content (RWC) has been widely used to measure the water status in barley, and various QTLs for RWC on chromosomes 2H, 4H, 5H, 6H and 7H have been detected in different water conditions (Teulat et al., 2003; Fan, Shabala, Ma, Xu, & Zhou, 2015; Liu et al., 2015). In the current study, no QTLs controlling RWC were identified. In contrast, Teulat et al. (2003) identified three QTLs associated with RWC on chromosomes 5H and 6H, which explained between 7.6 and 10.9% of the phenotypic variation under rainfed conditions, and they concluded that the region situated on the long arm of chromosome 6H contains the most-stable QTLs for RWC.
Conclusion
The identification of genomic regions associated with agronomic, morphological and physiological traits in barley under rainfed conditions facilitates the understanding of molecular mechanisms of tolerance to this type of stress. Fifty-two significant QTLs were identified for the traits considered in this study. Among them, two moderate QTLs were detected for GY on chromosome 1H. In addition, the genomic
region that comprises SNPs 8388-578 and 7639-122 on chromosome 5H explained 12.8% of the plant height variation. Given that SNP markers showed a very strong segregation distortion, we emphasize the importance of the inclusion of a confounding effect, such as genetic relatedness in the QTL mapping model, to efficiently control the type I error rate. Finally, the QTLs identified in the present study can be of particular interest for barley-breeding purposes under rainfed conditions.
References
Alheit, K. V., Busemeyer, L., Liu, W., Maurer, H. P., Gowda, M., Hahn, V., ... Würschum, T. (2014). Multiple-line cross QTL mapping for biomass yield and plant height in triticale (× Triticosecale
Wittmack). Theoretical and Applied Genetics, 127(1), 251-260.
Araus, J. L., Slafer, G. A., Royo, C., & Serret, M. D. (2008). Breeding for yield potential and stress adaptation in cereals. Critical Reviews in Plant Science,
27(6), 377-412.
Ballesta, P., Mora, F., Contreras-Soto, R., Ruiz, E., & Perret, S. (2015). Analysis of the genetic diversity of
Eucalyptus cladocalyx (sugar gum) using ISSR markers. Acta Scientiarum. Agronomy, 37(2), 133-140. Baum, M., Grando, S., Backes, G., Jahoor, A., Sabbagh,
A., & Ceccarelli, S. (2003). QTLs for agronomic traits in the Mediterranean environment identified in recombinant inbred lines of the cross' Arta'× H. spontaneum 41-1. Theoretical and Applied Genetics,
107(7), 1215-1225.
Bocianowski, J. (2012a). Analytical and numerical comparisons of two methods of estimation of additive × additive interaction of QTL effects.
Scientia Agricola, 69(4), 240-246.
Bocianowski, J. (2012b). A comparison of two methods to estimate additive-by-additive interaction of QTL effects by a simulation study. Journal of Theoretical Biology, 308(1), 20-24.
Bocianowski, J., & Nowosad, K. (2015). Mixed linear model approaches in mapping QTLs with epistatic effects by a simulation study. Euphytica, 202(3), 459-467.
Bocianowski, J., Krajewski, P., & Kaczmarek, Z. (1999). Comparison of methods of choosing extreme doubled haploid lines for genetic parameter estimation. Colloquium Biometryczne, 29(1), 193-202. Bradbury, P. J., Zhang, Z., Kroon, D. E., Casstevens, T.
M., Ramdoss, Y., & Buckler, E. S. (2007). TASSEL: software for association mapping of complex traits in diverse samples. Bioinformatics, 23(19), 2633-2635. Bray, E.A., Bailey-Serres, J., & Weretilnyk, E. (2000).
Molecular Biology of Plants. (p. 1158-1249). Rockville, MD: American Society of Plant Physiologists. Cattivelli, L., Rizza, F., Badeck, F. W., Mazzucotelli, E.,
Mastrangelo, A. M., Francia, E., & Stanca, A. M. (2008). Drought tolerance improvement in crop plants: an integrated view from breeding to genomics. Field Crops Research, 105(1), 1-14.
Close, T. J., Bhat, P. R., Lonardi, S., Wu, Y., Rostoks, N., Ramsay, L., ... Bozdag, S. (2009). Development and implementation of high-throughput SNP genotyping in barley. BMC Genomics, 10(1). doi: 10.1186/1471-2164-10-582
Comadran, J., Russell, J. R., Booth, A., Pswarayi, A., Ceccarelli, S., Grando, S., ... Benbelkacem, A. (2011). Mixed model association scans of multi-environmental trial data reveal major loci controlling yield and yield related traits in Hordeum vulgare in Mediterranean environments. Theoretical and Applied Genetics, 122(7), 1363-1373.
Del Pozo, A., Castillo, D., Inostroza, L., Matus, I., Méndez, A. M., & Morcuende, R. (2012). Physiological and yield responses of recombinant chromosome substitution lines of barley to terminal drought in a Mediterranean‐type environment. Annals of Applied Biology, 160(2), 157-167.
Ellis, R. P., Forster, B. P., Robinson, D., Handley, L. L., Gordon, D. C., Russell, J. R., & Powell, W. (2000). Wild barley: a source of genes for crop improvement in the 21st century?. Journal of Experimental Botany,
51(342), 9-17.
Fan, Y., Shabala, S., Ma, Y., Xu, R., & Zhou, M. (2015). Using QTL mapping to investigate the relationships between abiotic stress tolerance (drought and salinity) and agronomic and physiological traits. BMC Genomics, 16(1). doi: 10.1186/s12864-015-1243-8
Gyenis, L., Yun, S. J., Smith, K. P., Steffenson, B. J., Bossolini, E., Sanguineti, M. C., & Muehlbauer, G. J. (2007). Genetic architecture of quantitative trait loci associated with morphological and agronomic trait differences in a wild by cultivated barley cross. Genome,
50(8), 714-723.
Inostroza, L., del Pozo, A., Matus, I., Castillo, D., Hayes, P., Machado, S., & Corey, A. (2009). Association mapping of plant height, yield, and yield stability in recombinant chromosome substitution lines (RCSLs) using Hordeum vulgare subsp. spontaneum as a source of donor alleles in a Hordeum vulgare subsp. vulgare
background. Molecular Breeding, 23(3), 365-376. Kalladan, R., Worch, S., Rolletschek, H., Harshavardhan,
V. T., Kuntze, L., Seiler, C., ... Röder, M. S. (2013). Identification of quantitative trait loci contributing to yield and seed quality parameters under terminal drought in barley advanced backcross lines. Molecular Breeding, 32(1), 71-90.
Kang, H. M., Zaitlen, N. A., Wade, C. M., Kirby, A., Heckerman, D., Daly, M. J., & Eskin, E. (2008).
Efficient control of population structure in model organism association mapping. Genetics, 178(3), 1709-1723.
Lace, B., Eglinton, J., Henry, R. J., Baum, M., Grando, S., & Ceccarelli, S. (2011). The potential contribution of wild barley (Hordeum vulgare ssp. spontaneum) germplasm to drought tolerance of cultivated barley (H. vulgare ssp. vulgare). Field Crops Research, 120(1), 161-168.
Liu, L., Sun, G., Ren, X., Li, C., & Sun, D. (2015). Identification of QTL underlying physiological and morphological traits of flag leaf in barley. BMC Genetics, 16(1). doi: 10.1186/s12863-015-0187-y Malosetti, M., van Eeuwijk, F. A., Boer, M. P., Casas, A.
M., Elía, M., Moralejo, M., ... Molina-Cano, J. L. (2011). Gene and QTL detection in a three-way barley cross under selection by a mixed model with kinship information using SNPs. Theoretical and Applied Genetics,
122(8), 1605-1616.
Mansour, E., Casas, A. M., Gracia, M. P., Molina-Cano, J. L., Moralejo, M., Cattivelli, L., ... Igartua, E. (2014). Quantitative trait loci for agronomic traits in an elite barley population for Mediterranean conditions.
Molecular Breeding, 33(2), 249-265.
Matus, I., Corey, A., Filichkin, T., Hayes, P. M., Vales, M. I., Kling, J., ... Waugh, R. (2003). Development and characterization of recombinant chromosome substitution lines (RCSLs) using Hordeum vulgare
subsp. spontaneum as a source of donor alleles in a
Hordeum vulgare subsp. vulgare background. Genome,
46(6), 1010-1023.
Mengistu, N., Baenziger, P. S., Eskridge, K. M., Dweikat, I., Wegulo, S. N., Gill, K. S., & Mujeeb-Kazi, A. (2012). Validation of QTL for grain yield-related traits on wheat chromosome 3A using recombinant inbred chromosome lines. Crop Science, 52(4), 1622-1632. Mir, R. R., Zaman-Allah, M., Sreenivasulu, N.,
Trethowan, R., & Varshney, R. K. (2012). Integrated genomics, physiology and breeding approaches for improving drought tolerance in crops. Theoretical and Applied Genetics, 125(4), 625-645.
Mora, F., Castillo, D., Lado, B., Matus, I., Poland, J., Belzile, F., ... del Pozo, A. (2015). Genome-wide association mapping of agronomic traits and carbon isotope discrimination in a worldwide germplasm collection of spring wheat using SNP markers.
Molecular Breeding, 35(2), 1-12.
Mora, F., Quitral, Y. A., Matus, I., Russell, J., Waugh, R., & del Pozo, A. (2016). SNP-based QTL mapping of 15 complex traits in barley under rain-fed and well-watered conditions by a mixed modeling approach.
Frontiers in Plant Science, 7. doi: 10.3389/fpls.2016.00909 Nevo, E., & Chen, G. (2010). Drought and salt tolerances
in wild relatives for wheat and barley improvement.
Plant, Cell & Environment, 33(4), 670-685.
collection. BMC Plant Biology, 12(1). doi: 10.1186/1471-2229-12-16
Phillips, P. C. (2008). Epistasis the essential role of gene interactions in the structure and evolution of genetic systems. Nature Reviews Genetics, 9(11), 855-867. Piepho, H. P. (2000). A mixed-model approach to
mapping quantitative trait loci in barley on the basis of multiple environment data. Genetics, 156(4), 2043-2050.
Polle, A., Altman, A., & Jiang, X. (2006). Towards genetic engineering for drought tolerance in trees. In M. Fladung, & D. Ewald (Eds.), Tree Transgenesis
(p. 275-297). Heidelberg, DE: Springer Verlag. Rampino, P., Pataleo, S., Gerardi, C., Mita, G., &
Perrotta, C. (2006). Drought stress response in wheat: physiological and molecular analysis of resistant and sensitive genotypes. Plant, Cell & Environment, 29(12), 2143-2152.
Ren, X. F., Sun, D. F., Dong, W. B., Sun, G. L., & Li, C. D. (2014). Molecular detection of QTL controlling plant height components in a doubled haploid barley population. Genetics and Molecular Research,
13(2), 3089-3099.
Rode, J., Ahlemeyer, J., Friedt, W., & Ordon, F. (2012). Identification of marker-trait associations in the German winter barley breeding gene pool (Hordeum vulgare L.). Molecular Breeding, 30(2), 831-843. Sayed, M. A., Schumann, H., Pillen, K., Naz, A. A., &
Léon, J. (2012). AB-QTL analysis reveals new alleles associated to proline accumulation and leaf wilting under drought stress conditions in barley (Hordeum vulgare L.). BMC genetics, 13(1). doi: 10.1186/1471-2156-13-61
Schmit, R., Mora, F., Emhart, V. I., & Rubilar, R. (2015). Longitudinal analysis in the selection of
Eucalyptus globulus clones under contrasting water availability conditions. Scientia Forestalis, 43(105), 217-224.
Storey, J. D., & Tibshirani, R. (2003). Statistical significance for genomewide studies. Proceedings of the National Academy of Sciences, 100(16), 9440-9445.
Surma, M., Adamski, T., & Kaczmarek, Z. (1984). The use of doubled haploid lines for estimation of genetic parameters. Genetica Polonica, 25(1), 27-32. Tamura, K., Peterson, D., Peterson, N., Stecher, G.,
Nei, M., & Kumar, S. (2011). MEGA5: molecular evolutionary genetics analysis using maximum likelihood, evolutionary distance, and maximum parsimony methods. Molecular Biology and Evolution,
28(10), 2731-2739.
Teulat, B., Zoumarou-Wallis, N., Rotter, B., Salem, M. B., Bahri, H., & This, D. (2003). QTL for relative water content in field-grown barley and their stability across Mediterranean environments.
Theoretical and Applied Genetics, 108(1), 181-188. Tuberosa, R., & Salvi, S. (2006). Genomics-based
approaches to improve drought tolerance of crops.
Trends in Plant Science, 11(8), 405-412.
Wang, J., Yang, J., Jia, Q., Zhu, J., Shang, Y., Hua, W., & Zhou, M. (2014). A new QTL for plant height in barley (Hordeum vulgare L.) showing no negative effects on grain yield. PloS One, 9(2), e90144. Würschum, T. (2012). Mapping QTL for agronomic
traits in breeding populations. Theoretical and Applied Genetics, 125(2), 201-210.
Yang, X., Guo, Y., Yan, J., Zhang, J., Song, T., Rocheford, T., & Li, J. (2010). Major and minor QTL and epistasis contribute to fatty acid compositions and oil concentration in high-oil maize. Theoretical and Applied Genetics, 120(3), 665-678.
Zhou, G., Zhang, Q., Zhang, X. Q., Tan, C., & Li, C. (2015). Construction of high-density genetic map in barley through restriction-site associated DNA sequencing. PloS One, 10(7), e0133161.
Received on July 7, 2016. Accepted on October 26, 2016.