Article
J. Braz. Chem. Soc., Vol. 27, No. 1, 62-69, 2016. Printed in Brazil - ©2016 Sociedade Brasileira de Química 0103 - 5053 $6.00+0.00
A
*e-mail: [email protected]
Application of Multivariate Analysis to Assess the Incorporation of Omega-3 Fatty
Acid in Gluten-Free Cakes
Aline K. Gohara,a Aloisio H. P. Souza,a,b Eliza M. Rotta,c Gisely L. Stroher,d Sandra T. M. Gomes,c
Jesui V. Visentainer,a,c Nilson E. Souzac,e and Makoto Matsushita*,a,c
aCentro de Ciências Agrárias, Universidade Estadual de Maringá,
Av. Colombo, 5790, 87020-900 Maringá-PR, Brazil
bInstituto Federal de Mato Grosso do Sul, Rua Salime Tanure, s/n, 79400-000 Coxim-MS, Brazil
cDepartamento de Química, Universidade Estadual de Maringá,
Av. Colombo, 5790, 87020-900 Maringá-PR, Brazil
dDepartamento de Química, Universidade Tecnológica Federal do Paraná,
Av. Marcilio Dias, 635, 86812-460 Apucarana-PR, Brazil
eDepartamento de Química, Universidade Tecnológica Federal do Paraná,
Av. Pioneiros, 3131, 86036-370 Londrina-PR, Brazil
A complete 22 experimental planning (two factors at two levels) with central point in quintuplicate was used to investigate the influence of the factors: chia and azuki flours on fatty acids composition of gluten-free chocolate cake. Both factors were significant, but chia flour presented greater influence on the results. Increased values of both factors contributed to improve contents of polyunsaturated fatty acids (380.96 g kg-1 of product), mainly n-3 series (70.25 g kg-1 of product), and provided more adequate nutritional indices. The principal component analysis and desirability function indicated the sample with higher level of both factors as the optimal region. This sample showed an increase in contents of alpha-linolenic acid (188.03%) and polyunsaturated fatty acids (18.16%) when compared to control formulation. The addition of chia flour can improve nutritional characteristics of food stuffs such as bakery products, especially their lipid composition.
Keywords: Salvia hispanica L., alpha-linolenic, response surface methodology, principal
components analysis, desirability function
Introduction
Mankind has suffered lots of changes in all fields of life, such as education and job, and it has a deep reflection in eating habits. People search for products that do not need much time to prepare before eating. However, most of these foods are made of poor ingredients and they cannot offer essential nutrients for human body. In this context, food industries started developing enriched products using potential ingredients with nutritional properties.1-3
The bakery products are the most consumed by population due to their practicality and good sensory acceptance. After bread, the cakes ready for consumption
are considered the preferred products in this category.4
Nowadays, there are gluten free versions of these foods and they can be consumed by celiac patients, however, almost all of these products are totally made of rice flour, which is composed basically only of carbohydrates.5
On the other hand, there are several kinds of potential ingredients which may be used to replace rice flour in gluten-free products, such as azuki and chia. Azuki (Vigna angularis) is a legume widely produced in Asia and generally used to make some kinds of sweets appreciated by Asiatic people.6 Chia (Salvia hispanica, L.)
is an angiosperm plant from the mint family (Lamiaceae) characterized as a grain from tropical and subtropical climate, widely consumed in pre-Columbian America by the Aztecs, in the region that includes Mexico and Guatemala.7 Both grains, azuki and chia, are considered
Zanqui et al.,8 chia presents high levels of total lipids, and
the lipid fraction of this grain is considered a great source of polyunsaturated fatty acids, especially alpha-linolenic acid (LNA, 18:3n-3), and other lipophilic compounds such as tocopherols and phytosterols. According to Ratnayake and Galli,9 LNA is considered essential because it cannot
be metabolized by the human body and must be consumed through the diet.
Factorial design is an important chemometric tool which enables evaluating the contribution of each specific ingredient to several characteristics of the final product, using a smaller number of experiments, simultaneous analysis of many variables and their effects, reliability of the results, performance of the research in stages, an interactive process of inclusion of tests to the model, main variables selection, presentation of the process through mathematical models, and conclusions from qualitative results.10 Multivariate analysis enables extracting additional
information when compared to the univariate analysis. The principal components analysis (PCA) allows the pattern recognition, the gathering of information, reduction of data dimensionality and also the organization of data into a simpler structure, easier to understand. This analysis is based on performing linear comparisons of the original variables. The principal components (PC) are orthogonal among each other and the explained variance decreases with increased PC number.11
This study aimed at applying chemometric methods to investigate the influence of the factors: percentages of chia and azuki flour, added in gluten-free chocolate cake for the determination of fatty acid composition and nutritional aspects.
Experimental
Sampling
The grains of azuki used in this study were cultivated in the region of Maringá-PR and purchased at the local market. Approximately 6 kg of grains were ground in a hammer mill to obtain homogeneous flour that was sieved using a 20-mesh sieve. Chia flour (Salvia hispanica, L.) used in this research was partially defatted, it is a
byproduct of the cold-pressing process for lipid extraction. This ingredient was provided by the company Giroil Agroindústria Ltda. (Santo Angelo, Rio Grande do Sul, Brazil). The other ingredients were obtained in retail stores in Maringá.
Experimental design
A complete 22 experimental planning (two factors
at two levels) with central point in quintuplicate was used to investigate the influence of both factors on the fatty acids composition of chocolate cake. The factors were: concentrations of azuki and chia flour, as shown in Table 1. The total of 100% of flour for each formulation was achieved with rice flour addition. The responses analyzed in this study were: sums of fatty acids from n-3 series, polyunsaturated fatty acids (PUFA), ratio of polyunsaturated by saturated fatty acids (PUFA / SFA), atherogenicity (IA) and thrombogenicity indices (IT) of fatty acids. A control cake (100% rice flour) was produced to be compared to experimental optimum point. The cakes were processed according to the recommendations of Gohara et al.12
Formulation processing
All the ingredients were previously weighed individually. The rice flour, azuki and chia, at the respective percentage for each formulation, were mixed to obtain a homogeneous
fraction (288.00 g kg-1 of the whole formulation); and
egg white (87.00 g kg-1) was mixed to form a solid phase.
The egg yolk (58.00 g kg-1), butter (58.00 g kg-1) and
sugar (169.00 g kg-1) were homogenized in a bowl to
form a cream. The mixture of flours, chocolate powder (80.00 g kg-1), cocoa powder (38.00 g kg-1), egg white,
water (190.80 g kg-1), milk powder (21.20 g kg-1) and baking
powder (10.00 g kg-1) were added slowly to the cream to
form a homogeneous mass. The cake mass was transferred to a rectangular baking dish and baked in a conventional oven for 30 min at 200 °C, with subsequent cooling to room temperature (25 °C). The sequence of ingredients mixture and temperature conditions described above followed the process performed in previous study.13
Table 1. Factors and levels investigated in the experimental design for the development of a 22 full factorial design
Factor Unit Symbol Type
Level
–1 0 1
Chia flour g Kg-1 C numeric 100 150 200
Total lipid extraction
The total lipids were extracted according to Bligh
and Dyer,14 using a mixture of the solvents: methanol,
chloroform and water (final proportion 2:2:1.8, v/v/v).
Fatty acid composition
The first step to determine the fatty acid composition was the conversion of the lipids into fatty acid methyl
esters (FAME), according to Hartman and Lago.15 The
FAME were separated using a CP-3380 gas chromatograph (Varian, Walnut Creek, USA) fitted with a flame ionization detector and a CP 7420-select FAME fused-silica capillary column (100 m × 0.25 mm × 0.25 µm, cyanopropyl). The
carrier gas was hydrogen at 1.4 mL min-1, the make-up
gases were nitrogen at 30 mL min-1 and synthetic air
at 300 mL min-1, and the flame gas was hydrogen at
30 mL min-1. The sample was injected in a split ratio of
1:100. The injector and detector temperatures were 235 °C. The column temperature was maintained at 165 °C for 4 min, increased to 185 °C at 4 °C min-1 and maintained for 5 min,
and then increased from 185 to 225 ºC at 10 °C min-1 and
maintained for 10 min. The retention times were compared with those of standard methyl esters (Sigma, St. Louis, USA). The fatty acids were quantified using tricosanoic acid methyl ester (Sigma) as an internal standard.16 The peak areas were
determined with Star 5.0 software (Sigma, Santa Clara,
USA). According to Joseph and Ackman16 (equation 1),
correction factors of FAME for flame ionization detectors in individual fatty acids (FA) were used and their concentrations expressed in mg FA per kg-1 of food:
x
A × MpX ×FCT
M
A × M × FP A CEA
= (1)
where Mx: X fatty acid mass in mg g-1 of sample; Mp:
internal standard mass in milligrams; MA: sample mass
in g; AX: X fatty acid area; Ap: internal standard area; FCT:
theoretical correction factor; FCEA: methyl ester correction
factor to fatty acid.
The limits of detection (LOD) and quantification (LOQ) were estimated by triplicate analysis of diluted methyl
arachidate standard solution (1.0 mg mL-1), considering
the signal-noise ratio relative to the background signal as 3 and 10, respectively.17
Nutritional quality indices of lipid fraction
The atherogenicity index (IA) and thrombogenicity index (IT) were determined as IA = [(12:0 + (4 × 14:0) +
16:0)] / (MUFA + n-6 + n-3); and IT = (14:0 + 16:0 + 18:0) / [(0.5 × MUFA) + (0.5 × n-6) + (3 × n-3) + (n-3 / n-6)], according to Ulbricht and Southgate.18
Statistical analysis
All the analyses were done in triplicate. Fatty acid composition was demonstrated by the general average of the experiments repetitions (A: test 1; B: test 2; C: test 3; D: test 4 and E: tests 5, 6, 7, 8 and 9). Initially, the values of effects, interaction, and analysis of variance (ANOVA) were obtained. Afterwards, the whole variables had their normal and homogeneity of variance assessed through the combings. Then, the ANOVA among the groups was done for all the responses. Considering the independent variables effect on the responses, the response surface methodology was applied. The basic mathematic model used to adjust the data was (equation 2):
Ŷi= b0 + b1 x1 + b2 x2 (2)
where Ŷi is the expected response; b0 is the constant term;
b1 and b2 are the terms of the regression model and x1 and
x2 are the levels of the independent variables.19
The model’s equations were arranged to a global response using a desirability function. The results obtained for the sums of fatty acids from n-3 series, polyunsaturated fatty acids, ratio of polyunsaturated by saturated fatty acids, atherogenicity and thrombogenicity indices were used to estimate the global response. This procedure involved a transformation of each response (Ŷi) estimated for an individual value of desirability (di), in which 0 ≤di≤ 1, according to Derringer and Suich.20
If the objective or target T to the response Ŷi is a maximum value, then the equation 3 should be used:
> ≤ ≤ − − < = T Y T Y L L T L Y L Y d i i r i i i ˆ 1 ˆ ˆ ˆ 0 (3)
If the objective or target to the response Ŷiis a minimum value then the equation 4 should be used:
where L and U are minimum and maximum limits, respectively.
The convenience function is linear when the weight ‘r’ is equal to 1. If r > 1 there is more emphasis on targeting the closest value. Using 0 < r < 1 makes this less important.
Individual values of desirability (di) were arranged through a geometric average to form a global desirability value (D), which will attend to satisfy all response simultaneously. This single value of D [0,1] gives a global assessment of convenience and the arranged response levels, and D will increase at the same time that the properties balance becomes more favorable.
PCA consisted of the sums of fatty acids from n-3 series, PUFA, PUFA / SFA, IA and IT of fatty acids - loadings. For this analysis, the average values of the five different formulations (A: test 1; B: test 2; C: test 3; D: test 4; E: tests 5, 6, 7, 8 and 9) were used - scores. Averages were autoscaled, so that the whole variables showed the same weight. In this way, PCA bidimensional graphics were obtained.
The formulation considered the best one by desirability assay was compared to the control cake. The Student’s
t-test was applied to analyze differences between the two different samples. All the statistical analyses were done using the software Statistica, version 8.0,21 adopting the
5% significance level for rejection of the null hypothesis (p < 0.05).
Results and Discussion
The total lipids contents for samples A, B, C, D, E and control were 73.50, 76.64, 75.57, 77.65, 76.43 and 59.50 g kg-1, respectively, according to previous study.12
This research showed that enriched gluten free cake presented good sensory acceptance, as well as great
contents of nutrients, such as protein and lipids, mainly the formulation with higher contents of chia flour.12 Another
previous study showed the great levels of essential minerals in all the formulations of cake, the minerals were Ca, Cu, Fe, K, Mg, Mn and Zn. The highest mineral contents were found in the formulations with the highest concentration of both flour (chia and azuki).13 In this present study, similar
results were found for essential fatty acids, as shown below. Under the selected operation system, LOD and LOQ
were estimated at 0.15 and 0.50 mg g-1 of total lipids,
respectively.
Gas chromatography allowed identifying and quantifying eighteen fatty acids and the major ones were: palmitic acid (16:0), stearic acid (18:0), oleic acid (18:1n-9), linoleic acid (18:2n-6) and alpha-linolenic acid (LNA, 18:3n-3). All the formulations, mainly formulation with higher contents of chia, showed the prevalence of polyunsaturated fatty acids, which are involved with the smaller risk of cardiovascular diseases.9
LNA presented the highest content value in all the formulations. This fatty acid plays important roles in metabolic processes. Through desaturases and elongases enzymes, LNA can be converted into other eicosanoid fatty acids from n-3 series (omega-3), such as eicosapentaenoic acid (EPA, 20:5n-3) and docosahexaenoic (DHA, 22:5n-3), which are very important for human health due to their anti-inflammatory properties.22,23
These results were similar to those found for food products enriched with omega-3 using flaxseed grain, such as panettone,24 granola,25 food bars26 and cookies.27
Table 2 presents the conditions of the complete 22
factorial model with central point in quintuplicate, applied to the tests, as well as the values obtained for the sums, ratio, and nutritional indices of fatty acids.
Table 2. Complete 22 design, the obtained responses to the sums, ratios and fatty acids indices
Test Independent variable
a Sums and ratios of fatty acids / (mg FA g-1 TL)
x1 x2 n-3b PUFAb PUFA / SFAb IA IT
1 –1 –1 45.83 343.55 1.06 0.47 0.66
2 –1 1 48.50 354.88 1.17 0.45 0.61
3 1 –1 67.31 366.41 1.24 0.43 0.54
4 1 1 70.25 380.96 1.35 0.39 0.49
5 0 0 59.04 367.78 1.26 0.41 0.55
6 0 0 58.30 353.71 1.13 0.44 0.62
7 0 0 57.16 349.23 1.10 0.45 0.63
8 0 0 57.18 350.18 1.11 0.45 0.63
9 0 0 59.55 363.68 1.22 0.41 0.57
aExpressed according to Table 1; bmg fatty acid per g-1 of total lipid. x
1: chia flour; x2: azuki flour; n-3: total omega-3 fatty acids; PUFA: total of polyunsaturated
The regression coefficients for each one of the models, their confidence intervals and coefficients of determination
(R2) of the responses applied to the response surface
methodology are presented in the Table 3. Values close to 1 indicate a good correlation between experimental and predicted data.28 Pagamunici et al.29 found coefficients of
determination of 0.85 for instrumental data vs. sensory
analysis as a function of time, and the models were well fitted. In this study, the values were greater than 0.60, which means that the linear model explained more than 60% of the data variability. The residual plots for each response showed normality, and homogeneity of variance was explained satisfactorily.
The limits of confidence intervals for the first-order term (x2) for the sum of polyunsaturated fatty acids, PUFA / SFA
ratio, IA and IT showed values with opposite signs (Table 3). All the values are possibly within a confidence interval, therefore it is possible that this value is zero. This fact demonstrates that there was a linear correlation between the variables, so there is no statistical evidence to keep this term in the model. Nevertheless, its permanence was preferred to preserve the mathematical hierarchy.10
The effect values can be obtained by regression coefficients values (effects are twice the coefficients). Data from Table 3 show that the main effects of the two
factors (chia and azuki) were positive for fatty acids from n-3 series, PUFA and the PUFA / SFA ratio, and they were negative for IA and IT. These data enable us to estimate that greater concentration of chia and azuki may increase contents of n-3 series fatty acids and PUFA. This increase was also found for hamburgers in studies performed by Souza et al.30 All the experimental models did not present
interaction effects for the responses analyzed and were removed.
Tables 4 and 5 show the results obtained by ANOVA for each factor studied in the model response. The factor chia most influenced the increased levels of fatty acids from n-3 series, PUFA and PUFA / SFA, with contributions of 99.43, 54.78 and 47.83%, respectively (Table 4).
The values of F-test (Table 5) demonstrate the significance of coefficients of regression and lack of fit. According to data from Table 4, the lack of fit of the model was not significant for the models.
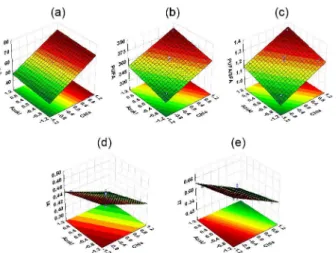
The effects may be better observed in the response surface models (Figure 1). Surfaces of n-3 series fatty acids, PUFA and PUFA / SFA ratio clearly show the positive effect caused by increasing the factors, mainly the factor chia. On the other hand, surfaces of IA and IT show a negative effect. These nutritional indices are associated with the presence of lauric (12:0), myristic (14:0), palmitic (16:0) Table 3. Regression coefficients, confidence intervals and coefficients of determination of the responses applied to the response surface methodology
Parameter n-3 PUFA PUFA / SFA IA IT
Mean 58.13 358.93 1.18 0.43 0.59
(57.393, 58.858)a (351.208, 366.653)a (1.129, 1.232)a (0.419, 0.447)a (0.563, 0.617)a
x1
10.81 12.23 0.09 –0.03 –0.06
(9.709, 11.905)a (0.650, 23.819)a (0.014, 0.167)a (–0.046, –0.003)a (–0.112, –0.008)a
x2
1.40 6.47 0.06 –0.02 –0.06
(0.303, 2.500)a (–5.116, 18,053)a (–0.021, 0.133)a (–0.036, 0.006) (–0.064, 0.017)a
R2 0.990 0.701 0.657 0.654 0.707
aConfidence interval for 95% level. n-3: total fatty acids from omega-3 series; PUFA: total polyunsaturated fatty acids; SFA: total of saturated fatty acids;
IA: index of atherogenicity; IT: index of thrombogenicity; x1: chia flour; x2: azuki flour; R2: coefficient of determination.
Table 4. Results of ANOVA, sum of squares of the responses obtained in full 22 factorial design with central point
Source Sum of squares
DF n-3 PUFA PUFA / SFA IA IT
x1 1 467.169 598.727 0.033 0.002 0.014
x2 1 7.853 167.364 0.013 0.001 0.002
Lack of fit 2 0.181 48.346 0.004 0.000 0.001
Pure error 4 4.655 278.524 0.020 0.002 0.006
Total SS 8 469.859 1092.961 0.069 0.005 0.023
and stearic (18:0) fatty acids which are more related to the increased incidence of coronary diseases when compared to monounsaturated fatty acids, especially oleic (18:1n-9) and the series omega 3 and 6. Souza et al.31 and Silva et al.32
found low values of IA and IT for sacha inchi nut and perilla oil, respectively, emphasizing the direct correlation between the lowest ratio and an attenuated risk of coronary disease.
Figure 2 presents PCA. The principal components 1 and 2 (PC1 and PC2) were selected due to their statistical significance (p < 0.05). PC1 explained 55.51% of data variance, and loadings indicated a positive contribution of the contents of n-3 series fatty acids (0.9012), total PUFA (0.9865) and PUFA / SFA ratio (0.9724), which characterized samples C and D (formulations with higher contents of chia). A negative contribution of IA (–0.9377) and IT (–0.9866) was observed on PC1, which characterized formulations A and B (formulations with lower contents of chia).
PC2 was responsible for 17.11% of the data variance, and there was the separation of sample E on the upper region of the graph, which involves the 5 replicates of the central point (tests 5, 6, 7, 8 and 9). These formulations
present the intermediate values for n-3 series fatty acids, PUFA and PUFA / SFA ratio. Increased PUFA and n-3 in the cake formulations are associated with the high contents of alpha-linolenic fatty acid in the chia.8
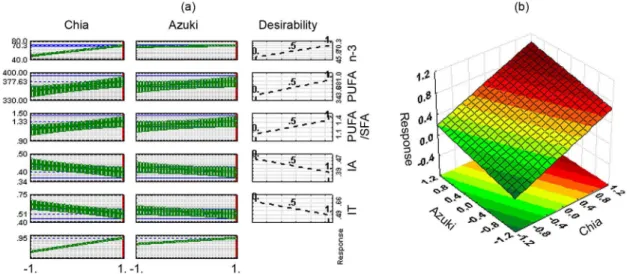
Figure 3 shows the desirability function for the following constrictions: maximum value of fatty acids from n-3 series, total PUFA and PUFA / SFA ratio (equation 3); and minimum value of IA and IT indices (equation 4). The highest levels of chia and azuki flours were described as a point of major desirability (test 4). The higher concentrations of the factors studied were determinant for greater composition of fatty acid, such as higher contents of PUFA and fatty acids from n-3 series. The nutrient with the greatest increase was the alpha-linolenic fatty acid whose content in test 4 was 153.28% bigger than in test 1, corroborating with results found by Souza et al.30
According to the Institute of Medicine,33 the contribution
of alpha-linolenic fatty acid to the dietary reference intakes were determined for adults (1.6 g day-1), using a portion
of 60 g of cake (equivalent to one slice). The values were 12.63, 13.94, 19.07, 20.46 and 16.70%, for formulations A, B, C, D and E, respectively. The greatest contribution was Table 5. Results of ANOVA and F-test of the responses obtained in full 22 factorial design with central point
Source F-test
DF n-3 PUFA PUFA / SFA IA IT
x1 1 579.584 10.990 8.304 7.436 12.003
x2 1 9.742 3.072 3.176 2.694 1.948
Lack of fit 2 0.078 0.347 0.370 0.070 0.462
Pure error 4 – – – – –
DF: degree of freedom; n-3: total fatty acids from omega-3 series; PUFA: total polyunsaturated fatty acids; SFA: total of saturated fatty acids; IA: index of atherogenicity; IT: index of thrombogenicity; x1: chia flour; x2: azuki flour.
Figure 2. Principal components analysis for complete 22 experimental
design with central point in quintuplicate. PC: principal component; A: test 1; B: test 2; C: test 3; D: test 4; E: tests 5, 6, 7, 8 and 9; n-3: sum of fatty acid from omega-3 series; PUFA: polyunsaturated fatty acids; SFA; total saturated fatty acids; IA: atherogenicity index; IT: thrombogenicity index.
Figure 1. Response surfaces to sum, proportion and indices of fatty
presented by formulation D, which has the highest level of both factors chia and azuki flour.
Table 6 shows fatty acid composition of optimum experimental point by desirability function (formulation D) and of control product. Both samples presented the same fatty acids, however, there were some significant differences in contents of butyric acid (4:0), capric acid (10:0), lauric acid (12:0), heptadecanoic acid (17:0), oleic acid (18:1n-9), linoleic acid (18:2n-6) and arachidic acid (20:0). The main difference was observed for alpha-linolenic acid, which increased 188.03% in optimum formulation when compared to control cake. As a result, PUFA contents also showed an increase in the optimum formulation (18.16%). Furthermore, atherogenicity index and thrombogenicity index showed lower values for optimum point when compared to control cake (21.57% IA and 41.18% IT, respectively).
Conclusions
Chemometric methods were very useful for improvement of fatty acids composition of gluten-free chocolate cake. Factor chia flour presented higher contribution for increasing n-3 series and polyunsaturated fatty acids, as well as nutritional indices. The models analyzed were significant and allowed obtaining the response surfaces. Principal components analyses distinguished samples with higher contents of chia flour. The formulation with higher contents of chia and azuki flour was considered as a point of greatest desirability. This formulation presented higher levels of n-3 fatty acid and PUFA, and lower indices of atherogenicity and trombogenicity than control cake. The addition of grains with high nutritional value is a great
Figure 3. (a) Conditions of restrictions and responses of the desirability function for complete 22 experimental design with central point in quintuplicate. n-3:
sum of fatty acid from omega-3 series; PUFA: polyunsaturated fatty acids; SFA; total saturated fatty acids; IA: atherogenicity index; IT: thrombogenicity index; (b) response surface for the optimum region using the application of desirability functions.
Table 6. Fatty acid quantification and t-test for comparison between optimum experimental point and control cake
Fatty acid
Composition / (mg kg-1 of product)
p-Value Optimum
experimental point Control
4:0 6.61 ± 0.17 4.94 ± 0.81 0.0515 6:0 1.52 ± 0.07 1.12 ± 0.11 0.0413 8:0 1.38 ± 0.06 1.06 ± 0.06 0.0139 10:0 2.53 ± 0.26 2.49 ± 0.13 0.8192 12:0 3.57 ± 0.40 3.71 ± 0.14 0.5734 14:0 22.88 ± 2.81 30.83 ± 1.38 0.0146 15:0 13.79 ± 1.16 18.93 ± 0.90 0.0013 16:0 156.20 ± 3.53 172.61 ± 3.24 0.0006 16:1n-9 5.78 ± 0.38 6.50 ± 0.17 0.0315 17:0 1.38 ± 0.13 1.28 ± 0.06 0.3798 18:0 65.16 ± 0.90 91.30 ± 3.82 0.0099 18:1n-9 239.69 ± 3.18 240.58 ± 2.88 0.3101 18:1n-7 9.90 ± 0.13 9.73 ± 0.08 0.2893 18:2n-6 307.26 ± 3.47 299.13 ± 7.48 0.0844 18:3n-6 3.45 ± 0.02 3.25 ± 0.14 0.0005 18:3n-3 70.25 ± 0.93 24.39 ± 1.38 0.0005 20:0 1.49 ± 0.05 1.42 ± 0.02 0.1892 22:0 5.15 ± 0.01 4.74 ± 0.07 0.0061 Sums and ratios of fatty acid
n-3 70.25 ± 0.93 24.39 ± 1.38 0.0005 PUFA 386.11 ± 3.59 326.76 ± 7.60 0.0006 PUFA / SFA 1.37 ± 0.03 0.98 ± 0.03 0.0003 Indices of the quality of the lipid fraction
IA 0.40 ± 0.03 0.51 ± 0.02 0.0017
IT 0.49 ± 0.02 0.84 ± 0.03 0.0007
alternative to increase nutrients contents in food products, especially bakery ones.
Acknowledgements
To Capes, CNPq and Araucária Foundation for the financial support and for the scholarship offered. To Universidade Estadual de Maringá for the resources and technologies availability to this research development.
References
1. Paula, L. N.; Souza, A. H. P.; Moreira, I. C.; Gohara, A. K.; Oliveira, A. F.; Dias, L.; F.; Acta Sci., Technol.2014, 36, 707. 2. Souza, A. H. P.; Costa, G. A. N.; Miglioranza, L. H. S.;
Furlaneto-Maia, L.; Oliveira, A. F.; Acta Sci., Health Sci.2013, 35, 125.
3. Fuchs, R. H. B.; Ribeiro, R. P.; Matsushita, M.; Tanamati, A. A. C.; Bona, E.; Souza, A. H. P.; LWT – Food Sci. Technol.
2013, 54, 440.
4. Osawa, C. C.; Fontes, L. C. B.; Miranda, E. H. W.; Chang, Y. K.; Steel, C. J.; Food Sci. Technol. 2009, 29, 92.
5. Lee, A. R.; Ng, D. L.; Zivin, J.; Green, P. H.; J. Hum. Nutr. Diet
2007, 20, 4230.
6. Shi, Y. In National Cooperating Symposium of Reproduction and Selection for Edible Legume Germplasm Resources and
Identification of Agronomic Characteristics, 1st ed.; Long, L.; Lin, L.; Xushen, H.; Shi, Y., eds.; Science Publishing House: Beijing, 1988, pp. 9.
7. Ayerza, R.; J. Am. Oil Chem. Soc. 1995, 72, 1079.
8. Zanqui, A. B.; Morais, D. R.; Silva, C. M.; Santos, J. M.; Chiavelli, L. U. R.; Bittencourt, P. R. S.; Eberlin, M. N.; Visentainer, J. V.; Cardozo-Filho, L.; Matsushita, M.; J. Braz. Chem. Soc.2010, 55, 192.
9. Ratnayake, W. M.; Galli, C.; Ann. Nutr. Metab. 2009, 55, 8. 10. Neto, B. B.; Scarminio, I. S.; Bruns, R. E.; Como Fazer
Experimentos: Pesquisa e Desenvolvimento na Ciência e
Indústria, 2a ed.; Editora da Unicamp: Campinas, 2001. 11. Correia, P. R. M.; Ferreira, M. C.; Quim. Nova2007, 30, 481. 12. Gohara, A. K.; Souza, A. H. P.; Zanqui, A. B.; Souza, N. E.;
Visentainer, J. V.; Matsushita, M.; Acta Sci., Technol. 2014, 36, 537.
13. Gohara, A. K.; Souza, A. H. P.; Rodrigues, A. C.; Stroher, G. L.; Gomes, S. T. M.; Souza, N. E.; Visentainer, J. V.; Matsushita, M.; J. Braz. Chem. Soc.2013, 24, 771.
14. Bligh, E. G.; Dyer, W. J.; Can. J. Biochem. Physiol. 1959, 37, 911.
15. Hartman, L.; Lago, R. C. A.; Lab. Pract.1973, 22, 475. 16. Joseph, J. D.; Ackman, R.; J. Am. Oil Chem. Soc.1992, 75, 488. 17. Analytical Methods Committee; Analyst1987, 112, 199. 18. Ulbricht, T. L. V.; Southgate, D. A. T.; Lancet1991, 338, 985. 19. Souza, A. H. P.; Gohara, A. K.; Rodrigues, A. C.; Ströher, G. L.; Silva, D. C.; Visentainer, J. V.; Souza, N. E.; Matsushita, M.; Food Chem.2014, 158, 315.
20. Derringer, G.; Suich, R.; J. Qual. Technol.1980, 12, 214. 21. StatSoft, Inc.; Statistica:Data Analysis Software System v. 8.0;
StatSoft Inc., Tulsa, 2007.
22. Martin, C. A.; Almeida, V. V.; Ruiz, M. R.; Visentainer, J. E. L.; Matsushita, M.; Souza, N. E.; Visentainer, J. V.; Rev. Nutr.2006, 19, 761.
23. Simopoulos, A. P.; Mol. Neurobiol.2011, 44, 203.
24. Zanqui, A. B.; Bastiani, D.; Souza, A. H. P.; Marques, D. R.; Gohara, A. K.; Matsushita, M.; Monteiro, A. R. G.; Rev. Virtual Quim.2014, 6, 968.
25. Souza, A. H. P.; Gohara, A. K.; Pagamunici, L. M.; Visentainer, J. V.; Souza, N. E.; Matsushita, M.; Acta Sci., Technol.2014, 36, 157.
26. Pagamunici, L. M.; Souza, A. H. P.; Gohara, A. K.; Souza, N. E.; Gomes, S. T. M.; Matsushita, M.; Cienc. Agrotecnol.2014, 38, 270.
27. Pagamunici, L. M.; Gohara, A. K.; Souza, A. H. P.; Bittencourt, P. R. S.; Torquato, A. S.; Batiston, W. P.; Gomes, S. T. M.; Souza, N. E.; Visentainer, J. V.; Matsushita, M.; J. Braz. Chem. Soc.
2014, 25, 219.
28. Pujari, V.; Chandra, T. S.; Process Biochem.2000, 36, 31. 29. Pagamunici, L. M.; Souza, A. H. P.; Gohara, A. K.; Silvestre,
A. A. F.; Visentainer, J. V.; Souza, N. E.; Gomes, S. T. M.; Matsushita, M.; Food Sci. Technol.2014, 34, 127.
30. Souza, A. H. P.; Gohara, A. K.; Rotta, E. M.; Chaves, M. A.; Silva, C. M.; Dias, L. F.; Gomes, S. T. M.; Souza, N. E.; Matsushita, M.; J. Sci. Food Agric.2015, 95, 928.
31. Souza, A. H. P.; Gohara, A. K.; Rodrigues, A. C.; Souza, N. E.; Visentainer, J. V.; Matsushita, M.; Acta Sci., Technol.2013, 35, 757.
32. Silva, C. M.; Zanqui, A. B.; Souza, A. H. P.; Gohara, A. K.; Chaves, M. A.; Gomes, S. T. M.; Cardozo-Filho, L.; Souza, N. E.; Matsushita, M.; J. Braz. Chem. Soc. 2015, 26, 14. 33. Institute of Medicine; Dietary Reference Intakes for Energy,
Carbohydrate, Fiber, Fat, Fatty Acids, Cholesterol, Protein,
and Amino Acids; The National Academies Press: Washington, DC, 2005.
Submitted: July 13, 2015