Determinação das temperaturas de transformação A
R1e A
R3em barras de aço
CA-50 laminadas a quente
Determination of the transformation temperatures A
R1and A
R3for hot rolled
CA-50 steel rebars
DOI:10.34117/bjdv6n11-383
Recebimento dos originais: 03/10/2020 Aceitação para publicação: 18/11/2020
Felipe Farage David Mestre em Engenharia Mecânica
Instituto Federal de Minas Gerais, IFMG, Campus Congonhas,
Av. Michael Pereira de Souza, 3007. Campinho. Congonhas, MG, Brasil. CEP 36417-050. E-mail: [email protected]
Luan Marcel Costa Vasconcelos Graduando em Engenharia Mecânica
Instituto Federal de Minas Gerais, IFMG, Campus Congonhas,
Av. Michael Pereira de Souza, 3007. Campinho. Congonhas, MG, Brasil. CEP 36417-050. E-mail: [email protected]
Vinicius Aleixo Silvestre Graduando em Engenharia Mecânica
Instituto Federal de Minas Gerais, IFMG, Campus Congonhas,
Av. Michael Pereira de Souza, 3007. Campinho. Congonhas, MG, Brasil. CEP 36417-050. E-mail: [email protected]
Sayd Farage David Mestre Metalurgia e Materiais
Instituto Federal do Espírito Santo, IFES, Campus Cachoeiro de Itapemirim.
Rodovia Cachoeiro x Alegre, km 05, Morro Grande - Cachoeiro de Itapemirim, ES – Brasil. CEP 29300970.
E-mail: [email protected] ABSTRACT
This paper has as objective to determinate the critical temperatures of transformation Ar1 and Ar3 for steel rebars from ABNT/NBR CA-50 class [1], which are produced by hot rolling process. To determinate these temperatures, quenching heat treatments are going to be made at various temperatures, determining the start of the Austenite formation (Ar1 temperature) and complete Austenite formation (Ar3 temperature). To have these temperatures known is so important to reach the desired microstructure in the product after the hot rolling process and consequently, control its mechanical properties. Furthermore, rolling the steel at inter critic field (located between the Ar1 and Ar3 temperatures) requires greater rolling efforts, reducing the rolling chain service life. That way, the determination of the Ar1 and Ar3 temperatures are of great importance for the steel industry. The used methods, metallographic and hardness method showed efficient for the critical temperatures calculation.
Keywords: Quenching heat treatment, Transformation temperature Ar1, Transformation temperature Ar3, Vickers Hardness, Metallography.
RESUMO
Este trabalho tem como objetivo determinar as temperaturas críticas de transformação Ar1 e Ar3 para vergalhões de aço classe ABNT / NBR CA-50 [1], os quais são produzidos por processo de laminação a quente. Para determinar essas temperaturas, tratamentos térmicos de têmpera serão feitos em várias temperaturas, determinando o início da formação da austenita (temperatura Ar1) e formação completa da austenita (temperatura Ar3). Conhecer essas temperaturas é muito importante para atingir a microestrutura desejada no produto após a laminação a quente e, consequentemente, controlar suas propriedades mecânicas. Além disso, laminar o aço no campo intercrítico (localizado entre as temperaturas Ar1 e Ar3) requer maiores esforços de laminação, reduzindo a vida útil da corrente rolante. Dessa forma, a determinação das temperaturas Ar1 e Ar3 são de grande importância para a indústria siderúrgica. Os métodos utilizados, metalográfico e de dureza, mostraram-se eficientes para o cálculo das temperaturas críticas.
Palavras-chave: Tratamento térmico de têmpera, Temperatura de transformação Ar1, Temperatura de transformação Ar3, Dureza Vickers, Metalografia.
1 INTRODUCTION
The temperature in which the steel is hot rolled, principally at completion stages, its crucial for the final microstructure determination of product and determines how much mechanical effort is necessary to made the metal deformation. Basically, exists two types of hot rolling: the first is made at inter critic region and the second is made at temperatures above the A3 temperature. In the steel industry, one of the ways of estimate the critical temperatures is through empirical equations [2]. However, these equations are valid at a range of specific chemical composition, there is no parameters related to the heating rate, that can lead to imprecisions.
The rolling above the A3 temperature occurs when the steel is heated to its monophasic austenitic field, and kept there until the whole initial microstructure transforms in Austenite [3]. In the common carbon steel rolling, isn’t usual rolling it between the A1 and A3 temperatures, because the Ferrite is less ductile than Austenite, consequently, there is a significative increase in the necessary rolling efforts and decreasing in the service life of the rolling chain components. That way, the rolling is performed above the Ar3 temperature ensuring that all microstructure is at austenitic monophasic field.
The Austenite-Ferrite transformation (γ → α) is a fundamental solid-solid transformation in steel. Therefore, is so important understand its behavior, to delimitate the start and the end of the transformation [4, 5]. The steel rolling in at the inter critic field happens in a temperature which is situated between critic temperatures A1 and A3, there the steel will be conformed with its microstructure compound by Ferrite (α) and Austenite (γ). Normally this kind of rolling its applied on high resistance special steels, as in Dual Phase steels [6, 7]. One factor that influences in the transformation speed is
the heating or cooling rate. The faster heating provides less diffusion time and it tends to increase the critical equilibrium temperatures [8] In the same way, the faster cooling tends to decrease the critical temperatures. The effect of the heating or cooling rates creates an entire new sub group of critical temperatures designated as “Ac” or “Ar” (Critical temperature at heating and cooling, respectively). So, as a result of the heating and cooling effects, exists another two sub groups of critical temperatures: Ac1, Ac3, Ar1, Ar3 [2].
As the knowledge of the critical temperatures are decisive to obtain the hot rolled products mechanical properties and to preserve the service life of the rolling chain components, it becomes important to steel industry determinate, by laboratory experiments the Ar1 and Ar3 temperatures. This paper proposes, through quenching heat treatments, quantification of Martensite and hardness tests, to determinate the critical temperatures for the steel rebars ABNT/NBR 7480 class CA-50 [1].
2 METHODOLOGY
The quenching heat treatment is a treatment applied for increase the steel hardness, due to Martensite microstructure formation [9]. Thus, knowing the expressive difference between the Ferrite (α) and Martensite (M), being that as greater the percentage of Martensite present in the microstructure, greater will be the steel hardness [10, 11]. The percentage of Martensite formatted after the quenching heat treatment is the same of Austenite non-transformed at aim temperature, because when the steel is austenitized the cooling rate of the quenching heat treatment unable the formation of other microstructures types as Ferrite, Pearlite and Bainite [12, 13, 14].
For the experiment’s realization, it was used ABNT/NBR 7480 class CA-50 [1] steel samples. The samples contain the following dimensions: 8 mm of nominal diameter and 10 mm length.
Eleven steel specimens were prepared for the quenching heat treatment. The samples were heated on a muffle furnace at 892ºC temperature over 30 minutes for its complete austenitization. Then, each one of the eleven specimens were cooled inside of the furnace and to an aim temperature, and after this, it was held there for 30 minutes. After that, the specimens were immediately cooled in water with the objective of apply the quenching heat treatment. The selected aim temperatures were: 646, 666, 686, 705, 724, 743, 761, 780, 800, 820 and 840ºC.
The Figure 1 shows graphically the cooling process and the quenching heat treatment for a 724ºC aim temperature. At Austenitization temperature (Tγ) there is only Austenite in the microstructure. When the temperature reaches the aim temperature (Taim) of 724ºC its haves pro-eutectoid Ferrite (αp), Pearlite (P) and Austenite (γ). After the water cooling, the remaining Austenite portion transforms itself adifusionally [15] and instantly in Martensite [12].
Figure 1: Quenching heat treatment graph for a 724ºC treated sample.
After the quenching heat treatment, the samples were sanded, following the granulometry sequence: #80, #120, #220, #400, #600, #1000 and #1500. Then, it was polished with diamond paste of 9 and 3 µm granulometry. After this procedure, the samples were chemically attacked with 5% Nital (5% concentrated nitric acid + 95% ethyl alcohol).
For the metallographic analysis, was used the Optical Microscope Olympus BX41M-LED, and for hardness tests was used a Vickers durometer. In both of methods, it was sought analyze distinct parts of every sample, for a reliable result.
It was captured 12 images of each sample, from distinct points, using a 200x magnification. For the quantification of Martensite, it was used an open-coded software called ImageJ, through it was possible to quantify the area percentage of Martensite present in each image.
3 RESULTS
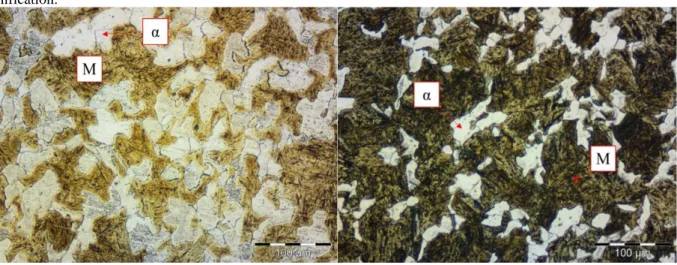
After the metallographic procedures, it was possible to differ Ferrite grains (α) from Martensitic microstructure (M), in two different temperatures as shown at Figure 2. At the end of the analysis was possible to build a curve with the variation of the Martensite percentage in function of the quenching heat treatment aim temperature (Taim).
0 200 400 600 800 1000 0 2000 4000 6000 8000 T em p er atu re [° C] Time [s] Tγ = 892°C Taim= 724°C αp+ P +γ αp+ P +M
Figure 2: The difference between Ferritic (α) and Martensitic (M) microstructures. Image captured from two samples quenched at different temperatures, 724ºC (left) and 800ºC (right). Chemical surface attack made with 5% Nital. 200x magnification.
The Martensite formed quantity represents the non-transformed Austenite quantity at Taim, because when the steel is austenitized, the quenching heat treatment cooling rate prevents the formation of Ferrite, Pearlite and Bainite [12]. Thus, the Ar1 temperature will be identified immediately when the Martensite’s percentage reaches to 0%. At the same way, the Ar3 temperature will be obtained when the Martensite percentage reaches 100%. With the metallographic analysis results, the data shown in Table 1 were obtained.
Table 1: Martensite quantity in function of aim Temperature. Aim Temperatur e [ºC] / Test number 1 2 3 4 5 6 7 8 9 10 11 12 Averag e Standar d Deviatio n 646 0,0 0,0 0,0 0,0 0,0 0,0 0,0 0,0 0,0 0,0 0,0 0,0 0,0 0,0 666 0,5 0,0 0,3 0,2 1,5 0,3 0,5 0,2 0,0 0,5 0,1 0,3 0,4 0,4 686 30, 3 32, 2 29, 9 26, 9 29, 1 32, 2 25, 3 31, 8 29, 6 29, 8 26, 6 34, 2 29,8 0,4 705 48, 9 49, 4 53, 8 54, 2 55, 5 53, 2 55, 2 52, 0 54, 5 50, 9 54, 1 54, 4 53,0 2,2 724 57, 3 55, 5 53, 7 57, 7 56, 3 61, 4 56, 8 63 60, 4 56, 0 55, 9 54, 7 57,4 2,8 743 63, 3 67, 7 70, 8 71, 3 70, 5 68, 6 66, 6 72, 3 68, 4 68, 0 68, 1 70, 8 68,9 2,4 761 74, 9 71, 4 72, 1 66, 5 73, 3 68, 2 68 66, 7 68, 2 67, 2 66, 0 66, 9 69,1 3,0 780 77, 6 75, 7 76, 4 77, 7 74, 2 70, 8 77, 7 71, 5 74, 2 78, 0 77, 0 77, 1 75,6 2,5 800 83, 4 83, 6 86, 7 86, 0 85, 3 82, 4 82, 4 86, 3 87, 8 84, 5 86, 4 82, 4 84,8 1,9 820 98, 2 99, 0 98, 6 99, 5 99, 7 99, 3 99, 5 99, 5 99, 2 98, 6 99, 2 99, 4 99,1 0,5 840 100 100 100 100 100 100 100 100 100 100 100 100 100 0,0
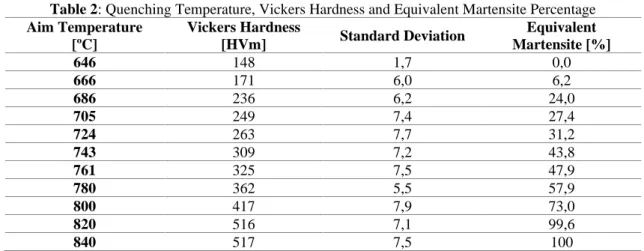
For the Vickers hardness tests, it was setted up a 30 kgf load over a 20 s time. 12 tests in each sample were made, ensuring data collection of the entire sample surface. Searching a better comparison between the aim Temperature (Taim) and Vickers Hardness (HVm), it was calculated an equivalent percentage of Martensite for Vickers Hardness, considering the lowest HVm value (148) equivalent to 0% of Martensite and the higher HVm value (517) equivalent to 100% of Martensite in the sample microstructure. The heat-treated samples at Taim of 646ºC and 840ºC were analyzed through the microscope as shown on Table 1. In the 646ºC sample’s microstructure is almost composed only by Ferrite and Pearlite and the 840ºC sample had its microstructure composed only by Martensite. Making possible the comparison the shown hardness with an equivalent Martensite quantity. The equivalent percentage and the harness values are shown at Table 2.
Table 2: Quenching Temperature, Vickers Hardness and Equivalent Martensite Percentage Aim Temperature [ºC] Vickers Hardness [HVm] Standard Deviation Equivalent Martensite [%] 646 148 1,7 0,0 666 171 6,0 6,2 686 236 6,2 24,0 705 249 7,4 27,4 724 263 7,7 31,2 743 309 7,2 43,8 761 325 7,5 47,9 780 362 5,5 57,9 800 417 7,9 73,0 820 516 7,1 99,6 840 517 7,5 100
With the knowledge of the data from Tables 1 and 2, it was possible to calculate the average of values for each sample and the standard deviation value, building Graphs 1 and 2.
Graph 1: Martensite Percentage in function of Temperature, with the metallographic method.
R² = 0.9775 620 670 720 770 820 870 0 20 40 60 80 100 T em p er atu re [º C ] Martensite Percentage [%]
Graph 2: Equivalent Martensite Percentage in function of Temperature, with the hardness method.
From the graphs building, it was applied a third-degree polynomial regression. So, obtaining a determination coefficient R² = 0,98 for Graph 1 and R² = 0,99 for Graph 2. The mathematics models found are in accordance with the Equations 1 and 2. The Equation 1 represents the mathematic model found using the metallographic method (ArMM), the Equation 2 represents the model found using the hardness method (ArHM).
ArMM = -0,0001M3 + 0,0292M2 – 0,1162M + 656,87 (1)
ArHM = -0,0002M3 + 0,0182M2 + 1,771M + 648,13 (2)
In both equations, the M variable represents the steel Martensite percentage. In accordance with the Eq. 1, the temperature which has no Austenite percentage (M=0) (Ar1) is 657ºC, and the temperature which its haves full Austenite in the steel (M=100) (Ar3) is 837ºC. For Eq. 2, the Ar1 temperature is 648ºC and the Ar3 temperature is 807ºC.
R² = 0.9865 620 670 720 770 820 870 0 20 40 60 80 100 T em p er atu re [º C ]
4 DISCUSSION
With the objective of validate the methods, it was considered a typical chemical composition of a CA-50 steel, being able to compare the results experimentally obtained with empirical equations existing in the literature. The Table 3 shows the considered chemical composition for the CA-50 steel.
Table 3: Chemical composition of a CA-50 steel (w.t.%) [16].
C Si Mn Cr Mo Ni Cu Nb Sn Fe
(bal.) 0,265 0,133 0,718 0,1295 0,0414 0,0683 0,155 0,0083 0,0207 98,39
Using the chemical composition of Table 3, the Ar temperatures can be calculated using existing empirical equations. The Eq. 3 and Eq. 4 are used for calculate the Ar1 temperatures and the Eq. 5 and Eq. 6 are used for calculate the Ar3 temperatures.
Ar1 = 739 – 22C – 7Mn + 2Si (3) [17]
Ar1 = 741,7 – 7,13 C – 14,09Mn + 16,26Si + 11,54Cr – 49,69Ni (4) [18]
Ar3 = 913,7 – 207,13C – 46,6Mn + 110,54Cr + 108,1N (5) [18]
Ar3 = 910 – 230C – 21Mn – 15Ni + 32Mo + 45Si + 13W + 104V (6) [19]
Table 4: Ar1 and Ar3 temperatures calculated by empirical equations and experimental methods
Calculation Method Ar1 [ºC] Ar3 [ºC] Eq. 3 728 - Eq. 4 733 - Eq. 5 - 840 Eq. 6 - 853 Metallographic method 657 837 Hardness method 648 807
The Table 4 shows the temperatures values calculated with the equations shown above and the Table 5 compares it to the obtained temperatures with metallographic and hardness methods.
Table 5: Difference between critical temperatures calculation methods
Calculation Method Difference
compared to Metallographic Method Ar1 [%] Difference compared to Metallographic Method Ar3 [%] Difference compared to Hardness Method Ar1 [%] Difference compared to Hardness Method Ar3 [%] Eq. 3 10,8 - 12,3 - Eq. 4 11,6 - 13,1 - Eq. 5 - 0,3 - 4,1 Eq. 6 - 1,9 - 5,7
All the difference values were shown in modulus. It should be taken in consideration the fact that the empirical equations it doesn’t take in account the heating or cooling rates in their variables, which can be directly influent at the calculation of the critical temperatures.
The difference between two experimental methods were calculated as well, as shows the Table 6.
Table 6: Difference between experimental methods Calculation Method Ar1 [ºC] Ar3 [ºC] Temperature difference Ar1 [ºC / %] Temperature difference Ar3 [ºC / %] Metallographic method 657 837 9 / 1,4 30 / 3,7 Hardness method 648 807
The results obtained through experimental methods did not differ much, showing a maximum difference of 30ºC in Ar3 temperatures, equivalent to approximately a 3.7% of difference.
5 CONCLUSION
For the steel quality used in this experiment, both methods have shown itself promising to determine the critical transformation temperatures Ar1 and Ar3, with a very low difference between them (3,7%). Inside the inter-critic field, the steel had shown a hardness proportional to the Martensite quantity. As higher the steel HVm, higher will be the Martensite quantity.
The comparison of the results obtained with the empirical equations showed a maximum difference of 13,1% with the results obtained experimentally on the Ar1 temperature. This shows the importance of using the experimental method to determinate the transformation temperatures Ar1 and Ar3 for a specific steel type, since the empirical equations are very general, which can lead to inaccurate calculations of the transformation temperatures.
ACKNOWLEDGMENTS
The authors would like to thank the Federal Institute of Education, Science and Technology of Minas Gerais (IFMG - Campus Congonhas) for the financial support that was fundamental for the development of this job.
REFERENCES
[1] Brazilian Association of Technical Standards (ABNT), Brazilian Standard ABNT NBR 7480. Steel intended for reinforcement for reinforced concrete structure - Specification. 2007.
[2] KRAUSS, G. Steels Processing, Structure, and Performance. 1.ed. United States of America, ASM International, 602p, 2005.
[3] QUAN, G.; ZHAN, Z.; ZHANG, L.; WU, D.; LUO, G.; XIA, Y. A study on the multi-phase transformation kinetics of ultra-high-strenght steel and application in thermal-mechanical-phase coupling simulation of hot stamping process. Materials Science and Engineering: A, v. 673, pp 24-38, sept. 2016.
[4] ZHANG, X.; HICKEL, T.; ROGAL, J.; FÄHLER, S.; DRAUTZ, R.; NEUGEBAUER, J. Structural transformations among austenite, ferrite and cementite in Fe-C alloys: A unified theory based on ab initio simulations. Acta Materialia, oct. 2015, v. 99, pp 281-289.
[5] KOHTAKE, T.; YAMANAKA, A.; SUWA, Y. Phase-Field Simulation of α Growth Stagnation During γ → α Transformation in Fe-X-Y and Fe-C-Mn Alloys. Merallurgical and Materials Transactions A, pp 5023-5034, v. 49, issue 10, oct. 2018.
[6] WEISS, M.; KUPKE, A.; MANACH, P.Y.; GALDOS, L.; HODGSON, P.D. On the Bauschinger effect in dual phase steel at high levels of strain. Materials Science & Engineering A, 643: 127-136, 2015.
[7] HALDER, C.; KARMAKAR, A.; HASAN, S. M.; CHAKRABARTI, D.; PIETRZYK, M.; CHAKRABORTI, N.; Effect of Carbon Distribuition During the Microstucture Evolution of Dual-Phase Steels Using Cellular Automata, Genetic Algorithms, and Experimental Strategies. Metallurgical and Materials Transactions A, v. 47, issue 12, pp 5890-5906, dec. 2016.
[8] BHADESHIA, H.K.D.H.; HONEYCOMBE, R.W.K. Steels Microestructure and Properties. 3.ed. Oxford, Elservier, 2006. 357p.
[9] WU, Y. X.; SUN, W.W.; STYLES, M. J.; ARLAZAROV, A.; HUTCHINSON, C. R. Cementite coarsening during the tempering of Fe-C-Mn martensite. Acta Materialia, v. 159, pp 209-224, oct. 2018.
[10] SATO, H.; SATO, T.; SHIOTA, Y.; KAMIYAMA, T.; TREMSIN, A. S.; OHNUMA, M.; KIYANAGI, Y. Relation between Vickers Hardness and Bragg-Edge Broadening in Quenched Steel Rods Observed by Pulsed Neutron Transmission Imaging. Materials Transactions, v.56, pp 1147-1152, 2015.
[11] MAUGIS, P. Ferrite Martensite and supercritical iron: A coherent elastochemical theory of stress-induced carbon ordering in steel. Acta Materialia, v.158, pp 454-465, 2018.
[12] SILVA, E. P; PACHECO, P. M. C. L.; SAVI. M. A. On the thermo-mechanical coupling in austenite-martensite phase transformation related to the quenching process. International Journal of Solids and Structures, v.41, pp 1139-1155, 2004.
[13] KANNAN, R.; WANG, Y.; NOURI.; LI, D.; LI, L. Instrumented indentation study of bainite/martensite duplex microstructure. Materials Science & Engineering A, v.713, pp 1-6, jan. 2018. [14] NAVARRO-LÓPEZ, A.; HIDALGO, J.; SIETSMA, J.; SANTOFIMIA, M. J. Influence of the prior athermal martensite on the mechanical response of advanced bainitic steel. Materials Science & Engineering A, v.735, pp 343-353, sep. 2018.
[15] FONSECA, M. G.; MEDEIROS, J. L. B.; BIEHL. L. V; COZZA, L. M.; AMARAL, F. A. D.; BONATO, S. V.; SOUZA, J. Study of the austenite retained percentage by subzero and cryogenic process. Brazilian Journal of Development, v.6, pp 62311-62322, aug. 2020.
[16] ALONSO, M. B. Top weld joint characterization on CA-50 bars with coated electrodes. 2006. 67 f. Dissertation (Master’s Degree in Mechanical Engineering) - Federal University of Santa Catarina (UFSC).
[17] SCHACHT, K. et alii.: Material Models and their Capability for Process and Materials Properties Design in Different Forming Processes. Materials Science Forum, pp 174-182, 854, 2016.
[18] LUTSENKO, A. et alii. The Definition and Use of Technological Reserves – An Effective Way to Improve the Production Technology of Rolled Metal. Abschluβbericht, Kommission der Europäischen Gemeischaften, Luxembourg, 1991, 136 p.
[19] PICKERING, F.B.: Steels: Metallurgical Principles. In: Encyclopedia of Materials Science and Engineering, vol. 6, The MIT Press, Cambridge, 1986.

![Table 3: Chemical composition of a CA-50 steel (w.t.%) [16].](https://thumb-eu.123doks.com/thumbv2/123dok_br/17388906.799295/8.893.171.719.632.767/table-chemical-composition-ca-steel-w-t.webp)
![Table 6: Difference between experimental methods Calculation Method A r1 [ºC] A r3 [ºC] Temperature difference A r1 [ºC / %] Temperature difference Ar3[ºC / %] Metallographic method 657 837 9 / 1,4 30 / 3,7 Hardness method 648 807](https://thumb-eu.123doks.com/thumbv2/123dok_br/17388906.799295/9.893.185.704.256.383/difference-experimental-calculation-temperature-difference-temperature-difference-metallographic.webp)
