Assessment of local dynamics in extreme precipitation frequency using
direct sequential cosimulation
ANA CRISTINA COSTA
Instituto Superior de Estatística e Gestão de Informação
Universidade Nova de Lisboa
Campus de Campolide, 1070-312 Lisboa
PORTUGAL
[email protected] http://www.isegi.unl.pt
AMILCAR SOARES
Centro de Recursos Naturais e Ambiente
Instituto Superior Técnico
Av. Rovisco Pais, 1049-001 Lisboa
PORTUGAL
[email protected] http://cerena.ist.utl.pt/
MARIA JOÃO PEREIRA
Centro de Recursos Naturais e Ambiente
Instituto Superior Técnico
Av. Rovisco Pais, 1049-001 Lisboa
PORTUGAL
[email protected] http://cerena.ist.utl.pt/
RITA DURÃO
Centro de Recursos Naturais e Ambiente
Instituto Superior Técnico
Av. Rovisco Pais, 1049-001 Lisboa
PORTUGAL
[email protected] http://cerena.ist.utl.pt/
Abstract: This study evaluates space-time dynamics in extreme precipitation frequency by calculating a
climate index at stations with records within the 1940–1999 period in the South of Portugal. This index is based on the annual count of days with precipitation above the 30 mm threshold (R30mm). Direct sequential cosimulation (coDSS) with elevation is used in the spatial interpolation and uncertainty assessment of the extreme precipitation index. The methodology incorporates space-time models that follow the premises that elevation and precipitation extremes may interact differently not only in space, but also through time. The results indicate that the relationship between elevation and the R30mm index has decreased through time over the study region. Moreover, the spatial patterns of precipitation extremes have become more homogenous during the last decades of the twentieth century. The more frequent rainfall events occur in the mountainous areas of the South (Algarve region). Accordingly, many areas of Algarve are at risk of water erosion and floods caused by extreme precipitation events. Regions where the distribution of precipitation extremes shows greater spatial variability, thus more uncertainty, correspond to regions less densely sampled. However, the uncertainty in mountainous regions is noticeably small given that elevation was used as secondary exhaustive information.
Key-Words: Climate dynamics; geostatistics; space-time patterns; stochastic simulation; uncertainty; local
1 Introduction
The precipitation regime in southern Portugal is Mediterranean, thus highly variable in both the spatial and temporal dimensions. It is characterized by scarce rainfall, little runoff and water availability [1], frequent drought periods, and intense flood peaks. The most southern region (Algarve) is the one where episodes of heavy precipitation are most frequent and exhibits the strongest torrential character [2], [3]. Moreover, the South of the country has extensive areas highly vulnerable to desertification [4].
Climate has an important role on desertification processes through its impacts on dryland soils and vegetation. During wetter periods, high intensity rainfall is the most important contributor to erosion in drylands [5]. Therefore, research on the space-time patterns of heavy rainfall events is an important contribution to evaluate desertification dynamics and to identify areas potentially at risk from land degradation. However, studies focusing on the role of regional climate changing on erosive factors are lacking for Portugal, especially at the local scale [4], [6].
[7] and [8] focus on the spatial interpolation of rainfall fields in Portugal, while [2] and [9] analyse the patterns of precipitation indices in southern regions of Portugal using geostatistical simulation algorithms.
This study aims at evaluating the spatial and temporal local dynamics of extreme precipitation frequency from 1940 to 1999 in the South of Portugal.
A common approach to understand and assess the rainfall patterns over a region is based on the analysis of changes in climate indices, which are estimated from the empirical distribution of the daily observations [10], [11], [12]. The R30mm index was chosen to characterize the frequency of heavy precipitation events in the South of Portugal for the 1940–1999 period. Annual scenarios of this climate index were produced for that period using direct sequential cosimulation with elevation. Those scenarios were then used to produce an additional set of maps of indicators summarizing the scenarios’ underlying local dynamics.
The methodology is described in Sect. 2, and the study region and data are detailed in Sect. 3. The main results are presented and discussed in Sect. 4, including the relationship between elevation and the R30mm index, the space-time dynamics of the index in 1940–1999, and the uncertainty evaluation of the produced maps. Finally, Sect. 5 states the major conclusions.
2 Methods
Consider the two dimensional problem of estimating a primary variable z at an unsampled location u0. Let
{z(uα), α=1, …, n} be the set of primary data measured at n locations uα. Most of geostatistics is based on the assumption that each measurement
z(uα) is a particular realization of the random
variable Z(uα). Kriging uses a linear combination of
neighbouring observations to estimate the unknown value at the unsampled location u0. This problem
can be expressed in terms of random variables as:
( )
∑
( )
= α α α λ = n 1 0 Zu u Zˆ (1)The optimal kriging weights λα are determined by solving the kriging equations that result from minimizing the estimation variance while ensuring unbiased estimation of Z(u0) by Zˆ
( )
u0 . When developing the kriging equations the model of spatial covariances, or variogram (inverse function of the spatial covariances), is assumed known. Typically, a mathematical variogram model is selected from a small set of authorised ones (e.g. exponential) and is fitted to experimental semivariogram values calculated from data for given angular and distance classes. In bounded models (e.g., spherical and exponential), variogram functions increase with distance until they reach a maximum, named sill, at an approximate distance known as the range. The range is the distance h at which the spatial (or temporal) correlation vanishes, i.e. observations separated by a distance larger than the range are spatially (or temporally) independent observations.Let {z(uα, ti): α=1,…,n; i=1,…,T} be the set of climate data measured at n locations uα and in ti time
instants (years). The n monitoring stations do not have to be all informed at the same T time instants (i.e., a number of z-values can be missing). The set of climate observations correspond to outcome values (realizations) of a spatiotemporal random variable Z(u, t) that can take a series of values at any location in space u and instant in time t according to a probability distribution. For each instant in time ti,,
the sequence of the direct sequential cosimulation (coDSS) algorithm for the joint simulation of different variables is described by [13]. This algorithm uses collocated simple cokriging to estimate local means and variances, incorporating
the secondary information and the relationship between secondary and primary variables.
In this study, the coDSS algorithm is applied in order to obtain a set of m equally probable realizations of Z(u, t) at all grid nodes and all instants in time: {zs(uα, ti): s=1,…,m; α=1,…,N; i=1,…,T}, where N is the total number of grid nodes to be simulated for each instant in time. For a given instant in time t0, the set of m simulated values
{zs(u0, t0): s=1,…,m} defines the local histogram at the location (grid node) u0 for that instant. The
collocated cokriging was applied with a Markov-type approximation [14] for cross-continuity model. To reproduce the spatial distribution and uncertainty of a climate index characterizing extreme precipitation frequency, m=100
equiprobable simulated realizations were generated through the coDSS algorithm on 800 m × 800 m grids (N=74683), one for each year (T=60).
2.1 Space-time models
For each decade, the coDSS algorithm used a different space-time variogram model of the primary variable (R30mm index) and a different correlation model between primary and exhaustive secondary data (elevation), as proposed by [2]. The inferred models are detailed in Sect. 4.
2.2 Space-time dynamics
The space-time scenario for a given year t0
corresponds to the average of the local histograms that were computed for all grid cells uα:
z (u ,t ) , 1,...,N m 1 ) t , u ( z m 1 s 0 s 0 M =
∑
α = = α α (2)Similarly, the uncertainty of the space-time scenario for a given year t0 was evaluated by both
the standard deviation and the coefficient of variation of the local histograms.
Let {zM(uα, ti): α=1,…,N; i=1,…,T} be the set of
T=60 annual gridded datasets of the climate index
(denoted by IZ).At each grid node uα, the probability
of exceeding a given value zk was evaluated as the
proportion of the T estimated values zM(uα, ti) that
exceed that threshold:
[
]
w(u ,t ) , 1,...,N T 1 z ) u ( I P T 1 i i k Z ≥ ≈∑
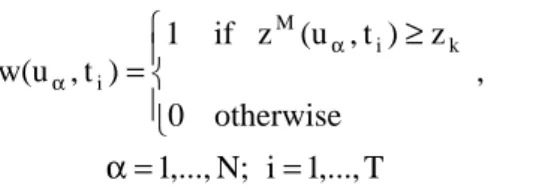
α = = α α (3)where w(uα, ti) are indicator data defined as
T ,..., 1 i ; N ,..., 1 , otherwise 0 z ) t , (u z if 1 ) t , w(u k i M i = = α ≥ = α α (4)
The nonparametric yearly trend map is based on the nonparametric estimates of the trend slope magnitude [15], computed at each grid cell uα:
N ,..., 1 , t t , ) t t ( ) t , u ( z ) t , u ( z Median ) u ( b j i i j i M j M = α < ∀ − − = α α α (5)
3 Study region and data
The study region is located in the South of continental Portugal, and 105 monitoring stations with daily precipitation data were selected (Fig. 1). Each station series data was previously quality controlled and studied for homogeneity [12], [16]. The R30mm index was computed as the annual count of days with rainfall above the 30 mm threshold.
Fig. 1 – Elevation of the study region in the South of Portugal and stations’ locations
4 Results and discussion
4.1 Space-time continuity
In this study, we chose exponential models that capture the major spatial features of the climate index within each decade [9]. The spatial variability is assumed identical in all directions (i.e. isotropic) within each decade. The parameters for each exponential variogram of the R30mm index, used in the coDSS algorithm, are summarized in Table 1.
Table 1 – Parameters of the space-time exponential variograms for the R30 index, by decade
Decade Spatial range (m) Temporal range (years) Sill 1940–49 40000 2.5 13.314 1950–59 50000 1.3 8.561 1960–69 65000 1.5 9.981 1970–79 100000 2.5 9.510 1980–89 145000 5.0 13.089 1990–99 160000 4.5 8.984 In what concerns the temporal component, there are no relevant tendencies. However, the range of the models' spatial component shows a strong increase in the spatial continuity of the frequency of heavy precipitation events on the last two decades. These findings are consistent with the results of [2] for a precipitation index that characterizes the magnitude of extreme precipitation events (named R5D), and the results of [17] for the Simple Daily Intensity Index.
4.2 Relationship with elevation
The yearly relationships between the extreme precipitation index and elevation were evaluated through Pearson's correlation coefficients (Fig. 2). Elevation was measured by the station's grid point elevation. 0 0.2 0.4 0.6 0.8 1 1940 1950 1960 1970 1980 1990 2000
Corr. of R30mm with elevation Regression line (ordinary least squares)
Fig. 2 – Regional correlations between the R30mm index and elevation, by year
The correlations are not constant through time, but rather show a negative trend during the study period, although not statistically significant. Because
of the sparse coverage of meteorological stations in some areas, especially until the 1970s, the local relationships between elevation and extreme precipitation were assessed by decade. Hence, the coDSS algorithm used a different correlation model between the R30mm index and elevation within each decade, which were inferred using the procedure proposed by [2].
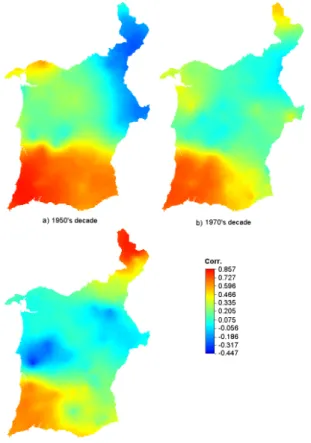
The estimated correlations between elevation and the R30mm index range from moderately weak (−0.45) to strong (0.86) across the region and along decades. For illustration purposes, only the correlation models of the 50s, 70s and 90s decades are presented in Fig. 3. The decreasing relationship between R30mm and elevation is clearly evident over the southeast region.
Fig. 3 – Local correlation models between elevation and R30mm values for the a) 1950s, b) 1970s, and c)
1990s decade
4.3 Local dynamics
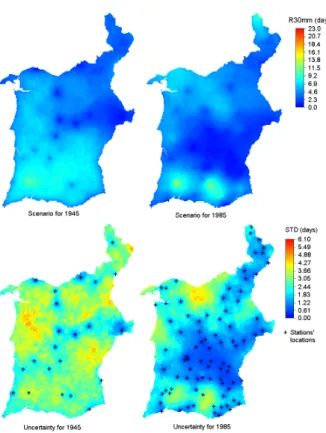
For illustration purposes, two scenarios for the frequency of extreme precipitation events are shown in Fig. 4, as well as their uncertainty evaluation measured by the standard deviation. As expected from the space-time continuity analysis, the spatial patterns of extreme precipitation became more homogenous in the last decades of the twentieth century, while the levels of local variability
decreased. Only a few stations are located at medium (>400m) and high elevations, thus greater uncertainty would be expected at those regions. However, the uncertainty in the mountainous regions of the South is often small (Fig. 5), because of the use of elevation as secondary exhaustive information in the spatial interpolation procedure. The probability map corresponding to the threshold value equal to the median of R30mm (Fig. 6a) shows that the mountainous regions of the South (in Algarve), the northeast area, as well as the west coast have high probability of frequent extreme precipitation. On the other hand, the probability map for the third quartile (Fig. 6b) shows that the more frequent heavy rainfall events occur in the mountainous areas of Algarve.
Fig. 4 – Scenarios for the R30mm index and their corresponding uncertainty measured by the
standard-deviation for 1945 (left), and 1985 (right) The trend analysis of the R30mm index, provided by [12], revealed that the trend signals of this index were not statistically significant at the majority of stations in this region. In fact, our results for the local linear trends show that there is a pattern of weak trend signals in the extreme precipitation frequency over the study region (Fig. 7). Most of the region exhibits negative trends, while a small area in the northeast has the highest positive trends.
Fig. 5 – Probability of the uncertainty of the R30mm index scenarios, measured by the coefficient of
variation, to be greater than 50%
Fig. 6 – Probability of the R30 index values to be equal or greater than fixed thresholds
Fig. 7 – Local trends in the R30mm index
5 Conclusion
The main objective of this paper is to assess spatial-temporal dynamics in the frequency of heavy precipitation events, in southern Portugal, through the analysis of the local patterns of the R30mm index.
The results indicate that the spatial patterns of the extreme precipitation frequency have become more homogenous during the last decades of the twentieth century. This conclusion is also supported by the evidence that the relationship between elevation and the R30mm index has decreased through time over
the study region. This is relevant information for the short- and medium-term management of Portuguese river basins.
The more frequent rainfall events occur in Algarve’s mountainous regions, in the South. Accordingly, many areas of Algarve are at risk of water erosion and floods caused by extreme precipitation events. Regions where the distribution of precipitation extremes shows greater spatial variability, thus more uncertainty, correspond to regions less densely sampled. However, the uncertainty in mountainous regions is noticeably small given that elevation was used as secondary exhaustive information.
The existence of links between large-scale atmospheric mechanisms and the observed increase in the spatial homogeneity of the extreme precipitation index will be the subject of a future work, in order to obtain a complete understanding of its space-time variability.
References:
[1] A. A. Paulo, L. S. Pereira, P. G. Matias, Analysis of local and regional droughts in southern Portugal using the theory of runs and the Standardised Precipitation Index, Tools for
Drought Mitigation in Mediterranean Regions,
G. Rossi, A. Cancelliere, L. S. Pereira, T. Oweis, M. Shatanawi, A. Zairi (eds.), Kluwer, Dordrecht, 2003, pp. 55-78.
[2] A. C. Costa, R. Durão, M. J. Pereira, A. Soares, Using stochastic space-time models to map extreme precipitation in southern Portugal,
Natural Hazards and Earth System Sciences,
Vol.4, No.8, 2008, pp. 763-773.
[3] M. Fragoso, P. T. Gomes, Classification of daily abundant rainfall patterns and associated large-scale atmospheric circulation types in Southern Portugal, International Journal of Climatology, Vol.4, No.28, 2008, pp. 537-544.
[4] L. S. Pereira, V. Louro, L. Rosário, A. Almeida, Desertification, territory and people, a holistic approach in the Portuguese context,
Desertification in the Mediterranean Region: a Security Issue, W. G. Kepner, J. L. Rubio, D. A.
Mouat, F. Pedrazzini (eds.), NATO Sc.Com., AK/Nato Publishing Unit, Springer-Verlag, Dordrecht, 2006, pp. 269-289.
[5] WMO, Climate and Land Degradation, World Meteorological Organization, WMO-No. 989, Geneva, Switzerland, 2005, 34 pp.
[6] F. S. Rodrigo, R. M. Trigo, Trends in daily rainfall in the Iberian Peninsula from 1951 to
2002, International Journal of Climatology, No.27, 2007, pp. 513-529.
[7] P. Goovaerts, Geostatistical approaches for incorporating elevation into the spatial interpolation of rainfall, Journal of Hydrology, No.228, 2000, pp. 113-129.
[8] R. Nicolau, L. Ribeiro, R. R. Rodrigues, H. G. Pereira, A. S. Câmara, Mapping the spatial distribution of rainfall in Portugal, Geostatistics
2000, W. J. Kleingeld, D. G. Krige (eds.),
Geostatistical Association of Southern Africa, South Africa, Vol.2, 2002, pp. 548-558.
[9] R. Durão, M. J. Pereira, A. C. Costa, J. M. Côrte-Real, A. Soares, Indices of precipitation extremes in southern Portugal – a geostatistical approach, Natural Hazards and Earth System
Sciences, Vol.1, No.9, 2009, pp. 241-250.
[10] P. Frich, L. V. Alexander, P. Della-Marta, B. Gleason, M. Haylock, A. M. G. Klein Tank, T. Peterson, Observed coherent changes in climatic extremes during the second half of the twentieth century, Climate Research, Vol.3, No.19, 2002, pp. 193-212.
[11] T. C. Peterson, Climate change indices, WMO
Bulletin, Vol.2, No.54, 2005, pp. 83-86.
[12] A. C. Costa, A. Soares, Trends in extreme precipitation indices derived from a daily rainfall database for the South of Portugal, International
Journal of Climatology, Online First, 2008, DOI:
10.1002/joc.1834.
[13] A. Soares, Direct sequential simulation and cosimulation, Mathematical Geology, Vol.8, No.33, 2001, pp. 911-926.
[14] P. Goovaerts, Geostatistics for Natural
Resources Evaluation, Applied Geostatistics
Series, Oxford University Press, 1997.
[15] R. Modarres, V. P. R. Silva, Rainfall trends in arid and semi-arid regions of Iran, Journal of
Arid Environments, Vol.2, No.70, 2007, pp.
344-355.
[16] A. C. Costa, A. Soares, Homogenization of climate data: review and new perspectives using geostatistics, Mathematical Geosciences, Vol.3, No.41, 2009, pp. 291-305.
[17] A. C. Costa, T. Oliveira, S. Dias, M. Painho, Spatial patterns of daily precipitation intensity in southern Portugal, 1940–1999, 12th AGILE
International Conference on Geographic Information Science, Association of Geographic
Information Laboratories for Europe, Hannover, 2-5 June, 2009, cd-rom.