Composite Bolted Joint
Patr´ıcia C. T. Gon¸calves, Jo˜ao Manuel R. S. Tavares Mechanical Engineering and Industrial Management InstituteFaculty of Engineering University of Porto
Rua Roberto Frias, 4200-465 Porto, Portugal patricia.goncalves AT fe.up.pt, tavares AT fe.up.pt
Abstract FastComp is a computational tool for the determi-nation of the forces that a composite bolted joint subjected to multiaxial loads supports until failure occurs. The main inten-tion of the present work was the development of a graphical user interface (GUI) for the referred tool that allows its parameteriza-tion and the visualizaparameteriza-tion of its output results. Using VTK - The Visualization Toolkit, a computational library for graphical struc-tures, visualization and image processing; C#, an object-oriented programming language; and the design principles of an adequate human-computer interaction, a graphical interface was developed as an efficient and effective means of interaction with FastComp. This interface was then evaluated by some users.
1
Introduction
The main goal of Scientific Visualization is the representation of data as images. This transformation activates our most primary sense, vision, as well as the processing power of our mind, since the human brain reacts almost instantly to images. For DeFanti et al [1], Scientific Visualiza-tion is a tool for informaVisualiza-tion discovery and knowledge because it allows transforming numerical data into adequate and friendly images, thereafter creating more perceivable information, since the brain processes images better and more quickly than sets of numbers.
Computational programs can generate considerable volumes of data of complex interpretation. With the availability of more and more powerful computer systems, with increasing memory and processing capacities, it is possible to gradually study more complex systems through even more re-alistic simulations. However, the “problem” associated to this increase of computational power is the large amount of data involved: as the volume of data increases, the more arduous it becomes to analyse and understand it. Thus, to make this analysis easier, it is imperative to have compu-tational tools capable of adequately deal with the visualization of those data.
However, the success of Visualization does not depend only on the results it produces, but also on the computational environment in which it is carried out. This environment is determined by the visualization algorithms implemented and by the hardware used, like the graphics card and the computer system memory that impose constraints in the speed of the visualization process and in the maximum size of the volume of data that can be manipulated.
But even if that environment is very good, a user should not need to know how the hardware or the visualization algorithms work to be able to visualise data. Thus, an interface between the user and the algorithms should also be part of the Visualization environment so that the user can obtain the visualization results without having to know how the algo-rithms work - to use a calculator machine nobody needs to know how it works internally.
In Scientific Visualization a GUI is to be used as a visualization tool to extract the meaning and to disclose the structure present in large and complex volumes of data. Consequently, the efficiency of the development tools of the graphical interface is of extreme importance.
The main purpose of this work was the development of a GUI for the computational program FastComp [2]. This program is a computational tool that allows the determination of the forces that a composite bolted joint subjected to multiaxial loads supports until failure occurs. Our main goal was to obtain a pleasant and intuitive interaction with FastComp and an adequate visualization of its final results to allow their easy analysis and interpretation.
For the development of our interface, VTK - Visualization Toolkit and C# were used. VTK is a computational library for graphical structures, visualization and image processing [3]; C# is an object oriented program-ming language used under the .NET platform [4].
The Visualization Toolkit is a computational library useful in scientific visualization since it comprises a set of classes that provide reading/writ-ing, processing and mapping of many visualization techniques for various types of data, including sets of points, polygons, images, volumes and rectilinear grids. Also, it contains export readers and writers for data exchange with other common computational applications and has avail-able hundreds of data processing filters, from image convolution to the Delaunay triangulation [5].
VTK classes are written in C++ and its use with C# is only possible because of the wrapper developed by Frank for the .NET languages [6]. This wrapper, a sort of an interpreter between different programming lan-guages, used in our case between C++ and C# lanlan-guages, was developed in 2003, and its use is not very common. Therefore, this work also served, in a certain way, as a real experimentation of the wrapper proposed by Frank, detecting possible errors and limitations.
Nowadays, C# programming language is not yet commonly used. However, this work demonstrates that it is possible and efficient the
in-terconnection of this technology with the Visualization Toolkit.
The graphical interface developed in this work was built using Wdows Forms [4, 7]. As already referred, the visualization of the data in-volved was possible mainly through the use of the computational library VTK; particularly, its Delaunay triangulation algorithm [8], main respon-sible for the construction of the surfaces used in the visualization of the data obtained from FastComp.
Before the development of our GUI, the introduction of the input data in the FastComp program, as its parameterization, was made through the manual creation of an ASCII file that contained all the parameters needed to run FastComp. Now, that file is automatically generated by the interface developed in the scope of this work, providing a pleasant, efficient and safe way to introduce all the necessary parameters for the execution of the FastComp tool, considering the principles of a good usability.
The final results analysis consisted in looking at the output files and trying to make some conclusions from the large collection of numbers that constitute them; or exporting part of those numbers into a spreadsheet to build a graphic, i.e., to visualize the results.
In the next section, FastComp and its main goals are introduced. The third section presents our interface and some guidelines considered in its development as an adequate human-computer interaction. Next, the GUI evaluation is reported and the obtained results analysed. This paper ends with some concluding remarks and proposals for future developments.
2
FastComp
The number of applications of composite materials is considerably in-creasing. Good mechanical behaviour, even in corrosive environments and under fatigue, high resistance and rigidity, and reduced weight are the main factors that contribute to that increasing use in many areas of engineering.
There are various computational tools to analyse and simulate com-posite structures. PROMAL [9], for example, was developed for teaching a course in Mechanics of Composite Materials in the College of Engi-neering at the University of South Florida. The software developed by India’s Aeronautical Development Agency, AUTOLAY [10], addresses is-sues related to design, analysis and manufacture of laminated composite components. Another example is ESAComp [11], a project supported by the European Space Agency (ESA) and first developed at the Helsinki University of Technology, which analyses composite laminates and lami-nated structural elements.
FastComp is also supported by ESA and is being developed in the De-partment of Mechanical Engineering and Industrial Management of the Faculty of Engineering of the University of Porto, in Portugal. ESA uses composite materials in the construction of its rockets: the cylindrical
com-Figure 1: Schema of a double, single bolted joint
ponents that constitute the structure of the rockets are made of composite materials and are interconnected by bolted joints. It is exactly on these joints, more precisely on the fastener hole, that the structural elements present major problems: failure can occur [2, 12].
As already mentioned before, the goal of Fastcomp is to determine the forces that a composite bolted joint subjected to multiaxial loads sup-ports until failure occurs. Specifically, FastComp analyses a double, single bolted, composite joint subjected to loads, figure 1. Given these loads, the geometry of the plates, the specifications of the laminate and the elastic and mechanical properties of the involved materials, the computational tool determines not only the stress and strain fields around the hole, but also the failure load and failure mode of the considered joint.
FastComp is still being improved, but its use and results analysis were not simple until the development of the GUI concerned in this paper. In fact, for FastComp to work correctly, it needs an input ASCII file with all the data relative to the joint being analysed. Before our GUI existed, that file was created manually. However, with the new interface that file is automatically generated after the introduction of all the required data, in a simple, safe and attractive way.
The output of the computational tool FastComp consists of three ASCII files: one with the information about the failure conditions, an-other one with the data relative to stress distribution, and a last one containing the data related to the strain fields. These last two files con-tain, each one, a huge volume of information, and so its direct analysis is not an easy or friendly task. Our GUI also deals with the visualization and analysis of these output results, presenting them as surfaces illustra-tive of the stress and strain fields determined around the analysed fastener hole.
3
Developed GUI
An adequate graphical interface uses the potentialities of the computa-tional system in question, from the graphics card to the mouse, in order to make a program easier and more pleasant to use. In any interface, graphical or not, the user values the easiness with which he can execute the intended tasks and the comfort when executing them. Therefore, the
key points to be considered in the development of an interface are its purpose and its target users. Thus, the choices and decisions to make along the development process must be based on the comprehension of its users. This means to have under consideration what users are good or less good at, to consider what may be able to help them in the way they execute their tasks, to think on what may give quality to the interface usage, to consider what users want of the interface and to involve them in the process of its development, and to adopt techniques and procedures tested by the users along the whole development process. To resume, it is necessary to identify the users’ needs and, from then on, to create a useful, usable and pleasant interface.
Essentially, the process of developing a new computational interface involves four main tasks [13]:
– Identifying needs. It is necessary to study users’ behaviour and the way they usually perform their tasks to shape the interface to their needs.
– Idealizing an interface that answers to those needs.
– Developing interactive versions of the interface so they can be used. The future users should be confronted with those versions of the interface, testing them to evaluate their efficiency.
– Evaluating what is being built throughout the whole development process.
These steps are complementary and should be repeated as many times as necessary. By evaluating what was built, new needs are usually identi-fied and changes to the interface are idealized or a completely new interface is developed.
Considering these steps, we completed the first three with regard to the needs of FastComp developers, since they were the only available users, because the development of FastComp is not finished yet. Thus, through various and frequent conversations, our GUI was idealized based on the needs of the FastComp creators, and so the main aspects to focus on were determined and the first version of the GUI was developed, always taking its usability into account.
Usability understands five components, according to Nielsen [14]: learn-ability, memorlearn-ability, efficiency, security and satisfaction. Preece et al [13] also mention effectiveness and utility. The seven components inherent to the term usability are then:
– Learnability. It refers to how easy it is to learn how to use the in-terface. Nobody likes to spend a lot of time learning how to use something; everybody likes to start working with the product im-mediately.
– Memorability. It refers to how easily the users will remember how to use the interface after learning it. If the operations to learn are illogical, obscure or with a poor sequence of steps, the users tend to forget what to do if they do not use the interface very often. – Efficiency. It measures the time the user takes to handle his tasks,
that is, it measures the productivity level.
– Security. It involves protecting the user from dangerous conditions and undesirable situations. The interface has to prevent its user from making errors, reducing, for example, the risk of activating wrong commands, and it needs to present means of recovery in case some error is made. In the cases where it is not possible to hinder the occurrence of errors, mechanisms of information and correction must be activated. For example, the introduction of the number 100 in a textbox where it would have to appear a number lesser than 90, must originate an immediate message specifying the error of the action and activating the introduction of a new value in that box. – Satisfaction. It measures how much the users appreciate the
inter-face.
– Effectiveness. It measures the adequacy of the interface, if it allows the correct accomplishment of what it is supposed to.
– Utility. It refers to the capacity of the interface to present the right functionalities so that the user reaches its final goal.
Preece et al [13] also introduce in usability some design principles: – Visibility. The comprehension of an interface depends, among others
things, of the order, the positioning and the distinction of the objects used (images, text, buttons, etc.), because the users will apprehend the different items more easily if they are presented in an organized and visible way. Visibility also embraces adequate localization and size of the considered items.
– Feedback. The interface must react to the user’s actions. For exam-ple, when pressing a button one expects a certain functionality to be activated and a response time appropriate and consistent with the involved functionality. However, if the response time is expected to be long, then the cursor may be transformed into a sandglass, for example, until the response is obtained, informing the user that his action had a reaction.
– Constraints. Constraining refers to determining ways of restricting the user’s interaction at a given moment. In GUIs it is common to deactivate certain options, restricting the user to the actions al-lowed at that stage. One of the advantages of these constraints is
Figure 2: Separator tab of our GUI to input the materials properties to be considered by FastComp
to prevent the user from selecting an incorrect option and thus to reduce the risk of errors.
– Consistency. Similar operations must have similar processes. If in a window a blue button opens a document and a red one saves it, then in the following window the blue button can show an image and the red one save it, for example. A consistent interface is easier to learn and use.
– Affordance. It refers to the attributes of an object that allow a user to know how to use it. For example, a blank field suggests writing in it, whereas a button with relief means “click here”.
Although these twelve components are very important characteristics to take into account when developing an interface, its purpose is of the most importance. When questioned on the most important factor in us-ability, Jakob Nielsen answered [15] “Is really to understand the users’ tasks and the things they are trying to accomplish because if you are solving the wrong problem you may have a great solution but, at the end of the day, be helping no one.” In other words, an interface that does not adequately respond to its requirements is good for what?
Thus, taking into consideration the components of usability, in order to make our interface easy to learn and to memorize, we chose a simple layout to parameterize FastComp. A single window is shown divided in five separator tabs, each one referring to different data domains: types of materials, figure 2; laminate structure, figure 3; plate geometry, figure 4; loads applied to the bolt and to the plates, figure 5; and failure options and selection of the desired output results, figure 6.
The images included in the separator tabs Joint geometry and Load case, figures 4 and 5, were inserted to help a less experienced user to understand the requested data. These images are interactive: using the
Figure 3: Separator tab of our GUI to input the laminate characteristics to be considered by FastComp
Figure 4: Separator tab of our GUI to input the geometry of the joint to be considered by FastComp
Figure 5: Separator tab of our GUI to input the loads applied to the plates and bolt to be considered by FastComp
Figure 6: Separator tab of our GUI to select the failure criterion to be considered by FastComp and the desired output data
mouse buttons the user can zoom in and out and rotate the 3D images in any direction. Also, all the input fields have a detailed description shown when the mouse cursor passes on top of each one of them.
To have a secure interface, preventing the user from making errors, safety issues were addressed, such as not placing two buttons very close together to avoid pressing the wrong one by mistake, and providing, when imperative, confirmatory dialog boxes (such as “Are you sure you want to quit?”) that give the user another possibility to consider his intentions. All the data input fields are protected against invalid data values or data format. In the Number of plies field (figure 3), for example, if the user does not write an integer value between 4 and 16 or leaves the textbox in blank, an error message is displayed and the cursor automatically appears in that textbox. This data validation happens in real-time so that it is not even possible to leave the textbox while it is not correctly filled in.
As for efficiency, effectiveness and utility, we tried to have the users to carry out only a few simple steps to obtain the correct results using appropriate steps.
We tried to provide our GUI with a pleasant design, because no matter how efficient and useful an interface is, its appearance is what the users first react to.
As mentioned before, the more visible and organized items are, the more likely users will be able to know what to do next. Thus, we tried to organize all the items in a logical way and did not use character fonts that are difficult to read.
Regarding feedback, if a button is pressed or a menu item selected there is always a reaction by our GUI; and in the time between the user’s action and the interface response a sandglass mouse pointer is shown assuring the user that his action had a reaction. Also, self explaining messages appear in a panel, placed on the bottom of the mother window,
Figure 7: File with the stress fields calculated by FastComp
describing the processes that are taking place, so that the user is always informed of the reactions of the interface.
As for constraints, button Run (figure 6), for example, used to generate the input file and run the FastComp program, can only be pressed if all the necessary input textboxes are filled in with valid data. Also, the menu items that graphically display the results obtained from FastComp are deactivated until FastComp creates its output files.
We tried to make all the steps in our GUI as consistent as possible, and where careful with the attributes of all the items. For example, a white textbox can be written on but a beige one can not; a button with red text can be clicked on but one with beige text can not.
As mentioned above, FastComp generates three files: one with the failure data, another with the strain distribution, and a last one with the stress fields calculated for the four first plies of the laminate1, figure 7.
As soon as FastComp execution ends, the interface pops up a new win-dow showing the obtained results on failure mode and failure load, figure 8, and the Output menu is then enabled. This menu allows the visualization of, for example, the stress field in the yy axis direction. Thus, selecting s22 in the Output menu, figure 9, a method is activated that reads the file with the stress field data generated by FastComp, stores the relevant
Figure 8: Window of our GUI with FastComp’s results relative to failure mode and failure load of the laminate in analysis
Figure 9: Menu of our GUI for the visualization of the graphical results obtained using FastComp
values in appropriate variables and processes the data visualization using VTK.
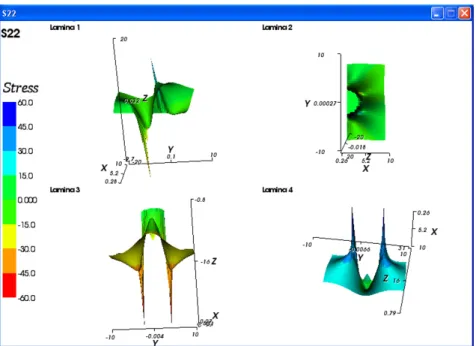
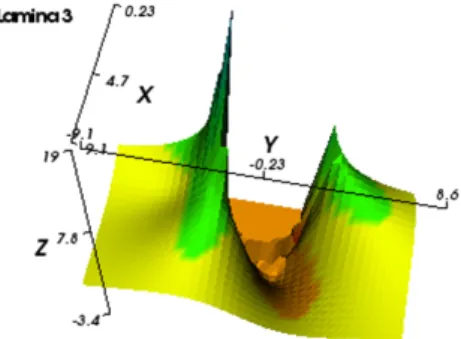
More precisely, the third, fourth and sixth columns of the stress field file are stored in four (one for each ply) arrays of 3D points. These ar-rays are objects of the type vtkPoints, a class from the VTK library that represents three-dimensional points. These points are then transformed into vertexes using a vtkCellArray object. These two objects are grouped in one by the vtkPolyData class, whose data are then triangulated using the vtkDelaunay2D2 filter (figure 10), [8]. Finally, the four independent
surfaces are displayed in an output window, figure 11. Figure 12 shows the results obtained for the shear strains in lamina (ply) 3.
4
Evaluation
Any user wants systems that are easy to learn and to use, efficient, effective and safe. To know if all these requirements are satisfied, it is necessary to evaluate the developed interface.
Figure 10: Schema of the transformation of 3D points into a triangulated surface using VTK classes
Figure 11: Graphical visualization of the output data obtained from Fast-Comp concerning the stress field along the yy axis direction
Figure 12: Graphical visualization of the output data obtained from Fast-Comp concerning the shear strain field for lamina 3
While implementing an interface, developers must not assume that users think like them, nor presume that the fact that they followed all the existing rules for the excellent execution of an interface is guarantee of good usability. Evaluation is always necessary to verify if the users like and know how to use the interface.
As already mentioned, it is necessary to evaluate an interface dur-ing the whole development process, and not just at its terminus. On the contrary: sometimes, the software developer needs answers to certain questions as to verify if his ideas meet the users’ needs and wills. Thus, evaluation guides the whole process of developing an interface.
During the first stages of development, the main goals of the eval-uation of an interface are the prediction of usability, the perception of users’ requirements and the informal test of the adopted design. Only later, they concentrate on identifying the users’ difficulties. In our case, because we had some time constraints, evaluation was only possible after the development of the GUI presented in this paper.
Nielsen [16] says that only five evaluators are needed to test an in-terface. However, we used eight evaluators: five that will use FastComp in the near future and three that probably will not but know what the software is about.
The method of evaluation adopted in this work was a questionnaire that we developed and distributed together with the interface to the users who individually evaluated it in their usual work environment.
Different users demand different interface behaviour and appearance. For example, young users usually prefer a GUI rich in extra options, like the possibility to modify the colours of a chart, while older ones generally prefer a simpler and sober interface which sticks to the strictly necessary so they do not get distracted during its use. Similarly, users with more knowledge and experience in the area the interface was developed for must be more critic than users who know little or nothing about that domain. These last ones will probably be more interested in the graphical
aspects of the interface, while the previous ones will be judging more its effectiveness, efficiency and utility.
It is because of these differences between users that the first ten ques-tions of our questionnaire were aimed to define and characterize the user in terms of age, sex, academic qualifications, area of work and experience, theoretical and practical knowledge on composite materials and experi-ence in the use of computers and GUIs.
The next five questions of our questionnaire asked the user to evaluate and specify the difficulties he came across when using each of the separator tabs included in the input data window (figures 2 to 6). The purpose of those questions was to identify possible improvements in items disposition and terminology.
The two following questions asked the user to evaluate if the two im-ages included in the input data window (figures 4 and 5) served their purpose, which was to help the user understanding what the requested data mean.
The next two questions intended to define the user’s difficulties us-ing the Output menu and understandus-ing the visualization of the results obtained from the FastComp tool.
The main purpose of the following question was to characterize the utility of the cartesian axes included in the graphical visualization of the output data (figures 11 and 12).
The goal of the next three questions was the evaluation of the devel-oped interface in more general terms. Thus, the first question character-ized the user’s difficulties using our interface; the second one asked the user to classify the interface aesthetically; and the third question asked for a general classification, accounting for all good and bad aspects identified in our interface.
Finally, the last question on the evaluation questionnaire allowed the user to make any free suggestion/critique to improve the GUI developed so far.
4.1
Results
All the eight users inquired were male and worked in mechanical engi-neering and only two were more than 30 years old. Five of the users had good theoretical knowledge on composite materials, but only four of those five had work experience with these materials. The other three had little knowledge on composite materials. However, their evaluation has been considered as well, mainly for the purpose of design evaluation, be-cause, as already referred, users with less knowledge in the area give more relevance to graphical aspects. All of the eight evaluators use computer systems frequently, and are familiar with the use of GUIs.
Analysing the results of the questionnaire [17] it can be concluded that the use of the input data window was not a problem for the users. Two of them encountered some difficulties but did not specify which ones.
Three of the eight users agreed that the images included in separator tabs Joint geometry and Load case are not relevant to understand the input data, but did not explain why. Perhaps this opinion relates to the fact that those users have good knowledge on composite materials and, therefore, do not need any extra aid in the understanding of the required data.
In general, the interface input data window seemed to satisfy all the evaluators.
Three users said not to understand entirely the visualization of the results, but did not specify why. However, one of them suggested the enlargement of the visualization windows, because, he said, it was difficult to perceive the displayed numerical values. This problem is probably due to the reduced size of the monitor he used and can be solved in the future by implementing the option of visualizing in independent windows each one of the surfaces built to display the results obtained by FastComp.
Two of the users inquired for the evaluation of our interface did not like the cartesian axes included in the graphical visualization of the stress/s-train fields. In a future version of the GUI, representation of those axes should be optional.
Some users suggested a few alterations to the developed interface: – To have in separator tab Materials the possibility to select
prede-fined materials.
– To present a description of the way the mouse buttons interact with the displayed images.
– To identify the acronyms s11, s22, etc., used in the Output menu (figure 9).
From 1 to 5, the interface scored an average value of 4.75 for aesthetic classification and 4.63 for general classification.
5
Conclusions and Future Work
VTK revealed itself to be an adequate graphical data, visualization and image processing library to easily develop a visualization application. On the other hand, C# is a language of great potential. The junction of these technologies, achieved by the wrapper for the .NET languages that we used, is capable of originating adequate and extremely efficient visu-alization interfaces, without neglecting all the aspects inherent to a good human-computer interaction.
The analysis of the results obtained in the evaluation of the developed GUI allowed the detection of some new necessities, like the consideration of some predefined materials or the option to visualize each surface rep-resentative of the results in independent windows. Out of the same anal-ysis, we can also conclude that the so far developed GUI is efficient and
represents an adequate human-computer interaction for the FastComp computational tool.
After the required alterations to the GUI, users should be asked to give an opinion again. Brainstorming can be a useful technique to identify the users’ perspective on aspects of the designed interface, as, for example, the arrangement of the items or the terminology employed in them. After a new reformulation of the GUI, for an even more complete evaluation, the users should be given concrete tasks so that specific issues of the interface can be correctly evaluated. As there will always be evaluators that do not specify their difficulties in detail, the collection of opinion should not only be made by means of a questionnaire but also by personal interviews so that all doubts are clarified.
References
[1] Thomas A. DeFanti, Manine D. Brown and Bruce H. McCormick. Visualization: Expanding Scientific and Engineering Research Op-portunities. 1989. Computer, Vol 22, Issue 8, pp 12-16, ISSN 0018-9162.
[2] Pedro Portela and Ant´onio Melro. FastComp: Strength Prediction of Composite Laminates Containing Stress Concentrations Using Com-plex Variable Theory. 2004. Report, Faculty of Engineering of the University of Porto, Portugal.
[3] Will Schroeder, Ken Martin and Bill Lorensen. The Visualization Toolkit. 2004. Kitware, Inc., third edition, ISBN 1-930934-12-2. [4] John Sharp and Jon Jagger. Microsoft Visual C# .NET Step by Step:
Version 2003. 2003. Microsoft Press, Redmond, ISBN 0-7356-1909-3. [5] William J. Schroeder, Lisa S. Avila and William Hoffman. Visual-izing with VTK: A Tutorial. 2000. IEEE Computer Graphics and Applications, Vol 20, Issue 5, pp 20-27, ISSN 0272-1716.
[6] Milan Frank. VTK for .NET Platform. 2003. MSc Thesis, University of West Bohemia, Czech Republic.
[7] Charles Petzold. Programming Microsoft Windows with C#. 2002. Microsoft Press, Redmond, ISBN 0-7356-1370-2.
[8] Will Schroeder and Ken Martin. The VTK User’s Guide. 2003. Kit-ware, Inc., ISBN 1-930934-08-4.
[9] Autar K. Kaw and Gary Willenbring. A Software Tool for Mechanics of Composite Materials. 1997. International Journal of Engineering Education, Vol 13, Issue 6, pp 433-441, ISSN 0949-149X.
[10] B. G. Prakash. AUTOLAY - a GUI-Based Design and Development Software for Laminated Composite Components. 1999. Computers and Graphics, Vol 23, Issue 1, pp 95-110, ISSN 0097-8493.
[11] Markku Palanter¨a. Specialized Software Tools for the Design of Com-posite Structures. 2002. Proceedings of the 20th CAD-FEM Users’ Meeting 2002, Friedrichshafen, Germany.
[12] Carlos G. D´avila and Pedro P. Camanho. Failure Criteria for FRP Laminates in Plane Stress. 2003. NASA/TM-2003-212663. National Aeronautics and Space Administration, Hampton, USA.
[13] Jennifer Preece, Yvonne Rogers and Helen Sharp. Interaction De-sign: Beyond Human-Computer Interaction. 2002. John Wiley & Sons, Inc., New York, ISBN 0-471-49278-7.
[14] Jakob Nielsen. Usability Engineering. 1993. Morgan Kaufmann, San Francisco, ISBN 0-12-518406-9.
[15] Dan Oliver. Jakob Nielsen Told Me to Do it. 2002. .net magazine, Issue 93.
[16] Jakob Nielsen. Why You Only Need to Test With 5 Users. 2000. Jakob Nielsen’s Alertbox. Available on line from www.useit.com/ alertbox/20000319.html
[17] Patr´ıcia C. T. Gon¸calves. Desenvolvimento de uma Interface Gr´afica para o Programa FastComp. 2005. MSc Thesis, Faculty of Engineer-ing of the University of Porto, Portugal.