Printed version ISSN 0001-3765 / Online version ISSN 1678-2690 http://dx.doi.org/10.1590/0001-3765201820170721
www.scielo.br/aabc | www.fb.com/aabcjournal
The characterization and comparison of exopolysaccharides from two
benthic diatoms with different biofilm formation abilities
CUILI JIN1,2
, ZHAOWEI YU1
, SHUYA PENG1
, KE FENG1
, LIKUI ZHANG1,2
and XIAOJIAN ZHOU1,2
1
College of Environmental Science & Engineering, Yangzhou University,196# of Huayang West Street, Hanjiang District, Yangzhou City, 225127 Jiangsu Province, China 2
Marine Science & Technology Institute, Yangzhou University,196# of Huayang West Street, Hanjiang District, Yangzhou City, 225127 Jiangsu Province, China
Manuscript received on September 13, 2017; accepted for publication on December 2, 2017
ABSTRACT
Exopolysaccharide (EPS) of two benthic diatoms, Amphora sp. and Stauroneis sp., with different biofilm formation abilities were investigated. The ratio of suspension-cells/biofilm-cells was employed to indicate the diatom biofilm formation abilities. The soluble EPS from the supernatant of whole culture, tightly bound EPS from floating cells, loosely and tightly bound EPS from biofilm cells were fractionated as SL-EPS, F-TB-EPS, BF-LB-EPS and BF-TB-EPS, respectively. The analysis for productions and monosaccharide compositions indicated that EPS from two diatoms were different in terms of the productions, distributions,
and monomer compositions. Amphora sp. produced more (1.5-fold) total exopolysaccharides, but less (<0.4-fold) BF-TB-EPS than Stauroneis sp. The monosaccharides of the EPS from Amphora sp. were more diverse than those of Stauroneis sp., with 13 and 10 monomers, respectively. Neutral sugars, Glc, Xyl and Man, were abundant in Stauroneis sp., while Gal, Glc and Xyl were rich in Amphora sp. Uronic acid and hexosamine were present in all fractions of two diatoms, especially Glc-A being the most abundant
monomer in SL-EPS of Amphora sp. It was proposed that the high content of uronic acid (especially
Glc-A) might be crucial for the strong biofilm formation abilities of Amphora sp.
Key words: benthic diatom, EPS, biofilm formation ability, monosaccharide composition, Glc-A.
Correspondence to: Xiaojian Zhou E-mail: [email protected]
INTRODUCTION
The attachment and growth of unwanted living organisms on man-made surfaces are referred to as biofouling (Townsin 2003, Fusetani 2004, Kristensen et al. 2008, Jin et al. 2014). Marine biofouling is an extensive phenomenon that causes
large losses worldwide (Mol et al. 2009). Biofilm
is generally classified into micro-fouling and is
usually caused by bacteria and diatoms (Kristensen et al. 2008). Biofilm plays a crucial role in the attachment and subsequent growth of macro-organisms, which further leads to the formation of a complex biofouling community (Hoagland et al. 1993). Diatoms are always the major components in these biofilms, as long as light reaches the
habitats (Vivanco et al. 2012, Leflaive et al. 2011a,
Due to the development of microscopy techniques, there have been many reports on the characteristics of benthic diatom algae, including the cell microstructures, extracellular polymeric substances composition and excretion site,
locomotion route, and biofilm formation abilities (Daniel et al. 1980, Lind et al. 1997, Higgins et
al. 2002, Arce et al. 2004, Villacorte et al. 2015). Diatoms produce large quantities of extracellular polymeric substances during all phases of growth in water environments (Vesna et al. 2013, Ai et al. 2015). Extracellular polymeric substances were produced via a number of approaches, including excretion, secretion, sorption and cell lysis, and represented a heterogeneous polymer that mainly consisted of polysaccharides with a certain amount of proteins, lipids and humic substances (Sheng et al. 2010, Tansel et al. 2013).
Polysaccharides, as predominant components in these polymeric substances, are referred to as exopolysaccharides (EPS) (Vesna et al. 2013, Ai et al. 2015). EPS produced by diatoms are increasingly being studied because of the multiple functions of these biopolymers in aquatic systems, including: impacting the aggregation rate of particles and,
hence, influencing the flux of organic carbon
to deep waters; protecting against desiccation in
intertidal flats; aiding in colony formation; and
favoring loose symbiosis with bacteria (Magaletti et al. 2004, Aslam et al. 2012). EPS are essential parts of gliding locomotion, habitat aggregation and fouling capability, especially for benthic diatom species (Magaletti et al. 2004). Diatom
cells form biofilm on a wide range of surfaces by
continuous secretion of adhesive mucilage (Higgins et al. 2002). The layer of EPS coating the frustule and entirely encapsulating cells of Achnanthes
longipes and Cymbella cistula was shown to
have a significant role in initial cell attachment
and subsequent interactions with the environment (Wang et al. 2000). People have widely accepted that EPS are the key component for the attachment
of diatom cells to the substratum beneath water. The contents and compositions of EPS are believed
to exhibit substantial effects on biofilm formation
of diatoms (Yang et al. 2008).
Traditionally, EPS of algae have usually been investigated as a whole unit without any fractions. Recently, EPS were fractionated into soluble EPS
(SL-EPS) and bound EPS based on its relationship
with cells (Ai et al. 2015, Yang et al. 2008). In fact, bound EPS, with a dynamic double-layered structure, could be further divided into loosely
bound EPS (LB-EPS) and tightly bound EPS
(TB-EPS) (Xu et al. 2013). Although the heterogeneity of soluble and bound EPS of diatoms has been widely investigated, the detailed information of EPS fractionations close to the cells (TB-EPS) of diatom, which was believed to be extremely
important for diatom biofilm formation ability, is
not clear yet (Higgins et al. 2002, Vesna et al. 2013, Villacorte et al. 2015, Magaletti et al. 2004, Arce et al. 2004, Khandeparker and Bhosle 2001, Zhang et al. 2008).
Furthermore, reports on the linkage between
EPS chemical compositions and biofilm formation
of diatom are scarce. Information on the diatom species in the genus Amphora is relatively abundant because they are common fouling diatoms with strong biofilm formation ability (Bhosle et al. 1996). Although many studies are available for fresh water diatoms in the genus Stauroneis, marine species have not received enough research (Burge et al. 2015, Zidarova et al. 2014, Joh et al. 2014,
Atazadeh et al. 2014). Since the biofilm formation
ability of marine Stauroneis sp. is significantly weaker than that of Amphora sp., the comparison of their EPS, especially the characteristics of TB-EPS, may lead to establishment of the linkage between the biofilm formation ability and EPS characteristics of diatoms (Yang et al. 2008).
In this study, two benthic diatoms, Amphora
sp. and Stauroneis sp., were selected because of
The suspension part was carefully removed. With the addition of a certain volume of ASW into the
flask, diatom cells in the biofilm were carefully
brushed down and fully mixed.
THE FRACTIONATION OF ALGAL EPS AND THE MEASUREMENT OF CELL WEIGHTS
The EPS fractionation procedure followed the methods described by Xu et al. (2013). The suspension part of diatom culture was carefully separated, fully mixed by dramatic shaking, and centrifuged at 4000 rpm for 20 min. The supernatant
was collected to measure SL-EPS, representing the
fraction that could be removed by soft perturbation. The harvested pellets were re-suspended in ASW and heated at 40°C overnight, followed by three additions of ASW and centrifugation at 4000 rpm for 20 min. The supernatants were gathered to
measure the TB-EPS of floating cells (F-TB-EPS),
representing the fraction that was tightly bound to
floating cells. The leftover pellets were placed into
a 100°C oven and heated to a constant weight to
measure the weight of floating cells. For the biofilm
part, cells were re-suspended in ASW, fully mixed by shaking, and centrifuged at 4000 rpm for 20 min. The supernatant was collected to measure the
LB-EPS in biofilm (BF-LB-EPS), representing the fraction that was loosely bound to the biofilm cells.
The pellets were treated in the same manner as those for F-TB-EPS. The supernatant was collected
to measure the TB-EPS of the biofilm cells
(BF-TB-EPS), representing the fraction that was tightly bound to the biofilm cells. Then, the left over pellets were heated at 100°C to a constant weight
to measure the weight of the biofilm cells.
All of the samples of the EPS fraction were precipitated with a 3-fold volume of ethanol. The solution was allowed to stand overnight in the refrigerator (4°C). The final precipitate was collected by centrifugation and washed with acetone and dichloromethane to obtain crude EPS. Crude EPS was dried under a flow of nitrogen The main aims of the present study were to: 1.
investigate the differences of EPS between two diatom species; 2. investigate the EPS distribution using the fractional procedure; and 3. explore the
possible correlations between biofilm formation
abilities and EPS.
MATERIALS AND METHODS
DIATOM CULTURE
Two benthic diatoms, Amphora sp. and Stauroneis
sp. wereobtained from the Key Laboratory of the Ministry of Education for Marine Aquaculture, Ocean University of China.
The diatoms were maintained in 250-ml Erlenmeyer flasks in artificial seawater (ASW) based on Guillard’s f/2 culture medium (Guillard and Ryther 1962) in a temperature-controlled chamber at 23°C under controlled illumination
(100 μmol photons m-2
s-1 provided by cool-white
fluorescent lamps with a 12 h:12 h light:dark cycle). Prior to assaying, diatom films were collected from the culture flask. Cells were suspended in ASW,
washed with ASW by centrifugation (4000 rpm) twice, and re-suspended in ASW. Cell density was then adjusted to around 1×10⁵ cells ml-1 using a hemocytometer under microscope. The diatom
culture experiments were run in 2-L triangular flasks. Each flask contained 1350 ml of sterilized
f/2 medium and 150 ml of diatom suspensions. Flasks with at least triplicates were incubated for
39 days at 23°C with 100 μmol photons m-2
s-1 and a 12 h:12 h light:dark cycle.
PARTITION OF CELLS IN SUSPENSION AND BIOFILM IN DIATOM CULTURES
At the end of the culture, all of the flasks were
shaken on a shaker at 70 rpm for 10 min. The culture was separated into two parts: the suspension part, in
gas and subsequently stored dry at -20°C before further analysis. The weight of each EPS sample was measured.
THE PURIFICATION OF EPS
Crude EPS was deproteinated by the Sevag method
(Liang et al. 2013). Crude EPS was dissolved in
distilled water. Sevag reagent (chloroform:n-butyl alcohol=4:1, v/v) was added into the crude EPS solutions (1:5, v/v) to remove protein with multiple replications. The deproteinated EPS was then desalted by dialysis (3.5 kDa). Finally, purified EPS was obtained by rotary evaporation and
freeze-drying for further experiments (Liang et al. 2013).
DETERMINATION OF MONOSACCHARIDE COMPOSITIONS
The monosaccharide compositions of EPS
were determined by High Performance Liquid Chromatography (HPLC) after derivatization with
1-phenyl-3- methyl-5-pyrazolone (PMP) (Wang
et al. 2015). Briefly, 5 mg of a freeze-dried and purified EPS sample was dispersed in 1.0 mL of 2 mol L-1 trifluoroace-ticacid (TFA) and hydrolysed
for 4.5 h at 120°C. After hydrolysis, TFA was removed by rotary evaporation with the repeated addition of methanol. Then, the dried sample was dissolved in distilled water and transferred to a
clean PE tube, followed by the addition of 100 μl of a 0.3 mol L-1 NaOH solution and 120 μl of a
0.59 mol L-1 PMP methanolic solution. The PE tube
was sealed, packed with silver paper, and kept in a
water bath for 1 h at 70°C. Then, 100 μl of 0.3 mol L-1
HCl was added for neutralization. The resulting mixture was extracted by chloroform three times to remove excessive PMP. Then, the aqueous phase was centrifuged at 3500 rpm for 10 min to remove insoluble substances. The supernatant was
subjected to HPLC analysis. All of the standard
monosaccharides (Aladdin Industrial Corporation) were converted to their PMP derivatives following
the method previously described for the EPS samples (Wang et al. 2015).
The presence and concentrations of PMP-monosaccharides in samples were identified
on HPLC profiles by comparing the retention
times and peak areas with those for 11 standard monosaccharides, including mannose (Man), glucuronic acid (Glc-A), N-acetyl-D-glucosamine (Glc-NAc), xylose (Xyl), galactose (Gal), arabinose (Ara), fucose (Fuc), glucose (Glc), galacturonic acid (Gal-A), rhamnose (Rha) and glucosamine hydrochloride (GlcN).
The HPLC system (L2000, Hitachi, Japan) was equipped with a diode array detector (DAD, L-2455,
Hitachi, Japan) installed in tandem at the outlet of
the column (LaChrom, ODS C18, 5 µm, 4.6 mm × 250 mm, Hitachi, Japan) and mounted with an ODS pre-column. The solvents used were 83% methanol and a 17% potassium dihydrogen phosphate–
sodium hydroxide buffer solution (0.1 M, pH 8.6) at a fixed flow rate of 0.7 ml min−1 at 25°C. A volume
of 10 µl of the sample was injected into the column
using an autosampler (L-2200, Hitachi, Japan). The UV absorption at λ =245 nm was detected. HPLC
analyses were performed at least twice for each sample.
DATA ANALYSIS METHOD
The monosaccharide ratio was employed to describe the sugar composition of each EPS sample (Yang et al. 2005). The correction factors (f1/2) and molar ratios (R1/2) were calculated by the following two equations, respectively:
f1/2=(A2/m2)/(A1/m1),
R1/2=f1/2×(A1’/A2’),
solution, and A1’ and A2’ were the peak area values for the component monosaccharide of the tested samples (Yang et al. 2005). The mole percentage of each monosaccharide was calculated based on
its molar ratio against all of the other identified
monosaccharides from the EPS samples. All of the calculations were performed with at least triplicate samples. Student’s paired t-tests were performed to
investigate the significant differences between the
mole percentages for hexosamines+uronic acids, hexosamines, uronic acids, or Glc-A in the EPS from two diatoms at levels of p=0.01 and p=0.1.
RESULTS
CELL DISTRIBUTION OF TWO SPECIES OF DIATOM
Through the partition method, most cells (79.97%)
of Amphora sp. were embedded in the biofilm
attached to the bottom of a flask, and 20.03% of the
cells were distributed in the suspension. The ratio
of the suspension/biofilm for Amphora sp. was 0.25 (Table I). In the case of Stauroneis sp., 57.61% of
the cells were floating in the culture system and 42.39% of the cells were embedded in the biofilm attached to the bottom of the flask (Table I). The ratio of the suspension/biofilm of Stauroneis sp.
was 1.36, indicating that there were fewer
biofilm-forming cells than floating cells. Therefore, in
terms of biofilm formation ability, Stauroneis sp. was obviously lower than Amphora sp. under natural conditions.
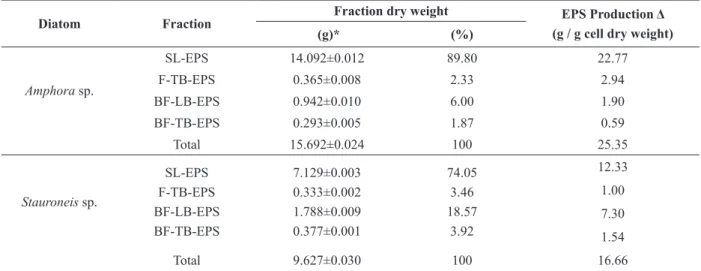
EPS PRODUCTION AND DISTRIBUTION OF TWO SPECIES OF DIATOM
The productivity of the EPS of two diatom species
was different (Table II). For the diatom Amphora
sp., the total production per dry weight (sum of EPS fractions/dry weight of cells, g/g) was 25.35. The production of the EPS of Stauroneis sp. was 16.66. The productivity of Amphora sp. was 1.5 times that of Stauroneis sp. As shown in Table II, the production of BF-TB-EPS per dry weight
(BF-TB-EPS fraction/dry weight of biofilm cells,
g/g) of Amphora sp. was 0.59, lower than that of
Stauroneis sp. by 40% (1.54).
Among all of the fractions, SL-EPS occurred
at the highest levels for both diatoms (Table II). The
percentages of SL-EPS were 89.80% and 74.05%
in Amphora sp. and Stauroneis sp., respectively.
BF-LB-EPS was observed as the second rank, with
percentages of 6.00% in Amphora sp. and 18.57% in Stauroneis sp. TB-EPS from biofilm and floating
cells occurred at the lowest levels for both diatom species.
MONOSACCHARIDE DIVERSITIES OF EPS FROM TWO SPECIES OF DIATOM
The hydrolysis and HPLC analysis of the different
EPS fractions of Stauroneis sp. yielded a suite of
9 identified monosaccharides: Man, GlcN, Rha,
Glc-A, Glc-NAc, Glc, Gal, Xyl and Fuc, which
were present in different peaks on their HPLC
TABLE I
The cell distributions in suspensions and biofilms of the diatoms Amphora sp. and Stauroneis sp.
Diatom Cell distribution
Cell dry weight
(g) * (%)
Amphora sp.
Suspension 0.124±0.008 20.03
Biofilm 0.495±0.001 79.97
Suspension/Biofilm 0.25
Stauroneis sp.
Suspension 0.333±0.003 57.61
Biofilm 0.245±0.014 42.39
Suspension/Biofilm 1.36
Figure 1 - The HPLC profiles of monosaccharides in different EPS fraction samples from two diatoms. Samples were analysed under the same HPLC conditions and labelled on top right of the obtained HPLC profiles. In sequence, peaks 1-11
represented the monosaccharides of Man, GlcN, Rha, Glc-A, Gal-A, Glc-NAC, Glc,
Gal, Xyl, Ara, and Fuc, which were confirmed by comparing the retention times and UV profiles with those of the standards in the first HPLC profiles. Peaks U1-U4
profiles (Fig. 1). Among them, Rha only existed
in F-TB-EPS and BF-TB-EPS. There was an unknown peak (U1) before Glc-A in all fractions, except that of F-TB-EPS.
Compared to Stauroneis sp., the diversity of the monosaccharide compositions for Amphora
sp. were more abundant. Except for the above 9 identified monomers, Gal-A and 4 unknown monomers (U1, U2, U3, and U4 in Fig. 1) were detected. Different from Stauroneis sp., Rha existed
in all EPS factions except for SL-EPS. Two diatoms shared the unknown peak before Glc-A (U1). The monomer of Ara was not detected in any of the EPS samples from the two diatom species.
MONOSACCHARIDE COMPOSITIONS OF
DIFFERENT EPS FRACTIONS FROM THE DIATOM
Amphora sp.
Based on the HPLC profiles of various EPS
fractions of Amphora sp., the mole percentages of
the identified monosaccharides were calculated and shown in Fig. 2. For SL-EPS of Amphora sp., which was produced by all of the diatom cells throughout the culture system, the acidic monosaccharide of
Glc-A was the most abundant monosaccharide
in this fraction, followed by Xyl and Gal, with
mole percentages larger than 10% (Fig. 2a). Fuc,
Man, GlcN, Glc-NAC, Glc, Gal-A, and Rha each
accounted for mole percentages of less than 5%.
In F-TB-EPS of Amphora sp., Xyl was the most
abundant monomer in floating cells, followed by
monomers of GlcN, Glc, Gal, Glc-A and Man,
which had mole percentages over 10% (Fig. 2b).
Rha, Glc-NAC and Fuc were detected with mole
percentages of less than 10%, and Gal-A was almost
undetectable in F-TB-EPS of Amphora sp. The
BF-LB-EPS from Amphora sp. was slightly enriched in Gal, which was closely followed by Glc, Xyl, Man,
Rha and GlcN. Glc-NAC, Fuc, and Gal-A achieved
low contents, with mole percentages lower than 5%
(Fig. 2c). In BF-TB-EPS of Amphora sp., Glc was
abundant in biofilm cells, closely followed by Gal,
Glc-A, Man and Rha, with mole percentages over
10% (Fig. 2d). Mole percentages lower than 10%
were observed for Glc-N, Xyl, Fuc, and Glc-NAC,
and Gal-A was almost undetectable. TABLE II
Distribution and production of EPS from the diatoms Amphora sp. and Stauroneis sp.
Diatom Fraction Fraction dry weight EPS Production Δ
(g / g cell dry weight)
(g)* (%)
Amphora sp.
SL-EPS 14.092±0.012 89.80 22.77
F-TB-EPS 0.365±0.008 2.33 2.94
BF-LB-EPS 0.942±0.010 6.00 1.90
BF-TB-EPS 0.293±0.005 1.87 0.59
Total 15.692±0.024 100 25.35
Stauroneis sp.
SL-EPS
F-TB-EPS
BF-LB-EPS
BF-TB-EPS
7.129±0.003 0.333±0.002 1.788±0.009 0.377±0.001
74.05 3.46 18.57
3.92
12.33 1.00 7.30 1.54
Total 9.627±0.030 100 16.66
*The dry weights of at least triplicate fractions were independently measured, and the means and standard deviations are shown.
MONOSACCHARIDE COMPOSITIONS OF
DIFFERENT EPS FRACTIONS FROM THE DIATOM
Stauroneis sp.
The mole percentages of monosaccharides of
Stauroneis sp. were calculated and shown in Fig.
3. Gal-A was absent in all EPS samples from
Stauroneis sp. For SL-EPS of Stauroneis sp., Xyl
was the most abundant, followed by Gal, Man,
Glc-A, and GlcN, with mole percentages higher
than 10% (Fig. 3a). Fuc, Glc, Glc-NAC and Rha
each achieved mole percentages less than 10%. Glc
was the most abundant monosaccharide of TB-EPS,
both in floating cells ( Fig. 3b) and in biofilm cells
(Fig. 3d). Following Glc, monomers of Gal, Rha, Figure 2 - The monosaccharides compositions in terms of mole percentages for
EPS fractions from Amphora sp. The mole percentages were calculated based on
the HPLC peak areas of at least 3 replicated samples, and the means and standard
deviations are shown closed columns and bars, respectively. The unknown monosaccharides were ignored in the mole percentage calculations. a, b, c, and
d represent the samples of SL-EPS, F-TB-EPS, BF-LB-EPS and BF-TB-EPS,
and Glc-A also achieved mole percentages higher
than 10%, while GlcN, Man, Glc-NAC, Fuc, and Xyl were also observed at relatively low contents
in F-TB-EPS (Fig. 3b). Compared to floating cells,
the monosaccharide diversity of BF-TB-EPS was
much simpler. Monomers of Glc, Man and Gal
accounted for 93.70% of the sugars in this fraction
(Fig. 3d). Among these, Glc occurred at the highest
level of 60.98%. The sum of the mole percentages of GlcN, Glc-A, Fuc, Xyl, and Glc-NAC accounted
for 6.30% (Fig. 3d). For BF-LB-EPS from biofilm
cells, each of the 6 monosaccharides, including
Man, GlcN, Glc-NAC, Glc, Gal, and Xyl, occupied
over 10% of the total composition, and Man was Figure 3 - The monosaccharides compositions in terms of mole percentages for
EPS fractions from Stauroneis sp. The mole percentages were calculated based on
the HPLC peak areas of at least 3 replicated samples, and the means and standard
deviations are shown as closed columns and bars, respectively. The unknown monosaccharides were ignored in the mole percentage calculations. a, b, c, and
d represent the samples of SL-EPS, F-TB-EPS, BF-LB-EPS and BF-TB-EPS,
the most abundant monosaccharide. Glc-A and Rha both accounted for mole percentages less than 5% (Fig. 3c).
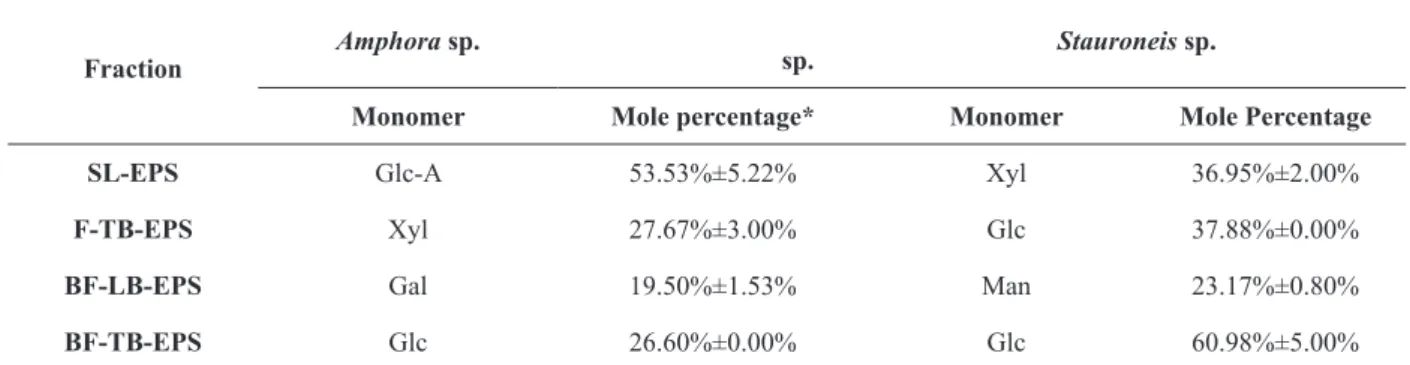
ABUNDANT MONOSACCHARIDES IN DIFFERENT EPS FRACTIONS FROM TWO SPECIES OF DIATOM
The most abundant monosaccharides in different
EPS fractions from two diatom species were quite
different, as summarized in Table III. Glc-A, Xyl,
Gal, and Glc were monomers with highest content in
SL-EPS, F-TB-EPS BF-LB-EPS, and BF-TB-EPS
from Amphora sp., respectively. For Stauroneis sp., Glc was the most abundant monomer in both F-TB-EPS and BF-TB-F-TB-EPS. Xyl and Man were the most
abundant monomers in SL-EPS and BF-LB-EPS,
respectively. In BF-TB-EPS of both diatom species, the most abundant sugar was Glc, particularly in
Stauroneis sp. (60.98%). In all of the EPS samples
from Stauroneis sp., the abundant monosaccharides were always neutral. For Amphora sp., the most
abundant monosaccharide in SL-EPS was Glc-A,
which is an uronic acid. The comparison between the data in Fig. 2 and Fig. 3 indicated that uronic acid and hexosamine were present in larger amounts in Amphora sp. than in Stauroneis sp. For example,
over half of the monosaccharides in SL-EPS of
Amphora sp. were Glc-A, and at the same time,
GlcN occurred at a relatively high level (14.01%) in F-TB-EPS.
HEXOSAMINES AND URONIC ACIDS IN THE EPS OF TWO SPECIES OF DIATOM
Glc-A and Gal-A are uronic acids, while GlcN and Glc-NAC are hexosamines. The mole percentages of above 4 monosaccharides in each EPS fraction from two diatom species were calculated and shown in Fig. 4. In all fractions, the sum of hexosamines and uronic acids of Amphora sp. were higher than that Stauroneis sp., except for BF-LB-EPS (Fig.
4a). The differences between the two diatoms were significant in two fractions of SL-EPS and BF-TB-EPS. For SL-EPS, the sum of hexosamines and
uronic acids accounted for 23.36% in Stauroneis
sp. and 59.01% in Amphora sp. For BF-TB EPS, it was 3.83% in Stauroneis sp. and 24.02% in
Amphora sp.
The amount of hexosamines in BF-LB-EPS and SL-EPS was 27.76% and 11.18% for Stauroneis
sp., while it was 15.18% and 4.50% for Amphora
sp., respectively (Fig. 4b). In the cases of F-TB-EPS and BF-TB-F-TB-EPS, the amount of hexosamines was 9.02% and 1.96% for Stauroneis sp., while 14.83% and 5.07% for Amphora sp., respectively.
The abundance of hexosamines in BF-LB-EPS and SL-EPS were contrary to those in F-TB-EPS and BF-TB-EPS, and also contrary to the biofilm
formation abilities of the two species of diatoms. The contents of uronic acids in each EPS
fraction were also calculated and shown in figure
TABLE III
The most abundant monosaccharides in different EPS fractions from two diatoms.
Fraction
Amphorasp.
sp. Stauroneissp.
Monomer Mole percentage* Monomer Mole Percentage
SL-EPS Glc-A 53.53%±5.22% Xyl 36.95%±2.00%
F-TB-EPS Xyl 27.67%±3.00% Glc 37.88%±0.00%
BF-LB-EPS Gal 19.50%±1.53% Man 23.17%±0.80%
BF-TB-EPS Glc 26.60%±0.00% Glc 60.98%±5.00%
*The mole percentages were calculated from at least three independent HPLC profiles, and the means and standard deviations are
Figure 4 - The mole percentages for hexosamines+uronic acids (a), hexosamines (b), uronic acids (c), and Glc-A (d) in the EPS of Stauroneis sp. (black columns) and Amphora sp. (shadow columns).
The mole percentages were calculated based on the HPLC peak areas of at least 3 replicated samples,
and the means and standard deviations are shown as closed columns and bars, respectively. The
symbols on the brace indicate the significant difference by Student’s paired t-test for the data under
4c. For SL-EPS, F-TB-EPS, BF-LB-EPS, and
BF-TB-EPS, uronic acids accounted for 12.18%, 10.91%, 2.40%, and 1.87% in Stauroneis sp., and 54.14%, 11.89%, 8.80%, and 18.95% in Amphora
sp., respectively. Stauroneis sp. was found having lower uronic acid contents than Amphora sp. in all four types of EPS fractions. The consistent trend that Amphora sp. had stronger biofilm formation
ability and higher uronic acid contents than
Stauroneis sp. was observed.
In addition, two types of uronic acids, Glc-A and Gal-A, were detected in EPS samples from the two diatoms in this study (Fig. 1). Gal-A was found with a lower abundance than Glc-A in Amphora sp., and it was not detected in any of the EPS samples from Stauroneis sp. (Figs. 2 and 3). Representing the major uronic acid, the content of Glc-A was calculated and shown in Fig. 4d. Glc-A was the
only uronic acid identified in Stauroneis sp., and it accounted for the same percentage as that of uronic acids in Stauroneis sp. In the case of Amphora
sp., Glc-A accounted for 53.53%, 11.89%, 8.68%,
and 18.92% in SL-EPS, F-TB-EPS, BF-LB-EPS
and BF-TB-EPS, respectively. Glc-A contents in all fractions from Amphora sp. were higher than those from Stauroneis sp., the differences of which
in three fractions were significant (p<0.01). The trend of a stronger biofilm formation ability and significantly higher content of Glc-A in Amphora
sp. than Stauroneis sp. was observed.
DISCUSSION
Benthic diatoms attached to the bottom of a flask
with different biofilm formation abilities led to different culture statuses. Some diatoms form
biofilms, with most cells embedded in the biofilm at the bottom of a flask, leading to a clear upper
medium. Some diatoms form a uniform culture with a slight biofilm on the bottom of a flask that easily detaches with a soft shake. Although this difference exists, it has not been clearly
distinguished by specific means. Undoubtedly, this difference in biofilm formation ability is crucial for
further diatom researches, such as diatom adhesion strengths, motility rates and EPS viscoelastic properties (Poulsen et al. 2014), and for antidiatom researches, such as the design of novel antifouling coating against heterogeneous diatom settlement (Hunsucker et al. 2016). For this consideration, we
determined the ratio of the suspension/biofilm in this study to quantitatively clarify this difference. For benthic diatoms, the biofilm formation ability
of Amphora sp. was stronger than that of Stauroneis
sp. As for the ratio of the suspension/biofilm, the
value of 0.25 for Amphora sp. was much lower than of 1.36 for Stauroneis sp., and the ratio expressed
this difference clearly and correctly. Compared to
the attempts to use AFM (atomic force microscopy) to assess the stickiness of algae (Villacorte et al. 2015) or to use the pressures of the water jet needed
to remove a biofilm (Hunsucker et al. 2016), the
ratio of the suspension/biofilm found in this
study was used to represent the biofilm formation
ability with cost savings, time savings, and great convenience.
The monosaccharide composition and the products of EPS from diatoms received a great deal of attention, as polysaccharides act as a polymer framework and are the major component of extracellular polymeric substances. EPS are believed to be crucial for a better understanding of the growth and proliferation of diatoms (Khodse and Bhosle 2010). EPS are not only relative to
biofilm formation but also show great importance
to algal motility, protection, macro-aggregate
production, detoxification, and sensitivity to the
environment (Khodse and Bhosle 2010, Franz et al. 2008, Aslam et al. 2012). In this study, EPS of
Stauroneis sp. consisted of 10 monosaccharides:
Man, Glc-A, Glc-NAc, Xyl, Gal, Fuc, Glc, Rha, and GlcN as well as 1 unknown monomer, while EPS
of Amphora sp. consisted of 13 monosaccharides,
The EPS of the two diatoms shared 10 common monomers, and Ara was not detected in the EPS of either diatom. Many studies have reported that the monosaccharide compositions in the EPS of diatoms belong to the genus Amphora. The EPS
of Amphora holsatica, was reportedly composed
of 7 monosaccharides, including Rha, Fuc, Ara,
Xyl, Gal, Glc, and UrAc (Leandro et al. 2003).
The EPS of Amphora coffeaeformis contained 8 monosaccharides, including Rha, Fuc, Rib, Ara, Xyl, Man, Gal and Glc, among which Glc was the most abundant (81%) (Bhosle et al. 1996). Hot water-insoluble/hot 0.5 M NaHCO3-soluble anionic polysaccharides from A. coffeaeformis were reportedly primarily composed of Gal (64-70%) and Fuc (32-42%) residues (Wustman et al. 1997). The dissolved fraction of EPS of Amphora sp. contained Fuc and Gal, as well as Glc-A (Zhang et al. 2008). Our data were consistent with most of the monomers varieties found in the genus Amphora, including Rha, Fuc, Xyl, Gal, Glc, Man and Glc-A,
while the quantitative contents varied in different
studies. In all of these studies, including the present
one, the application of different amounts of acid
hydrolysis over various periods might make some polymers degraded or not released (Leandro et al. 2003). However, these results, especially those obtained under the same experimental conditions, should still be considered to be an indication of the composition of polymers. For Stauroneis sp., the literature on EPS composition is relative rare. It was reported that the soluble and mucilage EPS of the diatom Stauroneis amphioxys contained a complex monosaccharide composition that included monosaccharides of Glc-A and Gal (Mcconville et al. 1999). Therefore, based on our data and the above reports, Amphora sp. was more abundant than Stauroneis sp. in terms of the diversity of the monosaccharide composition in EPS.
The investigation on the production and composition of extracellular carbohydrates of three marine diatoms, Cylindrotheca closterium,
Thalassiosira pseudonana, and Skeletonema
costatumunder demonstrated that species-specific
variations of EPS existed (Urbani et al. 2005). Our results verified the existence of species-specific variations, not only in monosaccharide species but also at various amounts among diatom species and EPS fractions. In the present study, the neutral sugars Glc, Xyl and Man were abundant in
Stauroneis sp., while Gal, Glc and Xyl were rich in
Amphora sp. Importantly, uronic acid (Glc-A) and
hexosamine were found in large quantities for some EPS fractions. EPS samples were fractioned based on their relationship with cells. Distinct variations of compositions among the EPS fractions were observed in this study. For Amphora sp., the most abundant sugar of each fraction was different. Such heterogeneity was also observed in the cyanobacterium Microcystis aeruginosa (Xu et al. 2013). Among all of these EPS fractions, the largest
amount of EPS was found in SL-EPS (Amphora
sp., 89.80% and Stauroneis sp., 74.05%).
BF-TB-EPS, close to cells forming biofilm, might be the
most crucial fraction relative to diatom biofilm formation, although the levels of this fraction were low (Amphora sp., 1.87% and Stauroneis sp., 3.92%). The total production (EPS/cells, g/g) of
Amphora sp. was higher than that of Stauroneis sp., while the production of BF-TB-EPS of Amphora
sp. was much lower than that of Stauroneis sp., only <40% of the latter. This indicated that mechanisms other than the amount of polysaccharide produced
were more important for diatoms biofilm formation
ability to substrata (Becker et al. 1996).
The characteristics of EPS from cells
distributed in the planktonic and biofilm phases of
single diatom species, such as Amphora rostrata, were studied (Khandeparker and Bhosle 2001).
The analysis of both planktonic and biofilm EPS of
A. rostrata showed that Fuc and Gal were the most
(W/W) of the EPS of A. rostrata (Khandeparker and Bhosle 2001). However, another study found
marked differences between the carbohydrates of the planktonic and the biofilm cells of A. rostrata. The concentrations of Glc and GlcN decreased and Fuc increased in planktonic cells over the period of cultivation; however, the reverse results were observed in attached cells (Khodse and
Bhosle 2010). In our study, the differences of the
monosaccharide composition between planktonic
and biofilm cells were also observed after 39 days
of cultivation. For Amphora sp., the most abundant
sugars of EPS from planktonic and biofilm cells were different, Xyl and Glc, respectively (Table III).
Although the most abundant sugar of both F-TB-EPS and BF-TB-F-TB-EPS for Stauroneis sp. was Glc,
the contents were also quite different (37.88% and
60.98%, respectively, Table III). Therefore, there
is a difference in the monosaccharide composition between planktonic and biofilm cells for the same
species.
Monosaccharide compositions of EPS have great relevance to algal performance relative to stickiness, such as adhesion, cohesion, aggregation and coagulation. Polysaccharides were, by nature, highly sticky, and their stickiness might be related to their acidity; moreover, benthic aggregates were related to the monosaccharide compositions, especially that of acidic sugar (Mopper et al. 1995). Hydrogen bonding may have played a major role in the adhesion/cohesion of AOM (algal-derived
organic matter). The film formation of AOM onto a specific surface was likely influenced by the charge
density of AOM (Villacorte et al. 2015). Sartoni et al. (2008) proposed a structural model of the aggregates, in which the mucus matrix containing acidic binding sites acted as intercellular glue,
providing a molecular sieve-like filtering capacity
to aggregates dispersed in seawater. Coagulation of small particles resulted in the formation of larger aggregates. Surface-active polysaccharides, such as acidic sugars, including uronic acids and
sulfonic sugars, were shown to correlate with the coagulation efficiency (Chow et al. 2015). In fact, acidic EPS were widely also observed in bacterial and diatom biofilms. Many studies demonstrated that acidic polysaccharides were a common occurrence in marine fouling diatoms. The presence of uronic acids (16%, w/w) indicated the acidic nature of the exopolysaccharides of
A. coffeaeformis (Bhosle et al. 1996). The data
from Amphora holsatica demonstrated that it was effective producer of exopolysaccharides
rich in uronic acids (Leandro et al. 2003). More
than 90% of the EPS fraction from Amphora sp.
was composed of different acidic polysaccharides
fractions (Zhang et al. 2008). Over 50% (w/w) of the EPS of A. rostrata were composed of uronic acid, pyruvate and sulphate (Khandeparker and Bhosle 2001). In our study, Stauroneis sp. produced EPS rich in Glc, Xyl and Man, while Amphora sp. showed an enrichment of Glc-A, Gal, Glc and Xyl. Neutral sugar and uronic acid occurred at very high levels in Amphora sp. Undoubtedly, hexosamines and uronic acids were closely related to the acidity of polysaccharides. In the comparison for contents of hexosamines and uronic acids from the tested
two diatoms, hexosamines in the SL-EPS and BF-LB-EPS occurred with lower levels in Amphora
sp. than those in Stauroneis sp. The sum of
hexosamines was contrary to the biofilm formation
ability for the tested two diatoms, which indicates that the high content of hexosamines might not
lead to strong biofilm formation (Fig. 4b). In the
cases of uronic acids, Amphora sp. showed higher level than Stauroneis sp. in all fractions (Fig 4c). Meanwhile, BF-TB-EPS of Amphora sp. composed with higher content of uronic acids than F-TB-EPS.
Further, the content of a major identified uronic
acids, Glc-A, represented the similar tendency that the higher uronic acids content leads to stronger
biofilm formation ability. In cases of BF-TB-EPS,
which was believed to be extremely important for
of Amphora sp. possessing the higher contents of uronic acids and Glc-A than Stauroneis sp. was observed (Fig. 4). Therefore, we propose that uronic acid, especially Glc-A, in EPS of Amphora
sp. might be the crucial sugar for the stickiness of EPS.
In conclusion, a ratio of the suspension/biofilm
was proposed for the quantitative description of diatom biofilm formation ability due to its convenience. The EPS from Amphora
sp. and Stauroneis sp., which have different biofilm formation abilities, shared some common characteristics, including sharing 10
monosaccharides and SL-EPS being the fraction
with the highest production. At the same time, the
difference existed in monosaccharide compositions
between planktonic and biofilm cells for each of tested diatoms. Furthermore, the EPS also
expressed some differences between two diatoms,
including EPS productivity and identity of the most abundant sugar, neutral sugar, and acidic sugar. The differences in the contents of uronic acids (especially Glc-A) in EPS, rather than contents of hexosamines and neutral sugar, or amount of polysaccharide produced, were proposed as a key point leading to the stronger biofilm formation ability of Amphora sp. than that of Stauroneis sp.
ACKNOWLEDGMENTS
This study was supported by the National Natural Science Foundation of China (No. 41776156, 41306131, and 41271521), Key Project of Chinese Ministry of Education (No. 211065), and Natural Science Foundation Grant of Jiangsu Province, China (BK20130440).
REFERENCES
AI XX, LIANG JR, GAO YH, LO SCL, LEE FWF, CHEN CP, LUO CS AND DU C. 2015. MALDI-TOF MS analysis
of the extracellular polysaccharides released by the diatom Thalassiosira pseudonana under various nutrient conditions. J Appl Phycol 27: 673-684.
ARCE FT, AVCI RA, BEECH IB, COOKSEY KE AND
WIGGLESWORTH-COOKSEY B. 2004. A live bioprobe
for studying diatom-surface interactions. Biophys J 87(6): 4284-4297.
ASLAM SN, CRESSWELL-MAYNARD T, THOMAS
DN AND UNDERWOOD GJC. 2012. Production and characterization of the intra- and extracellular carbohydrates and polymeric substances (EPS) of three sea-ice diatom species, and evidence for a cryoprotective role for EPS. J Phycol 48(6): 1494-1509.
ATAZADEH I, EDLUND MB, VIJVER BVD, MILLS K, SPAULDING SA AND GELL PA. 2014. Morphology,
ecology and biogeography of Stauroneis pachycephala
P.T. Cleve (Bacillariophyta) and its transfer to the genus
Envekadea. Diatom Res 29(4): 455-464.
BECKER K. 1996. Exopolysaccharide production and attachment strength of bacteria and diatoms on substrates with different surface tensions. Microb Ecol 32(1): 23-33.
BHOSLE NB, SAWANT SS, GARG A, WAGH AB AND EVANS LV. 1996. Chemical characterization of
exopolysaccharides from the marine fouling diatom
Amphora coffeaeformis. Biofouling 10(4): 301-307.
BURGE DRL, MARSICO TD AND EDLUND MB.
2015. Stauroneis kingstonii sp. nov. (Bacillariophyta: Naviculales), a new diatom species from the Black Swamp, Arkansas, USA. Phytotaxa 205(3): 177-186.
CHOW JS, LEE C AND ENGEL A. 2015. The influence
of extracellular polysaccharides, growth rate, and free coccoliths on the coagulation efficiency of Emiliania huxleyi. Mar Chem 175: 5-17.
DANIEL GF, CHAMBERLAIN AHL AND JONES EBG.
1980. Ultrastructural observations on the marine fouling diatom Amphora. Helgoland Mar Res 34: 123-149.
FRANZ S, ALTENBURGER R, HEILMEIER H AND
SCHMITT-JANSEN M. 2008. What contributes to the sensitivity of microalgae to triclosan? Aquat Toxicol 90(2): 102-108.
FUSETANI N. 2004. Biofouling and antifouling. Nat Prod Rep 21: 94-104.
GUILLARD RRL AND RYTHER JH. 1962. Studies of
marine planktonic diatoms. I. Cyclotella nana Hustedt and
Detonula confervacea Cleve. Can J Microb 8: 229-239.
HIGGINS MJ, CRAWFORD SA, MULVANEY P AND
WETHERBEE R. 2002. Characterization of the adhesive mucilages secreted by live diatom cells using atomic force microscopy. Protist 153(1): 25-38.
HOAGLAND KD, ROSOWSKI JR, GRETZ MR AND
ROEMER SC. 1993. Diatom extracellular polymeric substances: function, fine structure, chemistry, and physiology. J Phycol 29: 537-566.
JIN CL, XIN XY, YU SY, QIU JJ, MIAO L, FENG K AND
ZHOU XJ. 2014. Antidiatom activity of marine bacteria associated with sponges from San Juan Island, Washington. World J Microb Biotech 30(4): 1325-1334.
JOH G. 2014. Diatom flora of genus Stauroneis
(Bacillariophyta) from mainly the mountain peatlands of Korea. J Ecol Environ 37(4): 257-270.
KHANDEPARKER RDS AND BHOSLE NB. 2001.
Extracellular polymeric substances of the marine fouling diatom Amphora rostrata Wm. Sm. Biofouling 17(2): 117-127.
KHODSE VB AND BHOSLE NB. 2010. Differences in
carbohydrate profiles in batch culture grown planktonic and biofilm cells of Amphora rostrata Wm.Sm. Biofouling 26(5): 527-537.
KRISTENSEN JB, MEYER RL, LAURSEN BS, SHIPOVSKOV S, BESENBACHER F AND POULSEN
CH. 2008. Antifouling enzymes and the biochemistry of marine settlement. Biotech Adv 26(5): 471-481.
LEANDRO SM, GIL MC AND DELGADILLO I. 2003.
Partial characterization of exopolysaccharides exudated by planktonic diatoms maintained in batch cultures. Acta Oecol 24: S49-S55.
LEFLAIVE J AND TEN-HAGE L. 2011a. Impairment of
benthic diatom adhesion and photosynthetic activity by 2E,4E-decadienal. Res Microb 162: 982-989.
LEFLAIVE J AND TEN-HAGE L. 2011b. Effects of 2E,
4E-decadienal on motility and aggregation of diatoms and on biofilm formation. Microb Ecol 61: 363-373.
LIANG JR, AI XX, GAO YH AND CHEN CP. 2013.
MALDI-TOF MS ananlysis of the extracellular polysaccharides released by the diatom Thalassiosira pseudonana. J Appl Phycol 25(2): 477-484.
LIND JL, HEIMANN K, MILLER EA, VAN VLIET C,
HOOGENRAAD NJ AND WETHERBEE R. 1997. Substratum adhesion and gliding in a diatom are mediated by extracellular proteoglycans. Planta 203: 213-221.
MAGALETTI E, URBANI R, SIST P, FERRARI CR
AND CICERO AM. 2004. Abundance and chemical characterization of extracellular carbohydrates released by the marine diatom Cylindrotheca fusiformis under N- and P- limitation. Eur J Phycol 39(2): 133-142.
MCCONVILLE MJ, WETHERBEE R AND BACIC A.
1999. Subcellular location and composition of the wall and secreted extracellular sulphated polysaccharides/ proteoglycans of the diatom Stauroneis amphioxys
Gregory. Protoplasma 206(1): 188-200.
MOL VPL, RAVEENDRAN TV AND PARAMESWARAN
PS. 2009. Antifouling activity exhibited by secondary metabolites of the marine sponge, Haliclona exigua
(Kirkpatrick). Int Biodeter Biodeg 63: 67-72.
MOPPER K, ZHOU J, RAMANA KS, PASSOW U, DAM HG AND DRAPEAU DT. 1995. The role of surface-active
carbohydrates in the flocculation of a diatom bloom in a mesocosm. Deep-Sea Res PT II 42(1): 47-73.
POULSEN N, KRÖGER N, HARRINGTON MJ, BRUNNER E, PAASCH S AND BUHMANN MT. 2014. Isolation and biochemical characterization of underwater adhesives from diatoms. Biofouling 30(4): 513-523.
SARTONI G, URBANI R, SIST P, BERTO D, NUCCIO C AND GIANI M. 2008. Benthic mucilaginous aggregates in the Mediterranean Sea: Origin, chemical composition and polysaccharide characterization. Mar Chem 11: 184-198.
SHENG GP, YU HQ AND LI XY. 2010. Extracellular
polymeric substances (EPS) of microbial aggregates in biological waste water treatment systems: a review. Biotech Adv 28(6): 882-894.
TANSEL B AND TANSEL DZ. 2013. Adhesion strength and
spreading characteristics of EPS on membrane surfaces during lateral and central growth. Colloid Surface B 111: 594-599.
TOWNSIN RL. 2003. The ship hull fouling penalty. Biofouling
19: 9-15.
URBANI R, MAGALETTI E, SIST P AND CICERO AM. 2005.
Extracellular carbohydrates released by the marine diatoms
Cylindrotheca closterium, Thalassiosira pseudonana and
Skeletonema costatum: Effect of P-depletion and growth status. Sci Total Environ 353: 300-306.
VESNA S, ŽUTIĆ V, GALJA P AND MIŠIĆ RT. 2013. Marine
polysaccharide networks and diatoms at the nanometric scale. Int J Mol Sci 14(10): 20064-20078.
VILLACORTE LO, EKOWATI Y, NEU TR, KLEIJN JM,
WINTERS H, AMY G, SCHIPPERS JC AND KENNEDY MD. 2015. Characterisation of algal organic matter produced by bloom-forming marine and fresh water algae. Water Res 73: 216-230.
VIVANCO JM AND BALUSKA F. 2012. Secretions and
exudates in biological systems. Springer Berlin Heidelberg, p. 221-250.
WANG HX, ZHAO J, LI DM, WEN CG, LIU HM, SONG
S AND ZHU BW. 2015. Comparison of polysaccharides of Haliotis discus hannai and Volutharpa ampullaceal perryi by PMP-HPLC-MSn analysis upon acid hydrolysis.
Carbohyd Res 415: 48-53.
WANG Y, CHEN Y, LAVIN C AND GRETZ MR.
2000. Extracellular matrix assembly in diatoms (Bacillariophyceae). IV. Ultrastructure of Achnanthes longipes and Cymbella cistula as revealed by high-pressure freezing/freeze substituton and cryo-field emission scanning electron microscopy. J Phycol 36: 367-378.
WUSTMAN BA, GRETZ MR AND HOAGLAND
KD. 1997. Extracellular matrix assembly in diatoms
(Bacillariophyceae) (Ι. A model of adhesives based
XU HC, CAI HY, YU GH AND JIANG HL. 2013. Insights
into extracellular polymeric substances of Cyanobacterium
Microcystis aeruginosa using fractionation procedure and parallel factor analysis. Water Res 47(6): 2005-2014.
YANG X, WANG Q, WANG H AND MEI QB. 2005.
Analysis of the monosaccharide components in angelica polysaccharides by high performance liquid chromatography. Anal Sci 21(10): 1177-1180.
YANG Z, KONG FX, SHI XL, ZHANG M, XING P AND CAO
HS. 2008. Changes in the morphology and polysaccharide
content of Microcystis aeruginosa (Cyanobacteria) during
flagellate grazing. J Phycol 44(3): 716-720.
ZHANG SJ, XU C AND SANTSCHI PH. 2008. Chemical composition and 234
Th (IV) binding of extracellular polymeric substances (EPS) produced by the marine diatom Amphora sp. Mar Chem 112: 81-92.
ZIDAROVA R, KOPALOVÁ K AND VIJVER BVD. 2014.