Alex Cristiano Bartz , Martina Muttoni , Cleber Maus Alberto , Nereu Augusto Streck , Geter Alves Machado(1), Robson Giacomeli(1), Diogo Balbé Helgueira(3) and Diogo da Silva Moura(3)
(1)Universidade Federal do Pampa, Rua Luiz Joaquim de Sá Britto, s/no, Promorar, CEP 97650-000 Itaqui, RS, Brazil. E-mail: [email protected], [email protected], [email protected], [email protected], [email protected] (2)Universidade Federal de Santa Maria, Avenida Roraima, no 1.000, Camobi, CEP 97105-900 Santa Maria, RS, Brazil. E-mail: [email protected] (3)Universidade Federal de Pelotas, Campus Universitário, s/no, CEP 96010-610 Capão do Leão, RS, Brazil. E-mail: [email protected], [email protected]
Abstract – The objective of this work was to evaluate methods of thermal time calculation and the duration of the development stages of lowland rice (Oryza sativa) irrigated by sprinkling. The experiment was conducted
during three growing seasons (2010/2011, 2011/2012, and 2014/2015), with five irrigation water depths, six
cultivars, and four replicates. Six methods of thermal time calculation were tested: two using the minimum basal temperature; two using the minimum and optimum temperatures; and two using the minimum, optimum, and maximum basal temperatures. For the thermal time calculation, the crop development cycle was divided into
the vegetative, reproductive, and grain-filling phases. The methods that used the three cardinal temperatures showed the lowest coefficients of variation for most of the developmental phases. Both irrigation water depths
and rice cultivars affected the thermal time of the development stages. The greater the water availability, the lower the duration of the development cycle. Thermal time values depend on the calculation method.
Index terms: Oryza sativa, degree-day, irrigation water depth, phenology, water availability.
Soma térmica em arroz de terras baixas irrigado por aspersão
Resumo – O objetivo deste trabalho foi avaliar métodos de cálculo da soma térmica e a duração das fases de desenvolvimento de arroz (Oryza sativa) de terras baixas irrigado por aspersão. O experimento foi realizado durante três anos agrícolas (2010/2011, 2011/2012 e 2014/2015), com cinco lâminas de irrigação, seis cultivares e quatro repetições. Seis métodos de cálculo da soma térmica foram avaliados: dois com a temperatura basal inferior; dois com as temperaturas basal inferior e ótima; e dois com as temperaturas basal inferior, ótima e superior. Para o cálculo da soma térmica, o ciclo de desenvolvimento da cultura foi dividido nas fases vegetativa, reprodutiva e de enchimento de grãos. Os métodos que utilizaram as três temperaturas cardinais
apresentaram os menores coeficientes de variação na maioria das fases de desenvolvimento. Tanto as lâminas de irrigação quanto as cultivares de arroz influenciaram a soma térmica das fases de desenvolvimento. Quanto
maior é a disponibilidade hídrica, menor é a duração do ciclo de desenvolvimento. Os valores de soma térmica dependem do método de cálculo.
Termos para indexação: Oryza sativa, grau-dia, lâmina de irrigação, fenologia, disponibilidade hídrica.
Introduction
Rice (Oryza sativa L.) cultivation in the western region, known as Fronteira Oeste of Rio Grande do Sul state, Brazil, is carried out predominantly by flooded irrigation. In this system, water demand is high, as maintaining a permanent water depth on the soil surface requires water saturation, besides the replacement of the water lost by crop evapotranspiration, percolation and lateral flow in the crop area and in irrigation channels (Reunião…, 2010). Sprinkler irrigation is an alternative to this system, in which water is provided
only to supply crop evapotranspiration, which reduces other losses. Therefore, some producers of Fronteira Oeste have chosen to cultivate sprinkler-irrigated rice to reduce water consumption and facilitate crop rotation.
to investigate the effect of the irrigation system on basic processes of growth and development of rice cultivars traditionally grown in flooded soil.
Air temperature (Streck et al., 2008) and water availability (Cho & Oky, 2012) are the two abiotic factors that most affect plant growth and development. The temperature effects on these processes have been evaluated by using thermal calculation values in degree-days (Renato et al., 2013). This method is based on the fact that plants require the summation of thermal units to complete their developmental stages.
Thermal time can be calculated by several methods, from which the simplest one is that which measures the thermal accumulation above a lower threshold value (lower basal temperature). However, from a biological point of view, plant response to temperature is best represented by the use of three cardinal temperatures, that is, the lower basal, optimum, and upper basal temperatures (Erpen et al., 2013).
The duration of plant development stages is important for defining crop management practices, such as the choice of sowing dates and application of fertilizers and other chemical products (Freitas et al., 2006), calibration of growth, and development simulation models (Rosa et al., 2015), as well as for the irrigation management.
The objective of this work was to evaluate methods of thermal time calculation and the duration of the development stages of lowland rice irrigated by sprinkling.
Materials and Methods
The study was carried out at the experimental area of Universidade Federal do Pampa (Unipampa), located in the municipality of Itaqui, in the state of Rio Grande do Sul, Brazil (29°09'22"S, 56°33'03"W, at 74 m altitude). The climate of the region is a Cfa – subtropical without a defined dry season – according to Köppen-Geiger’s classification. The soil is classified as a Plinthudult (Santos et al., 2013).
Three experiments were conducted during three growing seasons (2010/2011, 2011/2012, and 2014/2015). A experimental split-plot randomized block design was carried out with four replicates. Water depths were evaluated in the plots, and six lowland rice cultivars – IRGA 417, IRGA 424, and Inov CL, in 2010/2011 and 2011/2012, and IRGA 428, IRGA 429, and XP 102 CL, in 2014/2015 – were evaluated in the subplots. In the
2011/2012 growing season, water depths of 0, 50, 100, and 150% of the crop evapotranspiration (ETc) were evaluated, whereas, in the 2010/2011 and 2014/2015 growing seasons, the water depths of 0, 50, 100, 150, and 200% of ETc were evaluated. Sowings were conducted on 11/9/2010, 10/22/2011, and 11/17/2014, within the recommended period for rice cultivation.
The experimental plots were composed of 18 rows of 5.0 m long, spaced at 0.17 m, totaling 15.3 m2.
Sowing density was of 100 kg seed ha-1 (or 350 plants
m-2) for IRGA 417, IRGA 424, IRGA 428, and IRGA
429 cultivars, and of 50 kg seed ha-1 (or 175 plants m-2)
for Inov CL and XP 102 CL which are hybrids.
Irrigation requirement was determined from the ETc obtained by multiplying the reference evapotranspiration (ETo) by the crop coefficient (Kc). ETo was estimated by the Penman-Monteith equation (Allen et al., 1998) based on data of temperature, air humidity, wind speed, and solar radiation, obtained at an automatic weather station located 200 m from the cultivation site. Crop coefficient (Kc) values were: 1.05, up to 20 days after emergence (DAE); 1.125, from 21 to 40 DAE; 1.2, from 41 to 95 DAE; and 0.9, from 95 DAE on (Allen et al., 1998).
Irrigation was performed with a fixed irrigation shift of two days. Irrigation volume was calculated by the sum of ETc, divided by the irrigation system efficiency (70%). When the precipitation volume was above the accumulated ETc since the last irrigation, one day was not accounted for ETc, or two days when the volume was ≥50 mm.
Fertilization was carried out according to the recommendation for rice cultivation by the Comissão de Química e Fertilidade do Solo, for soils of Rio Grande do Sul and Santa Catarina (Manual…, 2004), for an expected grain yield of 12 Mg ha-1. The control
of weeds, insects, and diseases, as well as other crop management practices, were carried out whenever necessary, according to technical recommendations for irrigated rice cultivation in Southern Brazil (Reunião…, 2010) for maintain plants free of stress.
monitored in ten randomly selected plants per subplot. The beginning of each developmental stage was considered as the date at which 50% of plants were at the same phenological stage. In the 2014/2015 growing season, four plants were monitored per subplot right after their emergence, and the date of the beginning of each stage was registered.
Daily thermal time (TTd, °C day) was determined by six linear methods (Streck et al., 2007a, 2007b; Rosa et al., 2009). Methods using only one cardinal temperature (methods 1.1 and 1.2), two cardinal temperatures (2.1 and 2.2), and three cardinal temperatures (3.1 and 3.2) were used, as described below.
Method 1.1: TTd = (Tmean - Tb) × 1 day; if Tmean<Tb, then Tmean=Tb
Method 1.2: TTd = (Tmean - Tb) × 1 day; if Tmin≤Tb, then Tmin=Tb
Method 2.1: TTd = (Tmean - Tb) × 1 day; if Tmean<Tb, then Tmean=Tb; if Tmean>Topt, then Tmean=Topt
Method 2.2: TTd = (Tmean - Tb) × 1 day; if Tmin<Tb, then Tmin=Tb; if Tmax>Topt, then Tmax=Topt
Method 3.1: TTd = (Tmean - Tb) × 1 day, when Tb≤Tmean≤Topt; TTd = {(Topt - Tb) × [(TB - Tmean) / (TB - Topt)]} × 1 day, when Topt<Tmean≤TB; if Tmean<Tb, then Tmean=Tb; if Tmean>TB, then Tmean=TB
Method 3.2: TTd = (Tmean - Tb) × 1 day, when Tb≤Tmean≤Topt; TTd = {(Topt - Tb) × [(TB - Tmean) / (TB - Topt)]} × 1 day, when Topt<Tmean≤TB; if Tmin <Tb, then Tmin=Tb; if Tmax>TB, then Tmax=TB
In the equations above, the variables stand for: TTd, daily thermal time (°C day); Tmean, mean daily air temperature (°C), calculated by the arithmetic mean of the maximum (Tmax) and minimum (Tmin) daily air temperatures; and Tb, Topt, and TB are, respectively, the cardinal temperatures (°C) for the lower basal temperature, optimum temperature, and upper basal temperature for rice plant development.
Crop developmental cycle was divided into vegetative (EM−R1), reproductive (R1−R4), and grain-filling (R4−R9) phases. Cardinal temperatures for each developmental phase were obtained from the literature (Table 1). The accumulated thermal time (TTa, °C day)
for each crop developmental phase was calculated by TTa = ∑TTd.
The efficiency of TTa methods was evaluated by the coefficients of variation (CV) of cultivars and irrigation water depths, in the three growing seasons (2010/2011, 2011/2012, and 2014/2015). The statistical analysis was performed for all development stages only in the 2014/2015 growing season, as the dates at which the development stages occurred in the other growing seasons were considered when the averages of all replicates, in each treatment, were at each respective development stages. Therefore, in those growing seasons, the date of each replicate was not registered separately. The data of the 2014/2015 growing season were subjected to the analysis of variance, and treatments were compared by the Tukey’s test, at 5% probability.
Results and Discussion
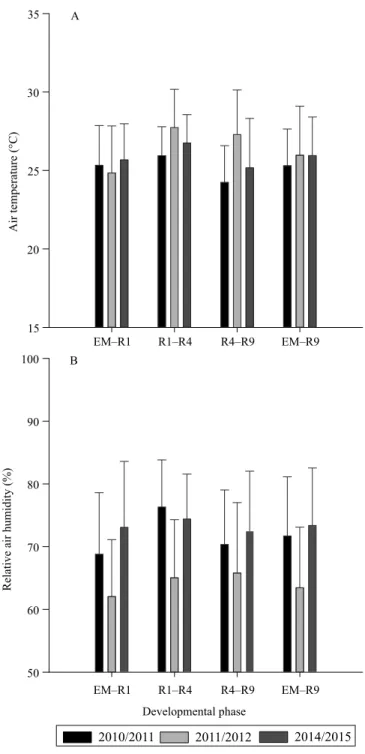
The meteorological conditions during the three growing seasons were distinct (Figures 1 and 2). In the 2010/2011 growing season, frequent and high volumes of precipitations occurred throughout the crop development cycle, with 1,502.8 mm precipitated volume, which is equivalent to twice the normal (725.7 mm) for the period in the municipality of Itaqui, RS, Brazil, as a result of El Niño phenomenon (NOAA, 2016). In the 2011/2012 growing season, low amounts
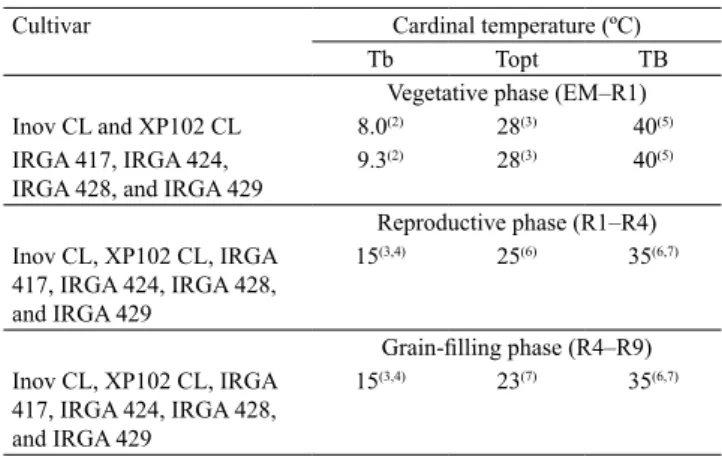
Table 1. Cardinal temperatures estimated by different authors for different developmental phases of lowland rice (Oryza sativa) cultivars.(1)
Cultivar Cardinal temperature (ºC) Tb Topt TB
Vegetative phase (EM–R1)
Inov CL and XP102 CL 8.0(2) 28(3) 40(5)
IRGA 417, IRGA 424, IRGA 428, and IRGA 429
9.3(2) 28(3) 40(5)
Reproductive phase (R1–R4) Inov CL, XP102 CL, IRGA
417, IRGA 424, IRGA 428, and IRGA 429
15(3,4) 25(6) 35(6,7)
Grain-filling phase (R4–R9)
Inov CL, XP102 CL, IRGA 417, IRGA 424, IRGA 428, and IRGA 429
15(3,4) 23(7) 35(6,7)
(1)Cardinal temperatures:Tb, lower basal; Topt optimum; and TB, upper
basal. (2)Lago et al. (2009). (3)Steinmetz (2004). (4)Buriol et al. (1991). (5)Gao
et al. (1992). (6)Pedro Júnior et al. (1995). (7)Venkataraman et al. (2007).
Figure 1. Rainfall and irrigation for 100% water depth of the crop evapotranspiration (ETc), during the developmental cycle of sprinkler-irrigated lowland rice in three growing seasons: A, 2010/2011; B, 2011/2012; and C, 2014/2015. Dashed lines correspond to the average dates of occurrence of panicle differentiation (R1), anthesis (R4), and physiological maturity (R9) for lowland rice cultivars using a water depth of 100% ETc.
of rainfall (340.0 mm) were observed, with values lower than the half of the expected volume for the period, according to climatologic normal for the place (Wrege et al., 2011). Temperature (26.0°C) and relative humidity (63.1%) above and below the climatologic normal (24.9°C and 75.0%, respectively) were also registered; this can be explained by the effect of La Niña phenomenon during the period (NOAA, 2016). The 2014/2015 growing season had intermediate conditions, with 300 mm rainfall during the vegetative phase, which is above the climatologic normal, and 120 mm during the reproductive phase, which is below the historical monthly mean (Wrege et al., 2011).
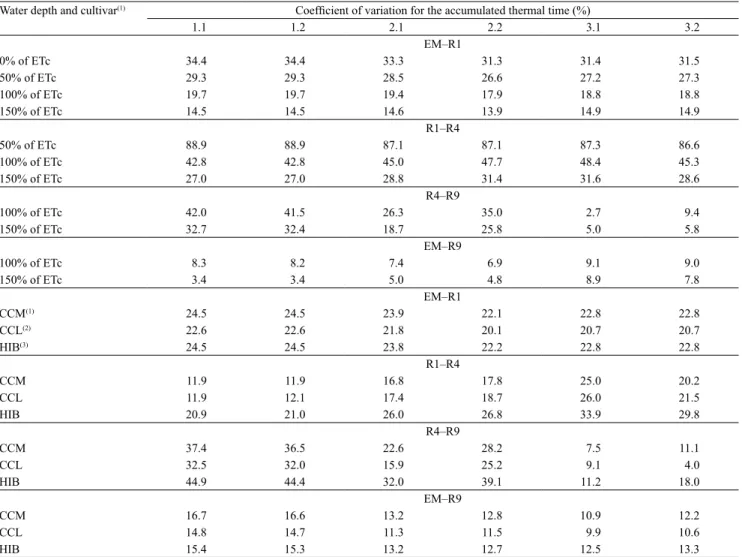
A tendency of reducing CV values was observed with water increasing availability, and with the use of three cardinal temperatures for calculating thermal time (Table 2). These results agree with those found by Rosa et al. (2009) in a study on wheat cultivars. These authors reported that the standard deviation of values obtained by methods with three cardinal temperatures is lower than that obtained with other methods, since the former better represents the interaction between plant development and air temperature.
considerably value variability among years. By using the method 1.1, thermal time of the entire plant cycle (EM–R9), at a water depth of 100% ETc, ranged from
1,696.2 to 2,000.8°C day. In addition, in the three growing seasons, plants with water depths of 0 and 50% ETc senesced before completing the reproductive and grain-filling stages, respectively.
In the 2014/2015 growing season, irrigation water depths affected the TTa values of vegetative and reproductive phases (Figure 3). For the vegetative phase (EM–R1), a difference of 30°C day was observed between values obtained with the water depths of 0 and 200% ETc for all TTa methods. Boonjung & Fukai (1996) stated that the vegetative phase duration depends on the intensity and duration of water restriction for rice. Despite the high precipitation observed over the period (Figure 1 C), data found in the present work corroborate those found by Boonjung & Fukai (1996) and Farooq et al. (2009), who stated that a reduction of water availability reduces the development rate, which results in a longer duration of the vegetative phase.
As rice plants subjeted to dry conditions (0% ETc) did not complete the reproductive phase (R1–R4) in the 2014/2015 growing season, the statistical analysis was performed only with water depths from 50 to 200% ETc. The difference between them was 42.8°C day more for TTa at the R1–R4 phase, in the comparison between the water depth of 50% ETc and that of 200% ETc. This difference may be related to canopy temperature, as water deficit causes its rise, which reduces the photosynthetic capacity and transpiration rate of plants (Yan et al., 2012), reflecting on the duration of the phenological phases.
For the grain-filling phase (R4–R9), in the 2014/2015 growing season, no significant difference was observed in TTa values, considering the different irrigation water depths, regardless of method employed for the thermal time calculation. In a study with upland rice cultivars, with different water availability, Lilley & Fukai (1994) also observed that the duration of the R4–R9 phase responded little to water availability.
Values of the coefficient of variation for the different groups of cultivars (Table 2) were similar between methods for each developmental phase. However, in general, the lowest values were obtained using the method 3.1. Streck et al. (2007a) calculated the thermal time by using this method, and observed a TTa variation of approximately 100°C day for the duration of the entire cycle (EM–R9) of irrigated rice. In the present study, this variation was 269.1°C day. The difference between these results may be attributed to the cultivation under sprinkler irrigation, in the present work.
Figure 2. Air temperature (A) and relative air humidity (B) during the vegetative (EM–R1), reproductive (R1–R4), and
grain-filling (R4–R9) development phases, and during the
In the 2014/2015 growing season, a significant difference was observed for TTa values in the vegetative and reproductive phases for all calculation methods. For the grain-filling phase, difference was observed for the methods 2.1, 3.1, and 3.2 (Figure 4). The difference for the vegetative phase (EM–R1) is due to the genetic characteristics of cultivars. According to Lago et al. (2009), cultivars from hybridization show a lower minimum temperature (8.0ºC) than the other cultivars (9.3ºC). Therefore, a greater thermal accumulation can be observed, even if these cultivars are classified as medium-cycle ones.
For the reproductive phase (R1–R4), the cultivar IRGA 429 showed the highest TTa values (415.2 to 613.8°C day). In a study with lowland rice cultivars, Freitas et al. (2006) observed a variation in the duration of developmental phases according to the cultivar cycle. IRGA 429, classified as a long-cycle cultivar, showed a higher TTa in this period than the other cultivars of medium cycle (IRGA 428 and XP 102 CL).
In the grain-filling phase (R4–R9), the methods 2.1, 3.1, and 3.2 differed significantly according to cultivar cycle, with higher values of TTa for the cultivars with long cycle (IRGA 429), and lower
Table 2. Coefficients of variation for the accumulated thermal time (TTa, °C day) during the vegetative (EM–R1),
reproductive (R1–R4), and grain-filling (R4–R9) developmental phases, and total developmental cycle (EM–R9) of
sprinkler-irrigated lowland rice (Oryza sativa) cultivars with different water depths and methods (1.1, 1.2, 2.1, 2.2, 3.1, and 3.2) for TTa calculation.
Water depth and cultivar(1) Coefficient of variation for the accumulated thermal time (%)
1.1 1.2 2.1 2.2 3.1 3.2
EM–R1
0% of ETc 34.4 34.4 33.3 31.3 31.4 31.5
50% of ETc 29.3 29.3 28.5 26.6 27.2 27.3
100% of ETc 19.7 19.7 19.4 17.9 18.8 18.8
150% of ETc 14.5 14.5 14.6 13.9 14.9 14.9
R1–R4
50% of ETc 88.9 88.9 87.1 87.1 87.3 86.6
100% of ETc 42.8 42.8 45.0 47.7 48.4 45.3
150% of ETc 27.0 27.0 28.8 31.4 31.6 28.6
R4–R9
100% of ETc 42.0 41.5 26.3 35.0 2.7 9.4
150% of ETc 32.7 32.4 18.7 25.8 5.0 5.8
EM–R9
100% of ETc 8.3 8.2 7.4 6.9 9.1 9.0
150% of ETc 3.4 3.4 5.0 4.8 8.9 7.8
EM–R1
CCM(1) 24.5 24.5 23.9 22.1 22.8 22.8
CCL(2) 22.6 22.6 21.8 20.1 20.7 20.7
HIB(3) 24.5 24.5 23.8 22.2 22.8 22.8
R1–R4
CCM 11.9 11.9 16.8 17.8 25.0 20.2
CCL 11.9 12.1 17.4 18.7 26.0 21.5
HIB 20.9 21.0 26.0 26.8 33.9 29.8
R4–R9
CCM 37.4 36.5 22.6 28.2 7.5 11.1
CCL 32.5 32.0 15.9 25.2 9.1 4.0
HIB 44.9 44.4 32.0 39.1 11.2 18.0
EM–R9
CCM 16.7 16.6 13.2 12.8 10.9 12.2
CCL 14.8 14.7 11.3 11.5 9.9 10.6
HIB 15.4 15.3 13.2 12.7 12.5 13.3
(1)Cultivars:CCM, medium cycle (IRGA 417 and IRGA 428). (2)Cultivars:CCL, long cycle (IRGA 424 and IRGA 429). (3)HIB, hybrids (Inov CL and XP
Figure 3. Accumulated thermal time (TTa) during the vegetative (EM–R1), reproductive (R1–R4), and grain-filling
Figure 4. Accumulated thermal time (TTa) during the vegetative (EM–R1), reproductive (R1–R4), and grain-filling
values for medium-cycle cultivars (IRGA428 and XP 102 CL). Probably the methods that use only one cardinal temperature (Tb) cannot differentiate the cycle duration of cultivars in short periods, such as that at R4–R9 stage. This probably hides differences in the developmental cycle duration, identified by methods that consider more than one cardinal temperature (Tb, Topt, and TB).
When the entire developmental cycle (EM–R9) was considered, in the three growing seasons, the TTa values obtained with the method 3.1 ranged from 1,245.3 to 1,669.8°C day. Using the same method, Streck et al. (2007a) found that medium- and long-cycle lowland rice cultivars required 1,750 to 2,100°C day to complete the EM–R9 cycle. Therefore, the sprinkler irrigation system provided lower TTa values than those found in flooded systems by these authors. This difference can be explained by the presence of water above the soil in the flood irrigation system, which can reduce the thermal amplitude in the canopy. Thus, as a consequence of the absence of this excess of water in the sprinkler irrigation system, temperatures can reach higher values and lead to higher rates of development. Besides, the study of Streck et al. (2007a) was carried out using different sowing dates, with higher TTa values at earlier sowings, which may also have contributed to the differences between values in the two studies.
In the three growing seasons, for the different irrigation water depths and rice cultivars, TTa values were higher with the use of methods 1.1 and 1.2, intermediate with methods 2.1 and 2.2, and lower with the methods 3.1 and 3.2. According to Rosa et al. (2009), this occurs when the mean daily temperature is above the optimum temperature for plants.
In general, values of coefficients of variation for the complete crop developmental cycle were low in methods that consider the three cardinal temperatures. However, analyzing the values at each phase separately allows the identification of high values, which affects the accuracy on the determination of the duration of each development phase. This is probably due to the water availability at these stages. However, for this possibility to be evaluated, it is necessary to adapt and calibrate the linear and nonlinear development models, in order to improve the precision of the duration estimate of developmental stages under sprinkler irrigation.
Conclusions
1. The use of different methods provide different values of thermal time, considering the same development stages of sprinkler-irrigated lowland rice (Oryza sativa); and methods that consider more than one cardinal temperature show less variation between growing seasons.
2. The lower the water depth provided by sprinkler irrigation, the longer the lowland rice cycle.
Acknowledgments
To Fundação de Amparo à Pesquisa do Rio Grande do Sul (Fapergs), and to Conselho Nacional de Desenvolvimento Científico e Tecnológico (CNPq), for financial support.
References
ALLEN, R.G.; PEREIRA, L.S.; RAES, D.; SMITH, M. Crop evapotranspiration: guidelines for computing crop water requirements. Roma: FAO, 1998. 300p. (FAO. Irrigation and drainage paper, 56).
BOONJUNG, H.; FUKAI, S. Effects of soil water deficit at
different growth stages on rice growth and yield under upland conditions. 2. Phenology, biomass production and yield. Field Crops Research, v.48, p.47-55, 1996. DOI: 10.1016/0378-4290(96)00039-1.
BOSCO, L.C.; GRIMM, E.L.; STRECK, N.A. Crescimento e desenvolvimento de genótipos de arroz cultivados em solo alagado e não-alagado. Revista Ceres, v.56, p.796-804, 2009.
BURIOL, G.A.; SCHNEIDER, F.M.; ESTEFANEL, V.;
HOFFMANN, A. Ocorrência e duração das temperaturas mínimas
diária do ar prejudiciais à fecundação das flores do arroz em Santa
Maria, RS. 1 - Probabilidades de ocorrência. Ciência Rural, v.21, p.23-34, 1991. DOI: 10.1590/S0103-84781991000100003.
CHO, J.; OKY, T. Application of temperature, water stress, CO2
in rice growth models. Rice, v.5, p.1-8, 2012. DOI: 10.1186/1939-8433-5-10.
COUNCE, P.A.; KEISLING, T.C.; MITCHELL, A.J. A uniform, objective, and adaptive system for expressing rice development. Crop Science, v.40, p.436-443, 2000. DOI: 10.2135/ cropsci2000.402436x.
ERPEN, L.; STRECK, N.A.; UHLMANN, L.O.; LANGNER, J.A.; WINCK, J.E.M.; GABRIEL, L.F. Estimativa das temperaturas cardinais e modelagem do desenvolvimento vegetativo em batata-doce. Revista Brasileira de Engenharia Agrícola e Ambiental, v.17, p.1230-1238, 2013. DOI: 10.1590/S1415-43662013001100015.
FAROOQ, M.; WAHID, A.; KOBAYASHI, N.; FUJITA, D.;
FREITAS, T.F.S. de; SILVA, P.R.F. da; STRIEDER, M.L.; SILVA, A.A. da. Validação de escala de desenvolvimento para cultivares
brasileiras de arroz irrigado. Ciência Rural, v.36, p.404-410, 2006. DOI: 10.1590/S0103-84782006000200008.
GAO, L.; JIN, Z.; HUANG, Y.; ZHANG, L. Rice clock model – a computer model to simulate rice development. Agricultural and Forest Meteorology, v.60, p.1-16, 1992. DOI: 10.1016/0168-1923(92)90071-B.
LAGO, I.; STRECK, N.A.; CARVALHO, M.P.; FAGUNDES,
L.K.; PAULA, G.M. de; LOPES, S.J. Estimativa da temperatura base do subperíodo emergência – diferenciação da panícula em arroz cultivado e arroz vermelho. Revista Ceres, v.56, p.288-295, 2009.
LILLEY, J.M.; FUKAI, S. Effect of timing and severity of water
deficit on four diverse rice cultivars III. Phenological development,
crop growth and grain yield. Field Crops Research, v.37, p.225-234, 1994. DOI: 10.1016/0378-4290(94)90101-5.
MANUAL de adubação e de calagem para os Estados do Rio Grande do Sul e Santa Catarina. 10.ed. Porto Alegre: Comissão
de Química e Fertilidade do Solo – RS/SC, 2004. 400p.
NOAA. National Oceanic and Atmospheric Administration.
Historical El Niño/ La Niña episodes: cold & warm episodes by season. Available at: <http://www.cpc.ncep.noaa.gov/products/ analysis_monitoring/ensostuff/ensoyears_1971-2000_climo. shtml>. Accessed on: Jan. 21 2016.
PEDRO JÚNIOR, M.J.; SENTELHAS, P.C.; MORAES, A.V.C.; VILLELA, O.V. Estimativa da produtividade de arroz irrigado
por inundação em função da temperatura do ar e da radiação solar. Scientia Agricola, v.52, p.96-100, 1995. DOI: 10.1590/ S0103-90161995000100017.
RENATO, N. dos S.; SILVA, J.B.L.; SEDIYAMA, G.C.; PEREIRA, E.G. Influência dos métodos para cálculo de graus-dia em condições de aumento de temperatura para as culturas de milho e feijão. Revista Brasileira de Meteorologia, v.28, p.382-388, 2013. DOI: 10.1590/S0102-77862013000400004.
REUNIÃO TÉCNICA DA CULTURA DO ARROZ IRRIGADO, 28., 2010, Bento Gonçalves. Arroz irrigado: recomendações técnicas da pesquisa para o Sul do Brasil. Porto Alegre: Sosbai, 2010. 188p.
ROSA, H.T.; WALTER, L.C.; STRECK, N.A.; ALBERTO, C.M. Métodos de soma térmica e datas de semeadura na determinação
de filocrono de cultivares de trigo. Pesquisa Agropecuária
Brasileira, v.44, p.1374-1382, 2009. DOI: 10.1590/S0100-204X2009001100002.
ROSA, H.T.; WALTER, L.C.; STRECK, N.A.; DE CARLI, C.; RIBAS, G.G.; MARCHESAN, E. Simulação do crescimento e produtividade de arroz no Rio Grande do Sul pelo modelo SimulArroz. Revista Brasileira de Engenharia Agrícola e Ambiental, v.19, p.1159-1165, 2015. DOI: 10.1590/1807-1929/ agriambi.v19n12p1159-1165.
SANTOS, H.G. dos; JACOMINE, P.K.T.; ANJOS, L.H.C. dos;
OLIVEIRA, V.A. de; LUMBRERAS, J.F.; COELHO, M.R.; ALMEIDA, J.A. de; CUNHA, T.J.F.; OLIVEIRA, J.B. de.
Sistema brasileiro de classificação de solos. 3.ed. rev. e ampl.
Brasília: Embrapa, 2013. 353p.
STEINMETZ, S. Influência do clima na cultura do arroz irrigado
no Rio Grande do Sul. In: GOMES, A. da S.; MAGALHÃES JÚNIOR, A.M. de (Ed.). Arroz irrigado no Sul do Brasil. Pelotas: Embrapa Clima Temperado; Brasília: Embrapa Informação Tecnológica, 2004. p.45-74.
STRECK, N.A.; BOSCO, L.C.; LUCAS, D.D.P.; LAGO, I. Modelagem da emissão de folhas em arroz cultivado e em arroz-vermelho. Pesquisa Agropecuária Brasileira, v.43, p.559-567, 2008. DOI: 10.1590/S0100-204X2008000500002.
STRECK, N.A.; MICHELON, S.; BOSCO, L.C.; LAGO, I.; WALTER, L.C.; ROSA, H.T.; DE PAULA, G.M. de. Soma térmica de algumas fases do ciclo de desenvolvimento da escala de COUNCE para cultivares sul-brasileiras de arroz irrigado.
Bragantia, v.66, p.357-364, 2007a. DOI: 10.1590/S0006-87052007000200020.
STRECK, N.A.; PAULA, F.L.M. de; BISOGNIN, D.A.; HELDWEIN, A.B.; DELLAI, J. Simulating the development
of field grown potato (Solanum tuberosum L.). Agricultural
and Forest Meteorology, v.142, p.1-11, 2007b. DOI: 10.1016/j. agrformet.2006.09.012.
VENKATARAMAN, S.; STEINMETZ, S.; CRUZ, R.T.;
DAS, H.P. Agrometeorology and rice production. In: GUIDE to agricultural meteorological practices. Genebra: World Meteorological Organization, 2007. Chapter 13f, 42p. Available
at: <http://www.agrometeorology.org/files-folder/repository/
gamp_chapt13F.pdf>. Accessed on: Apr. 29 2016.
WREGE, M.S.; STEINMETZ, S.; REISSER JÚNIOR, C.; DE ALMEIDA, I.R. Atlas climático da Região Sul do Brasil: estados do Paraná, Santa Catarina e Rio Grande do Sul. Pelotas: Embrapa Clima Temperado; Colombo: Embrapa Florestas, 2011. 336p.
YAN, C.; CHEN, H.; FAN, T.; HUANG, Y.; YU, S.; CHEN,
S.; HONG, X. Rice flag leaf physiology, organ and canopy
temperature in response to water stress. Plant Production Science, v.15, p.92-99, 2012. DOI: 10.1626/pps.15.92.