doi:10.1017/S1751731113000712
Prediction of the energy values of feedstuffs for broilers using
meta-analysis and neural networks
F. C. M. Q. Mariano
1-, C. A. Paixa˜o
2, R. R. Lima
1, R. R. Alvarenga
3, P. B. Rodrigues
3and
G. A. J. Nascimento
41
Department of Exact Science, Federal University of Lavras, PO Box 3037, 37200-000 Lavras, Minas Gerais, Brazil;2Applied Mathematics School, Getulio Vargas Foundation, 22250-900 Rio de Janeiro, Rio de Janeiro, Brazil;3Department of Animal Science, Federal University of Lavras, PO Box 3037, 37200-000 Lavras, Minas Gerais, Brazil;4Department of Animal Science, Federal University of Ceara´, PO Box 12168, 60455-970 Fortaleza, Ceara´, Brazil
(Received 8 June 2012; Accepted 11 March 2013; First published online 1 May 2013)
Several researchers have developed prediction equations to estimate the metabolisable energy (ME) of energetic and protein concentrate feedstuffs used in diets for broilers. The ME is estimated by considering CP, ether extract, ash and fibre contents. However, the results obtained using traditional regression analysis methods have been inconsistent and new techniques can be used to obtain better estimate of the feedstuffs’ energy value. The objective of this paper was to implement a multilayer perceptron network to estimate the nitrogen-corrected metabolisable energy (AMEn) values of the energetic and protein
concentrate feeds, generally used by the poultry feed industry. The concentrate feeds were from plant origin. The dataset contains 568 experimental results, all from Brazil. This dataset was separated into two parts: one part with 454 data, which was used to train, and the other one with 114 data, which was used to evaluate the accuracy of each implemented network. The accuracy of the models was evaluated on the basis of their values of mean squared error,R2, mean absolute deviation, mean absolute percentage error and bias. The 7-5-3-1 model presented the highest accuracy of prediction. It was developed an Excel RAMEn calculator by using the best
model, which provides a rapid and efficient way to predict the AMEn values of concentrate feedstuffs for broilers.
Keywords: avian production, broilers, metabolisable energy, multilayer perceptron
Implications
It is difficult and expensive to estimate the nitrogen-corrected metabolisable energy (AMEn) values of the feed-stuffs used for broilers. The results of this study demonstrate that the implementation of multilayer perceptron networks (MLP) in a meta-analysis is suitable to estimate these energy values. Furthermore, a calculator was created on the basis of the results of the MLP, which allows an efficient way of predicting the AMEn values.
Introduction
Knowledge of the chemical composition and metabolisable energy (ME) of feedstuffs is necessary to provide an ade-quate supply of nutrients and energy for animals. A variety of feedstuffs and their by-products are used in diets, and it is important to know accurately the dietary nutrients that each contains. The energy content of feedstuffs may be determined
using metabolic bioassays (Rodrigueset al., 2001; Zhaoet al., 2008; Wan et al., 2009), which are onerous and time-consuming. Alternative ways to obtain these values include using the composition of feedstuffs and nutritional compo-sition tables, and prediction equations based on the chemical composition of the feedstuffs.
Several studies have developed prediction equations to estimate the ME using regression methods. However, the results obtained using traditional regression methods have been inconsistent (Alvarenga et al., 2011). An interesting way to obtain prediction equations that yield more con-sistent results is to combine information derived from data collected under different but related conditions. This method uses regression theory by considering the meta-analysis principle.
Meta-analysis is a relevant method for summarising and quantifying knowledge acquired through previously pub-lished research (Sauvantet al., 2008). Although the papers involve the same subject, in meta-analyses it is important that homogeneous groups of papers are formed. This is one of the greatest difficulties in the development of meta-analysis
(Fagardet al., 1996; Lovattoet al., 2007). In some studies, homogeneous groups of papers used to develop prediction equations for the AMEn of broiler feedstuffs were obtained by combining levels of different factors (Nascimentoet al., 2009 and 2011) or by using the multivariate technique of principal components (Marianoet al., 2012).
Neural Networks is a term that denotes sets of connec-tionist models inspired by the neurological structures and processing function of the central nervous system of living beings, being an adaptive system that changes its structure based on external or internal information that flows through the network (Bishop, 1995; Haykin, 2007). In an artificial neural network (ANN), a neuron processes the weighted inputs and computes a single output by using an activation function. As an ANN consists of an interconnected group of artificial neurons, a neuron processes the received informa-tion from other neurons, which are called inputs. Although the neuron is a computational unit, neurons may be com-bined into layers to create an efficient network that can learn to distinguish behavioural patterns (Haider and Hanif, 2009). The ANN has some advantages. The ANN does not need restrictive assumptions and it has the ability to learn general solutions on the basis of the data given for training (adaptive learning), to create its own organisation or representation of the information received during learning time and to analyse complex patterns. Although ANN is considered robust and flexible, there are some drawbacks in its use: it requires a large and high-quality training dataset; it is necessary to compare different architectures to select the best; the vari-ables used in an ANN must be carefully selected a priori; and there is risk of overfitting (Balcean and Ooghe, 2004).
Artificial neural network can be applied with different objectives, such as pattern recognition systems, data pro-cessing, function approximation and clustering. The ANN has also been used as a form of prediction. Gheyas and Smith (2011) proposed an ANN for time series forecasting. Okut
et al.(2011) predicted body mass index using a regularised neural network. ANN has also been used to predict ME (Ahmadiet al., 2007 and 2008; Peraiet al., 2010). The multi-layer perceptron neural network (MLP) has been successfully applied to predict the true metabolisable energy (TMEn) values of meat and bone meal samples (Peraiet al., 2010).
An MLP consists of a set of source nodes, which form the input layer of the network. All others layers are composed of neurons that present computational capacity, as shown in Figure 1. This type of neural network is a progressive net-work in which the outputs of the neurons are connected only to the inputs of neurons of the next layer, without connections within the layers. Consequently, the input signal propagates through the network, layer by layer, in a progressive direction (Bishop, 1995; Haykin, 2007).
The objective of this study was to estimate the AMEn values of the energetic and protein concentrate feeds of plant origin used for broilers by using an MLP in a meta-analysis study. It will be created an Excel RAMEn calculator,
which can be used by the animal nutritionists to predict AMEn for feedstuff samples.
Material and methods
Data source
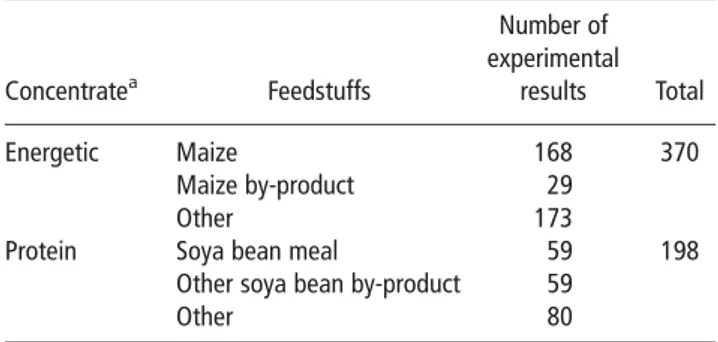
The database used for the meta-analysis has been catalo-gued and described previously by Nascimento et al. (2009 and 2011). A bibliographical review of studies carried out in Brazil was performed to collect information concerning the AMEn values and chemical composition of feedstuffs for broilers. All feedstuffs were of plant origin. The database included a total of 568 experimental results corresponding to 370 energetic concentrate and 198 protein concentrate samples evaluated in experiments executed from 1967 to 2007 (Table 1).
The AMEn, the chemical composition values (CP; ether extract without acid hydrolysis – EE; ash; crude fibre – CF), the classification of the feedstuff category (1 – energetic concentrate; 2 – protein concentrate), the specification of the ingredient (1 – maize or soya bean meal; 2 – maize by-product or other soya bean by-by-product; 3 – other feedstuff) and the type of animal used in the bioassay (1 – chick; 2 – rooster) were defined for each feeds. The AMEn was determined on the basis of a bioassay. The NDF and ADF values were not considered because this information was not available in the vast majority of experimental results. The list of references used for the meta-analysis is provided in the Supplementary Material; references for the energetic concentrates are provided in Supplementary Material 1; and
Figure 1 Structure of a multilayer perceptron with two hidden layers.
Table 1 Number of experimental results considered in this study grouped by concentrate and feedstuff types
Concentratea Feedstuffs Number of experimental results Total Energetic Maize 168 370 Maize by-product 29 Other 173
Protein Soya bean meal 59 198
Other soya bean by-product 59
Other 80
references for the protein concentrates are provided in Supplementary Material 2.
Model development
The AMEn values of concentrate feedstuffs were predicted from an MLP using the meta-analysis principle. The dataset, part of which is presented in Table 2, was randomly parti-tioned into two separate subsets: one, comprising 80% (454 studies) of the data, was used as training set in the devel-opment of the network; the second one, comprising 20% (114 studies) of the data, was used as test set. The training data should not be used to test the network because the network can memorise the data pattern and the test procedure would not be reliable.
The input parameters of the implemented MLP were feedstuff categories (CAT), concentrate ingredients (ING), type of animals used in the bioassay (ANIMAL), CP, EE, MM and CF. The AMEn column (Table 2) was the values of desired output.
Different structures were implemented with the objective of selecting the best one. In the general way, the structured was defined as 7-p-q-1, which represents: seven inputs,
pneurons in the first hidden layer,qneurons in the second hidden layer and one output. Values from 1 to 10 were considered for both p and q. The MLP proposed contains two hidden layers because this structure allows any function approximation (Cybenko, 1988).
A backpropagation algorithm was used to train the net-work. This algorithm is based on the error-correction learning rule, which is propagated backward from the output layer to hidden layers of the ANN (Rumelhartet al., 1986). Basically, this algorithm iteratively adjusts the weights to the network randomly, presenting examples to the neural network as an input signal (Albuquerque et al., 2009). The algorithm minimises the mean square error (m.s.e.) of prediction,
whose error is the difference between the desired outcome from the data input and the predicted response from the output neuron.
The software FANN TOOL 1.2 (http://code.google.com/p/ fanntool/) was used to implement the networks. The selected training algorithm was the iRPROP, which was described by Igel and Husken (2000). The initial weights were randomly defined by the software, and the network was trained up to 500 000 epochs. The activation function for the hidden neurons was the fast ‘sigmoid-like’ function and for the output neuron was the periodical cosinus function. The learning rate and momentum for network training were set, respectively, at 0.7 and 0. The goodness of fit of the model and the accuracy of the predicted AMEn were evaluated using the training and testing data. The measures used in this process were as follows: Coefficient of determination (R2), m.s.e., mean absolute deviation (MAD), mean absolute percentage error (MAPE) and bias, as defined in Bolzanet al.
(2008) and Peraiet al.(2010). Results and discussion
Two MLP models, which presented the best accuracy in the prediction of the AMEn values, were selected. A summary of statistical results associated with these two MLP models is shown in Table 3. These statistics indicate forecasting error measurements based on the difference between observed and predicted values. The closer to one the R2 value, the closer to zero the bias value, and the lower m.s.e., MAPE and MADE values, the more accurate is the model.
The 7-5-3-1 model had lower values of m.s.e., MAD and MAPE than the 7-5-5-1 model, both training and test data-set. Furthermore, the first model presented values of R2
closer to one, and the MLP training bias closer to zero, than the second one. Thus, the 7-5-3-1 model was considered
Table 2Data sample lines used to develop the multilayer perceptron network model to predict the AMEn values (on dry matter basis) of feedstuffs for broilers
Inputs Output
No. CPa EEa Asha CFa CAT ING ANIMAL AMEn (kcal/kg)
1 10.92 4.03 1.81 1.92 1 1 1 3573 2 10.75 3.53 1.82 2.00 1 1 1 3560 . . . . . . . . . . . . 302 11.80 2.40 3.20 6.50 1 2 1 2700 303 1.76 0.06 3.01 17.67 1 3 2 2340 . . . . . . . . . . . . 567 32.02 10.4 4.95 2.50 2 3 2 1620 568 32.02 10.4 4.95 2.50 2 3 2 2310
AMEn 5 nitrogen-corrected metabolisable energy; EE 5 ether extract; CF 5 crude fibre; n 5 number of data; CAT 5 classification of the feedstuff category: 1 – energetic concentrate; 2 – protein concentrate; ING 5 specification of the ingredient: 1 – maize or soya bean meal; 2 – maize by-product or other soya bean by-product; 3 – other feedstuff; ANIMAL 5 type of animal used in the bioassay: 1 – chick; 2 – rooster.
more suitable to predict the AMEn for both the energetic and protein feedstuffs for broilers.
The selected MLP model has higher prediction accuracy (higherR2values) than the models obtained by Nascimento
et al.(2009) and Marianoet al.(2012). These authors had obtained equations to predict the AMEn for both the ener-getic and protein feedstuffs for broilers, by using meta-analysis and regression methods. Their models presentedR2
values approximately equal to 0.83 and 0.74, respectively. In general, there was better prediction of AMEn using the training dataset than testing dataset (Table 3). Ahmadiet al. (2007) had also found these same differences between the two datasets. The values for the m.s.e. are into the interval presented by Peraiet al.(2010). These authors found m.s.e. values between 2338.1875 and 91 335.17. Peraiet al.(2010) obtained m.s.e. values for the ANN model lower than the m.s.e. values presented in the Table 3. However, they used a specific protein feedstuff. In this paper, 568 AMEn values of energetic and protein feedstuffs were used. These feedstuffs have a higher variability in the AMEn values, and this leads to an increase in the m.s.e.
It is important to note that a larger dataset was used in the ANN procedure because this improves the chance of obtaining better adjustments (Bishop, 1995). This is impor-tant because the statistics used to check for ANN con-vergence are usually better estimated when the dataset is larger. Ahmadi et al. (2008) used just 30 raw data lines consisting of 12 feather meal (FM) and 18 poultry offal meal (POM) samples to train a group method of data handling-type neural network (GMDH-handling-type NN). Another group with seven data lines (three FM and four POM) were used as validation set of the ANN. Peraiet al.(2010) used 34 raw lines and only one feedstuff (meat and bone meal-MBM). Although Ahmadiet al.(2008) and Peraiet al.(2010) used a small dataset, their prediction was accurate. This most likely occurred because they used specific feedstuffs. In this study, an ANN was developed to predict the AMEn for energetic and protein concentrates, though it is important to empha-sise that the implemented MLP is more suitable to predict the AMEn of the feedstuffs commonly used in poultry feeds, such as maize, sorghum, soya bean, soya bean meal, wheat and wheat meal.
The predicted v. observed values of the test data are presented in Figure 2. Points closer to the identity line indi-cate that the predicted values are similar to the observed data. Therefore, the predicted values obtained using MLP tend to follow the same patterns as the observed data. These results indicate that the AMEn values were accurately predicted.
It can be observed in the Figure 2 that there are few points that the predictions are quite off the mark. Some points indicate that the difference between the observed and the predicted AMEn values (error) is equal to plus or minus 1000 kcal. These points refer to the feedstuffs that are not commonly used in poultry feeds. Moreover, there is a small number of these feedstuffs in the dataset, which affect the accuracy of prediction. For these feedstuffs, there is no pro-cessing pattern, resulting in a considerable variation in their chemical composition and, consequently, in their energy value (Rodrigueset al., 2001; Moreiraet al., 2002; Brunelli
et al., 2006).
No general criterion exists to define the number of neu-rons in the hidden layer. In general, neural networks with few hidden neurons are preferred because they tend to have better generalisation power, thereby reducing the problem of overfitting. However, networks with few hidden neurons may not be able to model and learn the data in complex problems, and this can result in underfitting, that is, the network does not converge during training (Pereira, 1999; Caloˆbaet al., 2002).
In some of the cases where the number of neurons in the single hidden layer becomes high, the use of two or three layers may sometimes allow the number of neurons in the hidden layer to be reduced (Santoset al., 2005). According to Wijayasekaraet al.(2011), the chance of over-training a network increases with the number of neurons and the number of training epochs. Thus, as the number of neurons increases, the possibility of the network describing the training data pattern exactly also increases. This is an undesirable ANN behaviour because the objective is to obtain an MLP that accurately predicts the AMEn values.
The prediction of energy values by using regression mod-els considers just chemical composition variables (Zhao
et al., 2008; Wanet al., 2009; Marianoet al., 2012). The MLP
Table 3Statistics used to check the goodness-of-fit and the accuracy of the two best multilayer perceptron network models
7-5-3-1 model 7-5-5-1 model Statistics MLP training MLP testing MLP training MLP testing
R2 0.91 0.86 0.89 0.83
m.s.e. 44 933.39 86 725.77 58 531.42 104 091.40
MAD 152.00 210.27 160.12 215.58
MAPE (%) 5.21 8.30 5.76 8.39
Bias 20.31 226.34 1.00 21.54
R25coefficient of determination; MAD 5 mean absolute deviation; MAPE 5 mean absolute percentage error; m.s.e. 5 mean square error.
1000 1500 2000 2500 3000 3500 4000 4500 1000 2000 3000 4000 Observed AMEn Predicted AMEn Identity Line
Predicted x Observed AMEn
Figure 2 Predicted v. observed AMEn values obtained from the test dataset for concentrate feedstuffs for broilers.
can be fit by using other factors in addition to chemical composition, which is a great advantage. These factors can influence the AMEn and can improve its prediction. The type of the feedstuffs (energetic or protein concentrate), the specification of the ingredient (maize, soya bean meal and their similar products or others feedstuffs) and the type of animal used in the bioassay (chick or rooster) were con-sidered to fit the MLP model, as these variables affect the AMEn variability.
The results obtained in this study support the findings of previous studies, in that the use of ANN has demonstrated promising results regarding predictions in the science poultry field, including the evaluation of broiler diets. Peraiet al.
(2010) compared the performance of three-layer feedfor-ward ANN, partial least squares (PLS) and multiple linear regression (MLR) methods to predict the TMEn values of meat and bone meat samples based on their chemical composition. The results demonstrated that the ANN model outperformed the PLS and MLR models. A GMDH-type NN accurately predicted broiler performance on the basis of dietary metabolisable energy, methionine and lysine (Ahmadi et al., 2007) and predicted the TMEn values of feather and POMs on the basis of their chemical composition (Ahmadiet al., 2008).
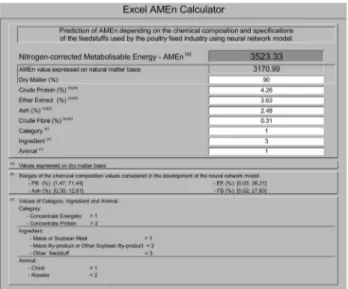
Once selected the best MLP model, an Excel R
AMEn Calculator was created (Figure 3). This AMEn Calculator enables the animal nutritionists to use this tool to predict AMEn for feedstuff samples. It is provided in Supplementary Material 3. Furthermore, it is intended to leave it available in conjunction with the nutritional composition tables. Although only Brazilian data (preliminary study) were used in the development of the MLP, this calculator could be used with data from international origin.
In future studies, the dataset including other experimental results from Brazilian and other countries studies will be updated. The objective will be to improve the accuracy of the AMEn prediction for broilers by using the ANN model.
Other types of ANN and additional techniques will be explored in order to optimise generalisation of the networks (e.g. cross-validation, early stopping and identification of important input parameters in building a MLP).
Conclusion
The MLP with the best performance has a structure of seven inputs, five neurons in the first hidden layer, three neurons in the second hidden layer and one neuron as output. This result revealed that use of MLP method is a promising approach for the accurate prediction of AMEn values of energetic and protein concentrate feeds used in broiler diets. The Excel R
AMEn calculator developed in this study is an efficient and easy way to predict the AMEn values by using ANN.
Acknowledgements
The authors gratefully acknowledge financial supports provided by the Coordination Improvement of Higher Education Students (CAPES) and by the National Council for Scientific and Techno-logical Development – Brazil (CNPq). The authors would also like to thank the editor Jaap van Milgen and the anonymous reviewers for their valuable comments and suggestions to improve the quality of this paper.
Supplementary materials
For supplementary materials referred to in this article, please visit http://dx.doi.org/10.1017/S1751731113000712
References
Ahmadi H, Mottaghitalab M and Nariman-Zadeh N 2007. Group method of data handling-type neural network prediction of broiler performance based on dietary metabolizable energy, methionine, and lysine. Journal of Applied Poultry Research 16, 494–501.
Ahmadi H, Golian A, Mottaghitalab M and Nariman-Zadeh N 2008. Prediction model for true metabolizable energy of feather meal and poultry offal meal using group method of data handling-type neural network. Poultry Science 87, 1909–1912.
Albuquerque VHC, Alexandria AR, Cortez PC and Tavares JMRS 2009. Evaluation of multilayer perceptron and self-organizing map neural network topologies applied on microstructure segmentation from metallographic images. NDT & E International 42, 644–651.
Alvarenga RR, Rodrigues PB, Zangeronimo MG, Freitas RTF, Lima RR, Bertechini AG and Fassani EJ 2011. Energetic values of feedstuffs for broilers determined with in vivo assays and prediction equations. Animal Feed Science and Technology 168, 257–266.
Balcean S and Ooghe H 2004. Alternative methodologies in studies on business failure: do they produce better results than the classical statistical methods? Working Paper of Faculty of Economics and Business Administration, Ghent University, Belgium, 40pp.
Bishop CM 1995. Neural networks for pattern recognition. Oxford University Press, Oxford, UK, 482pp.
Bolzan AC, Machado RAF and Piaia JCZ 2008. Egg hatchability prediction by multiple linear regression and artificial neural networks. Brazilian Journal of Poultry Science 10, 97–102.
Brunelli SR, Pinheiro JW, Silva CA, Fonseca NAN, Oliveira DD, Cunha GE and Souza LFA 2006. Feeding increasing defatted corn germ meal levels to broiler chickens. Brazilian Journal of Animal Science 35, 1349–1358.
Cloˆba GM, Cloˆba LP and Saliby E 2002. Cooperac¸a˜o entre redes neurais artificiais e te´cnicas cla´ssicas para previsa˜o de demanda de uma se´rie de vendas de cerveja na Austra´lia. Pesquisa Operacional 22, 345–358.
Figure 3 Excel Rcalculator to predict the AMEn values of concentrate
Cybenko G 1988. Continuos valued neural network with two hidden layers are sufficient. Technical Report, Departament of Computer Science, Tufts University, Medford, MA, USA.
Fagard RH, Staessen JA and Thijs L 1996. Advantages and disadvantages of the meta-analysis approach. Journal of Hypertension 14 (suppl. 2), 9–13. Gheyas IA and Smith LS 2011. A novel neural network ensemble architecture for time series forecasting. Neurocomputing 74, 3855–3864.
Haider A and Hanif MN 2009. Inflation forecasting in Pakistan using artificial neural networks. Pakistan economic and social review 47, 123–138. Haykin S 2007. Neural networks – a comprehensive foundation, 3rd edition. Prentice-Hall Inc., Upper Saddle River, NJ, USA.
Igel C and Hu¨sken M 2000. Improving the RPROP learning algorithm. Proceedings of Second International Symposium on Neural Computing NC 2000, 23–26 May, Berlin, Germany, pp. 115–21.
Lovatto PA, Lehnen CR, Andretta I, Carvalho AD and Hauschild L 2007. Meta analysis in scientific research: a methodological approach. Brazilian Journal of Animal Science 36 (suppl.), 285–294.
Mariano FCMQ, Lima RR, Rodrigues PB, Alvarenga RR and Nascimento GAJ 2012. Prediction equations of energetic values of feedstuffs obtained using meta-analysis and principal components. Cieˆncia Rural 42, 1634–1640. Moreira I, Ribeiro CR, Furlan AC, Scapinello C and Kutschenko M 2002. Utilization of defatted corn germ meal on growing-finishing pigs feeding – digestibility and performance. Brazilian Journal of Animal Science 31, 2238–2246.
Nascimento GAJ, Rodrigues PB, Freitas RTF, Allaman IB, Lima RR and Reis Neto RV 2011. Prediction equations to estimate the AMEn values of protein feedstuffs for poultry utilizing meta-analysis. Brazilian Journal of Animal Science 40, 2172–2177. Nascimento GAJ, Rodrigues PB, Freitas RTF, Bertechini AG, Lima RR and Pucci LEA 2009. Prediction equations to estimate the energy values of plant origin concentrate feeds for poultry utilizing the meta-analysis. Brazilian Journal of Animal Science 38, 1265–1271.
Okut H, Gianola D, Rosa GJM and Weigel KA 2011. Prediction of body mass index in mice using dense molecular markers and a regularized neural network. Genetical Research 93, 189–201.
Perai AH, Moghaddam HN, Asadpour S, Bahrampour J and Mansoori GH 2010. A comparison of artificial neural networks with other statistical approaches for the prediction of true metabolizable energy of meat and bone meal. Poultry Science 89, 1562–1568.
Pereira BB 1999. Introduction to neural networks in statistics. Center of Multivariate Analysis, Technical Report, Pennsylvania State University, Pennsylvania, USA. Rodrigues PB, Rostagno HS, Albino LFT, Gomes PC, Barboza WA and Santana RT 2001. Energy values of millet, corn and corn byproducts, determined with broilers and adult cockerels. Brazilian Journal of Animal Science 30, 1767–1777. Rumelhart DE, Hinton GE and Williams RJ 1986. Learning internal representa-tions by error propagation. In Paralled distributed processing: explorarepresenta-tions in the microstructure of cognition, vol. 1: foundations (ed. DE Rumelhart and JL McClelland), pp. 318–362. The MIT Press, Cambridge, MA.
Santos AM, Seixas JM, Pereira BB and Medronho RA 2005. Using artificial neural networks and logistic regression in the prediction of Hepatitis A. Revista Brasileira de Epidemiologia 8, 117–126.
Sauvant D, Schmidely P, Daudin JJ and St-Pierre NR 2008. Meta-analyses of experimental data in animal nutrition. Animal 2, 1203–1214.
Wan HF, Chen W, Qi ZL, Peng P and Peng J 2009. Prediction of true metabolizable energy from chemical composition of wheat milling by-products for ducks. Poultry Science 88, 92–97.
Wijayasekara D, Manic M, Sabharwall P and Utgikar V 2011. Optimal artificial neural network architecture selection for performance prediction of compact heat exchanger with the EBaLM-OTR technique. Nuclear Engineering and Design 241, 2549–2557. Zhao F, Zhang HF, Hou SS and Zhang ZY 2008. Predicting metabolizable energy of normal corn from its chemical composition in adult pekin ducks. Poultry Science 87, 1603–1608.