Dissertation Report
Master in Product Design Engineering
Product Design with Scrap Tires
Bilal Chabane Chaouch
Dissertation Report
Master in Product Design Engineering
Product Design with Scrap Tires
Bilal Chabane Chaouch
Dissertation developed under the supervision of Doctor João Matias, professor at the School of Technology and Management of the Polytechnic Institute of Leiria.
II
III
Acknowledgements
Vɣiɣ aḍḥemḍaɣ rebi ḍamezwaro, aḍcakraɣ imalaniw ilkoli syessen ilḥakaɣ assayi ɣwayen iyevɣiɣ
I am willing to express my deep gratitude for; Doctor João Matias, for his guidance, support and supervising during the whole project. For all professor from Product Design Engineering master especially; Doctor Fábio Simões and Doctor Carlos Capela for their constant assistance since the beginning of the master program.
My special thanks for all my friends who always stand-up for me, helped and supported me at all the stages. I am eager to show my gratefulness for Tiger Prod and all the community of Salahifs.
IV
V
Resumo
No presente estudo, Borracha Granulada de Pneu (GTR) feita a partir de resíduos) de pneus foi misturada com Polipropileno (PP) através do processo de injeção, sem recurso a outros aditivos. Foi investigado o efeito do tamanho da partícula do GTR assim como a composição da mistura utilizada. Para isso foram utilizados dois tamanhos de partícula, 0.25mm e 1mm, em três percentagens de diferentes de composição do material.
As amostras foram testadas e analisadas quanto à dureza Shore, à impermeabilidade, e às propriedades mecânicas e morfológicas. Os testes realizados indicaram que quanto maior for a dimensão da partícula maiores serão os espaços entre os dois componentes, o que provavelmente é a causa do baixo desempenho verificado quando testados à tração.
A adição de GTR ao PP claramente melhorou a impermeabilidade da mistura resultante de PP/GTR, dando indicações de que pode ser utilizada em trabalhos futuros aplicando conceitos de Design, nomeadamente design para o ambiente, para a reciclagem, para a produção e para o custo.
Palavras-chave: Reciclagem, sucata de pneu, granulado de borracha de pneu (GTR),
VI
VII
Abstract
In this study; Ground Tire Rubber (GTR) from scrap tires were blended with Polypropylene (PP) using injection moulding without any additional additives.
The effect of particle size and content was investigated by using 0.25mm and 1mm particles with 3 different level contents.
Testing and analysing the samples for shore hardness, wettability, mechanical and morphological properties. The former showed, the bigger the particle size the bigger are the gaps between the phases which is probably the cause for poor tensile performance reported. Adding GTR to PP clearly enhanced the wettability property, the resultant mixture PP/GTR could be used in future works for achieving Design for Environment, Recycling, Manufacturing and Cost.
Keywords: recycling, scrap tire, Ground Tire Rubber, Thermoplastic elastomers
VIII
IX
List of figures
Figure 2- 1 Cross section of tire [18] ... 4
Figure 2- 2 Breakdown of tire ingredients [21] ... 6
Figure 2- 3 World’s biggest tyre graveyard localised in Kuwait with over 7 million tires [9] ... 7
Figure 2- 4 TIRE INFERNO; A towering cloud of smoke rises from the Rhinehart tire fire in rural Virginia on Oct. 31, 1983 [12] ... 8
Figure 2- 5 Flow of waste tire utilisation [13] ... 9
Figure 2- 6 Hierarchy of waste tire utilization [13] ... 10
Figure 2- 7 ELT management schemes in Europe [44] ... 11
Figure 2- 8 Boat bumper and sound absorbing wall [17]... 13
Figure 4- 1 Sieving Diagram [78] ... 19
Figure 4- 2 The sieves column mounted on the shaker base... 20
Figure 4- 3 GTR(DUST) sieving analysis test ... 21
Figure 4- 4 GTR(MIXED) sieving analysis test ... 21
Figure 4- 5 Werner & Pfleiderer ZSK25x38D extruder ... 22
Figure 4- 6Granulator and Werner & Pfleiderer ZSK25x38D extruder ... 23
Figure 4- 7 Boy 22A injection machine ... 24
Figure 4- 8 Mould used for tensile samplesz ... 25
Figure 5- 1 Diagram of a durometer indenter or presser foot used for Shores A and D [82] ... 26
Figure 5- 2 Thermoplastic hardness range[65] ... 27
Figure 5- 3 Shore D test equipment ... 28
Figure 5- 4 Illustration of contact angles formed by sessile liquid drops on a smooth homogeneous [36] ... 29
Figure 5- 5 ATTENSION THETA used for contact angle test ... 30
Figure 5- 6 (a) Load-elongation curve from a tensile test and (b) corresponding engineering stress-strain curve. Specimen diameter, 12.5 [68] ... 31
Figure 5- 7 Engineering stress-strain curve showing elastic and plastic deformation [88] ... 32
Figure 5- 8 Test specimen types 1A and 1B [72]... 34
X
Figure 5- 10 SkyScan-Bruker used for micro CT test [78] ... 36
Figure 5- 11 Mean of hardness values from different mixtures ... 37
Figure 5- 12 Shore A-D hardness scale cross references [35] ... 38
Figure 5- 13 Contact angle mean for different mixtures ... 39
Figure 5- 14 Tensile strength of different mixtures ... 41
Figure 5- 15 Change in tensile strength values (MPa) in function of GTR content . 42 Figure 5- 16 Elastic modulus of different mixtures ... 42
Figure 5- 17 Elongation at break (in %) of different mixtures ... 43
Figure 5- 18 Elongatio at break (%) in function of GTR content ... 44
Figure 5- 19 Modulus of toughness of different mixtures ... 45
Figure 5- 20 stress vs strain for PP100 (pure PP) ... 46
Figure 5- 21 Stress vs Strain for PP70GTR(1mm)30 ... 46
Figure 5- 22 Stress vs strain PP50GTR(1mm)50 ... 46
Figure 5- 23 Stress vs Strain PP70GTR(0.25mm)30 ... 46
Figure 5- 24 Stress vs Strain PP50GTR(0.25mm)50 ... 46
Figure 5- 25 Stress vs Strain PP30GTR(0.25mm)70 ... 46
Figure 5- 26 Engineerng Stress-curves of PP/GTR with different content and particle sizes ... 47
Figure 5- 28 micro-CT result for PP100 ... 48
Figure 5- 29 micro-CT result for PP70 GTR(0.25mm) 30 ... 49
Figure 5- 30 ImageJ result for PP70 GT(0.25mm)30 ... 49
Figure 5- 31 micro-CT result for PP50 GTR(0.25mm)50 ... 50
Figure 5- 32 ImageJ result for PP50 GTR(0.25mm)50 ... 50
Figure 5- 33 micro-CT result for PP30 GTR(0.25mm)70 ... 51
Figure 5- 34 ImageJ result for PP30 GTR(0.25mm)70 ... 51
Figure 5- 35 micro-CT result for PP70 GTR(1mm)30 ... 52
Figure 5- 36 ImageJ result for PP70GTR(1mm)30 ... 52
Figure 5- 37 micro-CT result for PP50 GTR(1mm)50 ... 53
Figure 5- 38 ImageJ result for PP50 GTR(1mm)50 ... 53
Figure 7- 1 Robot arm used for Additive Manufacturing ... 55
Figure 7- 2 3D model used for Additive Manufacturing ... 55
XI
XII
List of tables
Table 2- 1 Typical materials used in tyre manufacturing (in Europe and USA) according to the percentage of the total weight of the finished tyre that
each material class represents [14] ... 9
Table 2- 2 General methods of waste tire downsizing [3] ... 13
Table 4- 1 Mixtures prepared for processing ... 22
Table 4- 2 Extrusion temperatures in each zone ... 23
Table 4- 3 Injection machine parameters [75] ... 24
Table 4- 4 Injection parameters used for each mixture ... 25
Table 5- 1 Shore Test conditions ... 28
Table 5- 2 Shore D hardness values of different mixtures ... 37
Table 5- 3 Contact angles values for different mixtures ... 39
Table 5- 4 Tensile test result for different mixtures ... 41
XIII
List of
acronyms
ETRMA ETRMA-European Tyre & Rubber Manufacturers' Association RMA Rubber Manufacturers Association
JATMA Japan Automobile Tyre Manufacturers Association WVSCD World Business Council for Sustainable Development GTR Ground Tire Rubber
PP Polypropylene ELT End of Life Rubber WTR Waste Tire Rubber TPE Thermoplastic elastomer RTR Reclaimed Tire Rubber
DGTR Devulcanized Ground Tire Rubber
CDRSP Centro para o Desenvolvimento Rápido e Sustentavel do Produto IPL Instituto Politécnico de Leiria
IP Injection Pressure IV Injection Velocity 2IP 2nd Injection Pressure HT Holding Time
IT Injection Time wt% Weight percent
ASTM American Society for Testing and Materials ISO International Organization for Standardization γlv Liquid-vapor interfacial tension
γsv Solid-vapor interfacial tension
γsl Solid-liquid interfacial tension
θY Contact (or Young’s) angle
s Engineering (or nominal) stress F Tensile force
A0 Initial cross-sectional area of the gauge e Engineering (or nominal) strain
ΔL Change in gauge length L0 Initial gauge length
XIV E Elastic modulus
s’ True stress
A Actual (instant) area e’ True strain
Ut Modulus of toughness CT Computed Tomography STD Standard deviation WPE Waste Polyethylene EB Elongation at break
LDPE Low-Density Polyethylene
EPDM Ethylene-Propylene Diene Monomer GD&T Geometric Dimensioning and Tolerancing
XV
XVI
Table of Contents
ACKNOWLEDGEMENTS III RESUMO V ABSTRACT VII LIST OF FIGURES IXLIST OF TABLES XII
LIST OF ACRONYMS XIII
TABLE OF CONTENTS XVI
1. INTRODUCTION 1
2. RESEARCH BACKGROUND 4
2.1. Tire Composition 4
2.2. Discarded Tire Problematic 6
2.3. Waste Tire Reuse 8
2.3.1. Management of Used Tires in Europe 10
2.3.2. Recycling Waste Tires 12
2.4. Waste Tire Applications 13
3. GTR AND RTR IN POLYMER BLENDS 16
3.1. GTR in Thermoplastics 16
3.2. GTR in thermosets 17
3.3. GTR in rubbers 17
3.4. Plastic and rubber compatibility 17
4. TEST SAMPLES’ PREPARATION 19
4.1. Materials Preparation 19
XVII
4.2.1. Mixtures preparation 21
4.2.2. Extrusion process 22
4.2.3. Injection moulding 24
5. CHARACTERIZATION TECHNIQUES AND TESTS 26
5.1. Hardness Test 26
5.1.1. Shore (Durometer) Hardness 26 5.1.2. Test Procedure (ISO 868) 27
5.2. Contact Angle (wettability) Test 29
5.3. Tensile test (ISO 527) 30
5.3.1. Tensile specimens 33
5.3.2. Tensile machine 34
5.4. Morphology Test 35
6. RESULTS AND DISCUSSION 37
6.1. Shore Hardness Test 37
6.2. Contact Angle Test 39
6.3. Tensile Test 40 6.3. Morphology Test 48 7. CONCLUSIONS 54 REFERENCES 58 APPENDICES 68 Appendix A 68 Appendix B 69 Appendix C 70
XVIII
1
1. Introduction
The energy crisis and environmental degradation are amongst the main problems mankind is facing today. These problems owe their origin to a growing population, rapid industrialization and huge quantities of solid refuse, which are generated daily. It has become imperative to make use of appropriate technologies to alleviate part of our energy crisis and environmental degradation for the possible recovery of resources from non-conventional sources, like municipal and/or industrial wastes, refused plastics, scrap tires and others. The disposal of these solid wastes from human activity is a growing environmental problem for modern society, especially in developing countries [1].
Back to history, there have always been elements of re-use, and some industries or sectors have always reused raw materials. In fact, until the industrial revolution "re-use until the point of no return" was probably the norm. Wood, stone, metal, clothing etc., were all reused until they had no value or use left. Then the time of the industrial revolution arrived and it was discovered how to increase production rate and efficiency, they could make many things quickly and cheaply and the society became an increasingly throwaway society. Until a day where landfills became open mines for resources such as rubber, plastics and other long lived materials [2], [3].
Although scrap tires account for only 2wt% of total waste [4], their management is attracting growing interest in developed countries. This interest might be the consequence of the environmental problems they may generate through inappropriate management, on one hand, on the other with the increasing demand for recycling raw materials. European Union has introduced directives for the management of scrap tires including the European commission’s landfill Directive (1999). The commission has banned the disposal of scrap tires to landfill since 2006 and the European End Life Vehicle Directive 2000 which requires that the 80% in weight of an end of life vehicle must be recycled [5],[6],[7]. In another meaning, it proposes the following routine: to reduce, to reuse, to recycle, and finally, to perform an energy valorisation process. Although it would be desirable to implement only the three first strategies, waste tire generation is so high that it is unavoidable to make use of energy valorisation process. In Europe, the main methods for scrap tires management are materials recovery (38.7%), energy recovery (32.3%) or retreading (11.3%) [8]. But globally, wide spread in the world, approximately 64% of used tires went to landfill or were illegally dumped or stockpiled, while only 13% were recycled [8],[9].
2 According to the analysis of Sienkiewicz et al. [10] on the analysis done to the reports issued by the largest associations of tyres (ETRMA [2], RMA [11], JATMA [12],WBCSD [13]), the growth in the number of used tires around the globe is becoming alarming and rapid measures should be taken.
At each stage of product design, decisions about the materials from which the product will be made is required and as well the production process corresponding to that material. Final product cost is directly influenced by both materials and the process. The engineer, to make his decisions needs the characteristics of that material and the process corresponding [14]. To develop products with scrap tires, hence, it is required first to study the material and the process.
Based on this latter and the scrap tires environment effect, the present study took its motivations on the sake of synthesizing cheap & eco-friendly thermoplastic based on ground tire rubber (GTR). It was chosen Polypropylene (PP) as the polymer matrix following its proven properties, processability and price. An injection moulding as the process, since Scaffaro et al. [15] had proven that the samples produced with injection machining (because of additional mixing in the fuse and the compacting force) offers better properties than compression moulding.
This report highlights how thermoplastic based on GTR can be considered for manufacturing products while complying with principals of Design for Environment and for Recycling (since it is based on reusing waste in spite of a raw material) and Design for Manufacturing and for Cost (since it is based on injection moulding “of waste-cheap material” which by itself can reach massive production rate at small cost).
The main objective of the study is, while injecting PP/GTR of two different particle sizes using different percentages of GTR, to investigate the effect of PP/GTR rubber particle size and composition into, shore hardness, wettability, mechanical and morphological properties.
This report is divided into seven main chapters as following explained:
1- Introduction; addressing waste tire issue in general and how the study is aiming to contribute to the solution.
2- Research Background; a literature review is presented about tire composition, the problematic of wasted tires, the present use of wasted tire, recycling methods and its management in Europe.
3 3- GTR & RTR in Polymer Blends; current of past work on blending tire rubber with
different polymers (thermoplastics, thermosets and rubbers).
4- Test Samples’ Preparation: summarizes the materials and the processing methods used.
5- Characterization Techniques and Tests; explains different test performed and their respective processed methods.
6- Results and Discussion: shows the results of the tests performed while comparing with relevant works.
7- Conclusion; summarizes the conclusions on the results and addresses the tasks that could be performed in future.
4
2. Research Background
2.1. Tire Composition
In a technical definition; a tire is a hollow-round shape covering the perimeter of a wheel. It is on most ground vehicles to protect the wheel from wear and tear as well as to provide the friction between the vehicle and the road needed for acceleration and handling. The main functions of tire are supporting vehicle loading, transmits vehicle propulsion and braking, maintaining or changing the vehicle direction, and absorbing road shocks [16], [17]. A tire skeleton is composed of several parts as can be seen form Figure 2- 1 which depicts a tire cross section.
Figure 2- 1 Cross section of tire [18] The tire parts as shown in Figure 2- 1 are [17]:
- Tread: is the part which is in direct contact with the road surface. It is made of rubber with additions of carbon black and other chemicals.
- Groove: It is kind of a channel within the tread. A tire groove improves driving stability, pulling and braking ability and cooling down the rubber.
- Cap ply: are steel cords stabilize the structure of the tire against internal pressure. - Shoulder: is the section of transition between the edge of the tread and the
sidewall.
- Sidewall: can be considered as a bridge between tread and bead, often strengthened with steel cords or fabric to provide strength and flexibility.
- Carcass: is the tire frame which provides coherence, made of fabric embedded in rubber can be added steel cords.
5 - Apex: is filler providing buffer between bead, inner liner and body ply.
- Bead bundle: are rigid bands of steel wire in rubber compound, it contributes to press the tire to fit on the wheel.
- Belt: are layers of rubber and meticulously spaced steel cords, provide strength while maintaining the flexibility.
- Chafer: is a protection of the steel cords against wear and cutting by the rim, as well as it prevents dirt and moisture from getting into the rim.
- Inner liner: is an air-tight rubber sheet made to hold high-pressure air inside. Tires are made of vulcanized rubber and various reinforcing materials. Natural and synthetic rubbers are commonly used in tires for different purposes. Natural rubber is an essential element of a tyre since it has unique elastic properties. Different types of synthetic rubbers are added to natural rubber to achieve the desired elasticity [17]. Figure 2- 2 depicts the ingredients of a tire which are, in addition to the rubber compound [19], [20]:
- Reinforcing fillers such as carbon black. It is used to strengthen the rubber and make tire have more abrasion resistance and also UV protection from sun light; - Reinforcing fibres such as textile or steel fibres. It is usually in the form of a cord
which is used to provide the reinforcing strength in tires;
- Extenders such as petroleum oils; are used to control the viscosity, reduce internal friction during processing, and improve low temperature flexibility in the vulcanized product;
- Vulcanizing agents such as organ-sulphur compounds. It is used as the chemical agent for the vulcanization process;
- Zinc oxide and stearic acid, used to activate the curing (cross-linking) system and to preserve cured properties.
6 Figure 2- 2 Breakdown of tire ingredients [21]
2.2. Discarded Tire Problematic
In the report of ETRMA of 2015 [2], it was considered that scrap tire recycling (or END-OF-LIFE tire recycling) is a global issue, and how it will be used is both a challenge and an opportunity.
The challenge is derived from many directions, as it can be seen from recent developments it is not because of a lack of ideas, rather than the implementation of those ideas. The great opportunity is the use of these tires recycled rubber that can fit in many sectors such as; construction, urban furniture, traffic accessories and others.
Sienkiewicz et al. [10] reported the yearly amount of used tires is about 17 million tonnes matching the annual production of 1.4 billion. The amount becomes a serious problem when landfilling is being used for tire disposal.
Landfill, which is a site where a disposed waste from different sources are buried [22]. Landfilling is considered as the earliest way on how-to-deal with scrap tires, nonetheless still is one of the most undesirable methods, as it causes severe environmental problems [23], [24].
The shape and impermeability property of discarded tires allow it to hold water for a long period of time. Thus, providing sites for mosquito larva breeding, which can provoke deadly diseases such as dengue, chikungunya and malaria. Disposed tire can also provide breeding ground to other animals such as snakes [25], [26]. Figure 2- 3 shows an aerial view of what is considered as the world’s biggest tyre graveyard localised in the desert of Kuwait, where is disposed over 7 million scrap tires [27].
7 Figure 2- 3 World’s biggest tyre graveyard localised in Kuwait with over 7 million tires [9]
Moreover, disposed tire increases fire threat especially during hot periods. According to Jang et al. [28], a whole disposed tire represents an empty space of 75% which makes it difficult to either quench the fire with water or cut off oxygen supply. Because of the composition of tires, tire-fire can cause surface, subsurface, water and soils contaminations. The fire smoke includes dense black smoke which pollutes the air with toxic gas emissions and impairs visibility [29].
The example of this dangerous situation was the Tire Inferno fire. It took place at storage facility in Rhinehart, Northern Virginia USA, it started on October, 31th, 1983, where it was disposed nearly 7 million tires. Tire inferno, also called the Rhinehart tire fire, burned for nine months! Nearby water sources were polluted with lead and arsenic compounds and it took about 22 years and 12 million US dollars to clean [30][31]. Figure 2- 4 shows the smoke released by the “Tire Inferno”.
8 Figure 2- 4 TIRE INFERNO; A towering cloud of smoke rises from the Rhinehart tire fire in rural Virginia on
Oct. 31, 1983 [12]
Day et al. [32] stated that; eco-toxicity is likewise affected in consequence of discarded tires release of metals and additives such as stabilizers, flame retardants, colourants and plasticizers. Leaching of these materials into the soil and the water is definitely not eco-friendly as it could possibly kill the bio-organic colonies [33].
2.3. Waste Tire Reuse
As cited by Ramarad et al. [34], recovered waste tires are considered to be rich materials because of their compositions and properties, hence waste tire is a valuable source of raw materials as can be seen on Table 2- 1.
9 Table 2- 1 Typical materials used in tyre manufacturing (in Europe and USA) according to the percentage of the
total weight of the finished tyre that each material class represents [14]
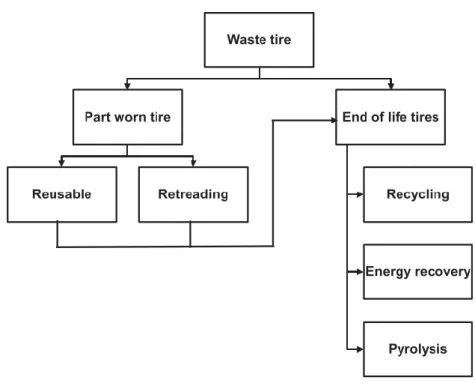
Figure 2- 5 illustrates the flow of waste tire utilisation.
Figure 2- 5 Flow of waste tire utilisation [13]
These waste tires can be separated into part worn tires and end of life tires (ELTs). Part worn tires are still suitable for road use, while end-of-life-tires are not anymore. Numerous attempts have been made to utilize ELTs by reclamation, devulcanization, energy recovery, pyrolysis and others [19], [25], [35]–[38].
As suggested by Ramarad et al. [39], the ideal waste tire utilisation hierarchy is as depicted in Figure 2- 6;
10 Figure 2- 6 Hierarchy of waste tire utilization [13]
First and foremost, waste tire generation should be prevented. In an article, van Beukering et al. [40] cited that correctly inflated, rotated and cared tires would last 50 to 90% longer on the road.
Then is retreading, which is kind of re-manufacturing method by replacing the tread on worn tires [41]. When a retreaded tire enters the market, it reduces the manufacturing of the new one. Ferrer in his article “The economics of tire remanufacturing” [42], declared that retreading is the most economically worthwhile method of waste tire utilization as it requires only 30% of energy and 25% of raw materials used in the manufacturing of a new tire.
In third position comes recycling, followed by recovery. Currently, recycling and recovery are the most used methods [34]. Recycling should be chosen over recovery, as recovery method is only capable of recovering 30 to 38% of energy embedded in new tires [26], [43].
At last, which is the most undesired method (with all the issues associated and described in previous sections), is landfill [34].
2.3.1.
Management of Used Tires in Europe
As a result of European Directive 1999/31/EC dated 26 April 1999, it is forbidden by the law to dispose used tires in landfills. The directive instructs state members to focus on responsible and environment-friendly recovery methods [44].
11 There are no explicit European regulations for recovering used tires. Each state member is free to choose its own management system from the three available types of management systems which are illustrated in Figure 2- 7 [44] :
Figure 2- 7 ELT management schemes in Europe [44]
a) The producer responsibility system: used particularly in Portugal, under that system, the law defines the legal framework and assigns the duty of ELTs management to the tire producer (manufacturer or importer). This makes the producer responsible for the waste that the consumer generates. [2]. In Portugal, this contribution can be found in the invoice of a new tire [44].
b) The tax system: Under this system, each country is responsible for the management of ELTs. The process is financed by a tax collected from tire producers and subsequently from the consumer [2].
12 c) The free market system: under this system, also referred as liberal system, the legislation defines the objectives to be met but at the same time does not designate the responsible. In this way, all the operators are implicated in the recovery chain and act in obedience with the legislation [2].
2.3.2.
Recycling Waste Tires
For this work, the chosen waste tire utilisation method would be recycling as it is a valuable source of raw material.
Products that are usually manufactured with a “conventional” materials as wood and metal, are nowadays being produced with polymeric. Waste tire, containing almost 50% rubber is considered a polymeric material commonly called waste tire rubber (WTR) [34]. Blending WTR with other polymers also backs the 3R notion (reduce, reuse and recycle). Using WTR, it would result on reducing the amount of virgin polymer used and recycling the waste tires already exist. These factors have motivated many scientists and researchers around the world to create and evaluate this wasted material [45].
Downsizing waste tires: Downsizing waste tires is done by chopping the tire into smaller sized particles [46], this process is mandatory for blending waste tire rubber with polymers [19]. Sunthonpagasit and Duffey [47] considered that downsizing waste tires requires special machinery and equipment capable of grinding waste tires with complex structure and high mechanical properties (which reported in the previous sections).
Table 2- 2 illustrates the main methods of waste tire downsizing with their advantages and disadvantages. With the granulation process, the textiles and steels from the tires will be removed by pneumatic separators and electromagnets respectively [47]. This process, downsizing waste tires, will result on ground tire rubber (GTR).
13 Table 2- 2 General methods of waste tire downsizing [3]
2.4. Waste Tire Applications
The waste tire can be used for environmentally safe application in terms of material and energy recovery instead of being disposed in the environment.
Figure 2- 8 Boat bumper and sound absorbing wall [17]
According to Tasawan [17] and Northeast Recycling Council [48], the most important use of recycled tire material can be summarized into the following applications;
- Whole tire: Tires are excellent materials for the original shape because of their resilience to impact and longevity. The whole tire can be used for civil engineering projects such as highway crash barriers, sound absorbing walls, boat bumper, dyke protections, insulation in building foundations and road base material [49]. Two examples of whole tire applications are shown in Figure 2- 8.
- Gravel Substitute: wherever gravel is used, chances are that tire chips can be used instead. Applications include: sub-layers for roadways, aggregate for drainage
14 ditches, and highway embankment backfill and are being used under light rail tracks in a urban area, to reduce vibration and noise from passing trains [50]. - Crumb Rubber: Crumb rubber is finely ground rubber produced from waste
tires. Down-cycling of tire occurs as discussed in previous section. Some applications for crumb rubber include: rubberized asphalt, playground flooring, welcome mats, anti-fatigue mats and vehicle mud guards [20], [51].
- Landfill Medium: Shredded or chipped tires can be used as both a liner or cover for landfills. Tire chips can be used as a thermal insulation between primary and secondary landfill liners to reduce temperatures [52].
- Wastewater Treatment Filters: Another use is filters in wastewater treatment and constructed wetlands. Because tires can be chipped to be more porous than organic compounds, rocks and other material, they often serve as a much better filter media [53], [54].
- Garden Mulch: Yet another innovative use for recycled tires is rubber mulch. Not only does it hold its appearance over its life cycle, it doesn’t float away during rainstorms, nor will it rot the way wood mulch will. Unlike wood mulch, tire chips don’t breed termites and other wood-boring pests [55].
Other applications are being studied and developed as; reprocessing the tire rubber by injection or compression moulding, with or without the addition of virgin rubber. Guglielmotti et al [56] proposed producing rubber parts by tire recycling without using virgin materials. Lima et al [57]–[59] studied different properties of GTR in TPE blends for injection moulding purposes and concluded that; this process is a proven practical method to recycle waste tires or what they called “a potentially wasted material”.
Modification of GTR: Incorporation of GTR into fresh/virgin polymer can be considered as a tempting-feasible process. GTR contains high quality natural and synthetic rubber which could be used in other polymers such as rubbers, thermoplastic and thermosets. Nonetheless, the compatibility of GTR and polymeric matrix is a weighty matter [34], [45]. Because lack of bonding between GTR and the virgin matrix, those blends usually have lower mechanical properties [46].
On this matter, to improve those properties, the surface of GTR can be modified. Many processes have been developed to address this issue namely;
15 - Physical and chemical methods: there are many methods such as; graft modification, radiation induced modification, gas modification among others [60], [61].
- Reclaiming or devulcanization: even if they are different processes the aim is shared, which is obtaining a rubber compound similar to a virgin/fresh one which will be called in this case reclaimed tire rubber (RTR) [25], [43].
16
3. GTR and RTR in Polymer Blends
The rubber (GTR-Ground Tire Rubber or RTR-Retreated Tire Rubber) extracted from tires, can be incorporated into the three groups of polymers; thermoset, thermoplastic and rubber [62], [63].
Since the polymers market is immensely big and continuously growing, incorporating as little as can be of GTR in polymers, particularly in thermoplastic, would result a big consumption of waste tires [64], [65]. The use of GTR in each polymer category has targeted a precise goal, for example; thermosets industry is interested in improving toughness, thermoplastic industry wants to attain thermoplastic elastomers while rubber sees for cheap filler [66].
3.1. GTR in Thermoplastics
Synthesizing cheap thermoplastic elastomers (TPE) is the powering reason behind the use of GTR in TPEs [66]. The use of GTR in thermoplastics was the often preferred way of recycling besides rubbers [64]. This was supported by the following patterns [58], [64], [65]: - As reported by Karger-Kocsis et al. [64] and Marvin et al [65]; a small percentage of GTR in thermoplastics (less than 10% in weight) can cause a large consumption of GTR owning to the market share of thermoplastics,
- Recycled thermoplastics can be found in the market hence when GTR is added, the final cost is reduced even further,
- The toughness of the corresponding blend may be enhanced as GTR is incorporated. This expectation is since the majority of toughened thermoplastics are rubber modified.
However, the low elongation at break came as a limiting factor [66]. To overcome this issue some recent investigations merged on composites of polymer / GTR or RTR [67], [68]. Reinforcing fillers such as short fibres and nanoparticles are known to increase polymer system’s strength. According to Martins et al. [68] in their work on sisal fibres and tire rubber composites, the results of the study are encouraging and indicating that this composite offers a promising potential for non-structural applications.
17
3.2. GTR in thermosets
It is known that rubber particles when disperd in micron-scale may improve the fracture toughness of the respective matrix, and the incorporation of GTR particles in thermoset resins often targeted their toughness improvement [64]. In a study performed by Aoudia et al. [69], incorporating GTR and DGTR (micro wave Devulcanized GTR) into an epoxy matrix as reinforcement particles and the obtained composites were characterized by three-point flexural tests. As a result of microwave devulcanization, epoxy composites filled with DGTR had better mechanical properties than those filled with GTR, at the same loading.
According to Karger-Koscis et al. in their review [64], the modification of thermosets with GTR is less promising because the desired toughening cannot be achieved. This statement may change when ultrafine GTR particles (≤ 10 µm) are being used. It is worthy to state that the studies conducted on incorporation of GTR in thermosets did not gave a big importance to other properties which may be of interest, such as shrinkage and change in the residual stress state.
3.3. GTR in rubbers
The incorporation of GTR in rubber mixes in appreciable quantities changes the processability and it is associated with some decrease in the mechanical properties, such as tensile and shear strength [70]. Nonetheless, there are has been always considerable interest to recycle GTR in rubber stocks [71], [72].
A recent work investigated by Guglimotti et al. [56], on what they call “Direct Powder
Moulding”, it consists on producing large rubber parts from spent tyres without any addition
of virgin materials or linking agents. The rubber pads were produced by compression moulding of rubber powder mixtures which were obtained by mechanical grinding of ground tyre rubbers. In this study, the effect of different powder mixtures on the final performances of the moulded parts was evaluated, and it was found that the rubber powder distribution strongly affects the mechanical performances of the recycled rubber moulded products [73].
3.4. Plastic and rubber compatibility
As referred previously, compounding GTR with thermoplastic polymers is a cost-efficient way to prepare TPEs. The principal issue is on improving the compatibility between
18 the vulcanized rubber particles and plastic matrix to obtain type of isotropic morphology that would result on enhancement of mechanical properties [74].
According to D. Mangaraj [75], the role of the compatibilization is:
1) Reducing the interfacial energy to improve adhesion between phases; 2) Obtaining better dispersion during mixing;
3) Stabilizing dispersion against agglomeration during processing;
4) For GTR-thermoplastic polymer, smaller particle size of GTR and de-agglomeration are the most important factors in manufacturing ideal materials.
According to Liu [74], since GTR particles are crosslinked structures and they cannot be reprocessed unless through devulcanization [75], and adding compatibilizers would not achieve the desired enhancement of properties. Thus compatibilization of GTR-TPE blends can be accomplished by using a reduced size of GTR particles to increase specific surface [74].
The annual consumption of TPEs is growing. So, the development of GTR-containing TPEs with useful characteristics would contribute to the recycling of a large amount of waste tire rubber. Karger-Kocsis et al [64] concluded that GTR recycling should target the production of TPEs and its usage in the rubber industry.
19
4. Test Samples’ Preparation
4.1. Materials Preparation
The polymer matrix used in the mixtures was a polypropylene supplied by REPSOL, PP 070 G2M. Initially it was used three different types of particle sizes GTR;
- a powder-like referred at first as DUST,
- a mixed-sizes that seemed to have different particles with different sizes referred at first as MIXED
- and the third is 2.4mm particles size.
The GTR were supplied by different partners of CDRSP-IPLeiria, it was needed to measure the particle size of two samples; DUST and MIXED.
The particle size measuring test, also called Sieve analysis or Gradation test [76], was done in the laboratory of Geotecnia e Vias de Comunicação from civil engineering department of ESTG. The test involves a nested column of Sieves with wire mesh cloth (screen) [77].
A previously weighed sample is poured into the top sieve which has the largest screen
openings. Each lower sieve in the column has smaller openings than the one above. At the base is a round pan called the receiver, to collect the rest if there was any [77], as can be
seen on Figure 4- 1.
20 The column is placed on a mechanical shaker. The shaker vibrates the column for 2 minutes period. After the shaking is complete the material on each sieve is weighed. The weight of the sample of each sieve is then divided by the total weight to give the respective percentage retained. The size of the average particle on each sieve is then analysed to get a cut-off point or specific size range. The results are plotted and displayed on Figure 4- 3 and Figure 4- 4. For GTR-DUST, the most dominant particle size is 0.250mm (250 µm) with 62.21% and there is the presence of 0.125mm and 0.063mm particle with 24.92% and 8.32% respectively.
For GTR-MIXED, the most dominant particle size is 1.000mm with 65.25%, and as well the presence of, beside to smaller size <0.250 which can be considered insignificant, of 2.000mm particle with 14.30% and of 0.5mm (500µm) with 16.25% were observed. Hence from now on, the DUST will be represented as GTR(0.25mm), and the GTR-MIXED as GTR (1mm).
21 Figure 4- 3 GTR(DUST) sieving analysis test
Figure 4- 4 GTR(MIXED) sieving analysis test
4.2. Materials processing
4.2.1.
Mixtures preparation
First the mixtures were prepared with three different GTR percentage content (30%, 50% and 70%) for each particle size. It was prepared 1 kg of each PP/GTR mixtures shown in Table 4- 1. 0,00% 10,00% 20,00% 30,00% 40,00% 50,00% 60,00% 70,00% <0,063 0,063 0,125 0,250 0,500 1,000 2,000 Perc en ta ge (% ) size (mm)
Particle size % for Dust
0,00% 10,00% 20,00% 30,00% 40,00% 50,00% 60,00% 70,00% 0,063 0,125 0,250 0,500 1,000 2,000 Perc en ta ge (% ) size (mm)
22 Table 4- 1 Mixtures prepared for processing
MIXTURES DESIGNATION PP wt% content GTR wt% content
1 PP100 100wt% 0wt% 2 PP70 GTR(0.25mm) 30 70wt% 30wt% 3 PP50 GTR(0.25mm) 50 50wt% 50wt% 4 PP30 GTR(0.25mm) 70 30wt% 70wt% 5 PP70 GTR(1mm) 30 70wt% 30wt% 6 PP50 GTR(1mm) 50 50wt% 50wt% 7 PP30 GTR(1mm) 70 30wt% 70wt% 8 PP70 GTR(2.4mm)30 70wt% 30wt% 9 PP50 GTR(2.4mm) 50 50wt% 50wt% 10 PP30 GTR(2.4mm)70 30wt% 70wt%
4.2.2.
Extrusion process
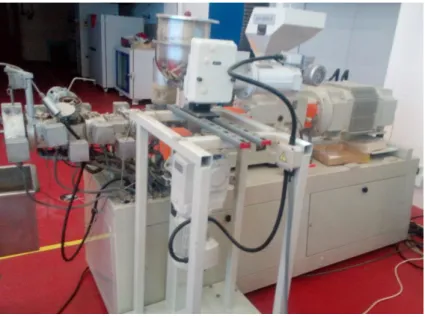
The extrusion was done using a Werner & Pfleiderer ZSK25x38D extruder available in laboratory of mechanical technologies of CDRSP-IPL depicted in Figure 4- 5. The extruder is constituted of extruding diameter of 3mm, a motor with a power of 10 kw and a maximum rotation of 300 rpm. The equipment is also equipped of a water tank with rollers to cool down the extruded filament and a granulator (Figure 4- 6) [79], [80].
23 The mixtures were extruded under a specified temperature on each zone as depicted on Table 4- 2. The velocity of the first screw was 40 rpm and for the second screw was 30rpm. On second plan the extruded filament was granulated and packed in labelled-sealed bags.
Table 4- 2 Extrusion temperatures in each zone
Zone 1 Zone 2 Zone 3 Zone 4 Zone 5 Zone 6 Zone 7 Zone 8 Zone 9
140 140 170 170 180 180 180 180 180
Figure 4- 6Granulator and Werner & Pfleiderer ZSK25x38D extruder
At this stage, it was noticed that some mixtures namely; PP30 GTR(1mm) 70, and all the three with 2.4 mm particle size were not processable (the extruded filament keep breaking up to small portions even when changing extrusion parameters, which makes them harder to granulate). Probably, this was due to the 3 mm diameter of the fuse; having particles with 2.4mm leaves small spaces for the PP and this way it is impossible to promote the adhesion in-between materials causing the mixture to be constantly breaking during the extrusion process. By the other hand, with 70wt% of 1mm (which has 14.3% with 2mm) could not be extruded using a 3mm diameter fuse under the conditions used during the process due to the high viscosity of the mixture.
24
4.2.3. Injection moulding
a) Injection machine: To produce the tensile samples, a micro-injection machine was used in Figure 4- 7, Boy 22A, available in the same laboratory as the extruder. The machine is designed for the automatic injection of thermoplastics, elastomers, silicones as well as other polymers with a closing force of 1000 kN [79], [81].
Figure 4- 7 Boy 22A injection machine
The Boy-22A injection machine has the following characteristics; Table 4- 3 Injection machine parameters [79]
Injection Side Ejection Side
Sprue brushing diameter [mm] 18 Closing Force [kN] 220
Ratio-lenght/Diam screw 20 Distance between columns [mm] 254
Maximum injection volume [cm3] 20.4 Maximum mold thickness [mm] 400
Maximum weight / injection [g] 18.6 Maximum openning [mm] 200
Injection force [kN] 65.8 Minimum mold thickness [mm] 200
Injection rate [g/s] 38.4 Maximum mold weight [kg] 150
Maximum injection pressure [bar] 2587 Openning force [kN] 40
Maximum screw stroke[mm] 80 Closing force [kN] 17.6
Nozzle contact force [kN] 48 Ejection course [mm] 80
Back pressure stroke [mm] 180 Ejection force; forward/backward [kN] 18.1-12
Screw torque[Nm] 1802 Hydraulic force [bar] 160
Screw Velocity [U/min]
500-4002
Oil tank capacity [litrers] 115
Back pressure force [kN] 45.7 Work power [kW] 5,5
Heating capacity [W] 3250
Hopper size [litre] 13
The injection parameters used in the injection process are reported in Table 4- 4, as C1 and C7 are used as references for comparison;
25 Table 4- 4 Injection parameters used for each mixture
Composition Designation IP (bar) IV (mm/s) 2IP (bar) HT (s) IT (oC) 1 2 3 4 5 C1 PP100 115 120 90 4 150 170 176 180 180 C2 PP70GTR(0.25mm)30 90 120 35 3 150 170 170 180 180 C3 PP50GTR(0.25mm)50 110 120 35 3 150 170 170 180 180 C4 PP30GTR(0.25mm)70 120 140 45 3 150 170 170 180 180 C5 PP70GTR(1mm)30 110 120 45 3 150 170 170 180 180 C6 PP50GTR(1mm)50 110 120 45 3 150 170 170 180 180 C7 TPE (IRHD 15:43) 70 120 35 3 150 170 170 180 180
Where: IP is the Injection Pressure, IV is the Injection Velocity, 2IP is the second Injection Pressure, HT is the Holding Time, IT is the Injection temperature.
As can be seen from Table 4- 4, some parameters differ from a mixture to another, this is due to a troubleshooting that was done after bad results as; not filling the full cavities and sinking in some regions of the parts. This can be explained as for high content of rubber the viscosity of the blend increases considerably hence there is a need for more injection pressure and/or velocity.
b) Mould: The mould used was machined from a standard structure 196x156, supplied by BruYRubio. The two cavities mould (Figure 4- 8), designed in accordance with standards of EN ISO 527-4 [79], has a cold runner with side gate injection composed of two cavities with a standard cylindric ejection.
26
5. Characterization Techniques and Tests
5.1. Hardness Test
5.1.1. Shore (Durometer) Hardness
A durometer is a device that is built to determine the hardness of a material, whether the material is polymeric or elastomeric. The hardness of the material measured using this instrument is defined by a force that is applied by a typically designed pressure foot; the force applied on the material measures the depth of indentation on the material. In general, the hardness of the material will be calculated by the depth of indentation. In shore hardness test or durometer hardness test different materials are measured using different hardness scales [82]. According to American Society for Testing and Materials (ASTM D2240-00) uses twelve scales depending upon the type of usage. The twelve types of scales are denoted with letters A, B, C, D, DO, E, M, O, OO, OOO, OOO-S and R. Each of these scales range from values 0 to 100 as the hardness of the material increases [83]. The most used scales in in polymers are type A and type D. Type “A” scale is used to test soft plastic materials while type “D” is used for harder ones and as the hardness increase or decrease different levels of scales are used [84], [85]. Figure 5- 1 shows the existing difference between the shore A and D are on the indenter tip.
Figure 5- 1 Diagram of a durometer indenter or presser foot used for Shores A and D [82]
Figure 5- 2 exemplifies three types of hardness scale; Shore A, Shore D and Rockwell and shows the usual use of each one depending on the material family.
27 Figure 5- 2 Thermoplastic hardness range[65]
5.1.2. Test Procedure (ISO 868)
Since Shore A is usual scale for measuring the hardness of TPEs, so as a first test the samples were subjected to a durometer of Shore A. The results obtained were more than 80 and close to 90 for some. Another test with Shore D scale was performed by taking into consideration ISO 868 clause 8.2; that specifies whenever readings on shore A exceeds 90 shore D should be used instead, and whenever readings on shore D are less than 20 shore A should be used.
On this experiment, the shore A test was performed in quality control laboratory of
PLIMAT - Plastics Industrial Matos, SA, and the shore D test was done in mechanical
laboratory of ESTG. Figure 5- 3 shows the equipment used for the shore D test with the following conditions:
- The standard followed for was ISO 868 for Shore A and D,
- The reading time starts when the point of the rod enters in contact with the sample’s surface for this a digital chronometer with a sound alarm was used to indicate the end of the interval,
28 - Reading/sample: number readings in different location (spaced at least with 6) for the same sample, the results was averaged and displayed as a single value for each sample,
- Samples/mixture: number of samples for each different material mixture.
The results are displayed according to ISO 868; it can be found D/15:45 means that the results is 45 on shore D obtained after 15 seconds following the first contact of the durometer rod and the sample surface.
Table 5- 1 Shore Test conditions
Standard Ref. ISO 868
Sample Ref. same in
ISO 527-2 Storage Environement Temp °C 25 Humdity % 75 Time h >16 Testing Environement Temp °C 25 Humdity % 75 Reading Time s 15 Readings/Sample 6 Samples/mixture 3 .
29
5.2. Contact Angle (wettability) Test
Contact angle test is basically used to determine the wettability of a material. The wettability of a material is determined by measuring the contact angle; the contact angle is formed when the liquid comes in contact with the interface of solid or liquid. If the contact angle is smaller, the wetting property is larger (i.e. the material is said to have a wettability property if the contact angle between the liquid and solid interface is smaller than 90o and the material is said to have a non-wettability property if the contact angle between the liquid and solid is between 90o and 180o [84].
The contact angle is geometrically calculated by applying a tangent line from the contact point along the liquid-vapour interface in the droplet profile as shown in Figure 5- 4.
Figure 5- 4 Illustration of contact angles formed by sessile liquid drops on a smooth homogeneous [36] As Thomas Young [15] in 1805 reported, the contact angle of a liquid drop on an ideal solid surface is defined by the mechanical equilibrium of the drop under the action of three interfacial tensions. It is represented by, what usually referred to, Young’s equation [84];
γlv cos θY =γsv −γsl
where γlv, γsv, and γsl represent the liquid-vapour, solid-vapour, and solid-liquid interfacial
tensions, respectively, and θY is the contact angle, or Young’s contact angle [84].
Figure 5- 4 shows that the value of reference is 90° for contact which would be interpreted as incomplete wetting of the material and would be called in this case as a hydrophilic material, and much less than 90° would be correct to say that the surface of the material is favourable for wetting, while the contact angle is more than 90° generally means that the wetting of the surface is unfavourable which in this case would be called as a hydrophobic material. When the contact angle is greater than 150°, the surface is considered as a super-hydrophobic [84].
30 Lately, the wetting property has gained tremendous, as it is an important feature in many industrial processes, such as oil recovery, lubrication, liquid coating, printing, and spray quenching [53],[84].
The contact angle test was performed in CDRSP-IPLeiria using an ATTENSION THETA equipment (Figure 5- 5).
Figure 5- 5 ATTENSION THETA used for contact angle test
5.3. Tensile test (ISO 527)
ISO 527 is a standard that is framed to determine the tensile properties of composites and plastics under specified conditions. This standard explains various types of test specimens and methods to investigate the tensile behaviour of different materials. This standard explains that the tensile behaviour is determined by extending the specimen along the major longitudinal axis by applying constant load on the specimen until the fracture limit or until the stress or strain reaches the nominal value. The result is calculated on the basis of load sustained by the specimen and the amount of elongation [86].
Why it is necessary to perform a tensile test? In fact, it is very interesting to know how much load a material can bare. Usually tensile strength is performed in a universal testing machine and a graph is plotted as the specimen is stretched. The graph contains a curve that clearly explains the behaviour of the specimen under different load conditions. As the material is subjected to elongation at one point of load the material reaches the plastic deformation state and this point is termed as yield point. The last point where the specimen
31 loses its strength and breaks is the ultimate strength of the specimen and this is the point where the specimen sustains the maximum load [87].
- Stress-Strain Curves: From the machine test, the tensile force is recorded as a function of the increase in gage length. Figure 5- 6a shows a typical force-elongation curve for a ductile material. While Figure 5- 6b shows a typical engineering stress-strain curve which is identical in shape to the first one. The engineering stress, or nominal stress, s, is defined as [87];
𝑠 = 𝐹 𝐴0
where F is the tensile force and A0 is the initial cross-sectional area of the gage section. And The engineering strain, or nominal strain, e, is given as [87];
𝑒 = Δ𝐿 𝐿0
where L0 is the initial gage length and ΔL is the change in gage length (L - L0). Stress strain curve is used to test the loading capacity of materials. The behaviour of the material as it is pulled apart until the specimen loses its strength is recorded in stress strain curve. Stress strain curve gives a clear visibility about the ranges of yield point, limit of plastic deformation, maximum tensile strength and the fracture limit. The values shown in the stress strain curves are very important for engineers to know the maximum limit of force that a material can withstand with respect to the cross section [86].
Figure 5- 6 (a) Load-elongation curve from a tensile test and (b) corresponding engineering stress-strain curve. Specimen diameter, 12.5 [68]
32 - Elastic versus Plastic Deformation: When the material is subjected to elongation, the first phase of damage to the specimen starts in the phase of elastic deformation. But in this stage, as the stress is removed the material goes back to its original shape. This is known as complete recovery or resilience [87]. When more stress is induced on the specimen after elastic phase, the material does not go back to its original shape this means the specimen has reached the plastic limit. This is the stage where the material has reached its yield value and the originality of the material cannot be retained further [87]. Those stages are depicted in Figure 5- 7, where A is the yield point, D is the ultimate tensile strength and F is the fracture point.
Figure 5- 7 Engineering stress-strain curve showing elastic and plastic deformation [88]
For most materials, the initial portion of the curve is linear. The slope of this linear region is called the elastic modulus or Young’s modulus, E:
𝐸 = s 𝑒
- True Stress and Strain: are used for accurate definition of plastic behaviour of ductile materials by considering the actual (instantaneous) dimensions [89].
True stress, s’, is the force (F) divided by the actual area (A) [89]: s′ = F
𝐴 by simplifying the above equation;
𝑠′= 𝑠 ∗ (𝑒 + 1)
True strain, e’, is change in length with respect to the instant length [89]: 𝑒′= ∫ 𝑑𝐿
𝐿
𝐿
33 by simplifying the above equation;
𝑒′ = ln (𝑒 + 1)
- Modulus of Toughness: is the work done on a unit volume of material as a simple tensile force is gradually increased from zero to the value causing rupture is defined as the Modulus of Toughness. This may be calculated as the entire area under the true stress-strain curve from the origin to rupture [90]. Toughness of a material is its ability to absorb energy in the plastic range of the material [91]. The function is given by [92]:
𝑈𝑡 = ∫ 𝑒𝑑𝑠
𝑠𝑡
0
To calculate the Ut, a numerical integration is done. Using the trapezoidal rule which is given by:
Area0= (Y1+Y0)*( X1+X0)/2
Where in this case; Y is the stress “e” and X is the strain “s” and Area0 is the partial
area between the pair (X0, Y0) and (X1, Y1).
Performing this formula in a recurring way for each successive values of stress and strain then summing all the results will generate the total area beneath the stress-strain curve(this was done using MS Excel), which is corresponding to the modulus of toughness. The unit is given by MJ/m3.
5.3.1. Tensile specimens
Wherever possible, the test specimens shall be dumb-bell-shaped types 1A and 1B (ISO 527) , as shown in Figure 5- 8.
34 Figure 5- 8 Test specimen types 1A and 1B [72]
The tensile test specimens should follow the standards of EN ISO 527-1. This standard explains that the test specimen should be free of twists; the edges must be free scratches, pits, and marks etc. Before the specimens are tested it should be checked for conformities by visual observation for straight edges, flat plates etc. The specimens should have enough space for gripping and testing. Minimum and maximum values are to be recorded for each specimen as specified in the standard EN ISO 527-1 and also should make sure that the specimens are within the tolerance values [87].
5.3.2. Tensile machine
Universal testing machine is the most commonly used for testing tensile, compression and bending. Universal testing provides results in a graph with stress on the Y- axis and strain on the X axis and hence, it is called stress-strain curve. These machines are either electromechanical or hydraulic. The main difference is the way the load is applied. Electromechanical machines are based on a variable-speed electric motor. It consists of a gear system that helps the cross head move up and down, by this the load can be applied on the specimen either in tension or in compression. The speed of the cross head can be changed by controlling the speed of the motor. Hydraulic universal testing machines consist of a
35 hydraulic ram that moves the cross head up and down. The load is applied by adjusting the pressure of the orifice [87].
In this project, the samples were tested in electromechanical machine from Universal Instron model 4505 located in the research centre CDRSP, illustrated in Figure 5- 9.
Figure 5- 9 Universal Instron model 4505 used for tensile test
5.4. Morphology Test
Micro-CT (micro–computed tomography) is x-ray imaging in 3D, by the same method used in hospital CT (or "CAT") scans, but on a small scale with massively increased resolution [93].
X-ray microtomography, like tomography and x-ray computed tomography, uses x-rays to create cross-sections of a physical object that can be used to recreate a virtual model (3D model) without destroying the original object [94], [95].
The applications of micro-CT exceed medical imaging as it has reached industry. Generally, there are two types of scanner arrangements. The first is, the X-ray source and detector are stationary during the scan while the sample rotates. While the second is, while the specimen is stationary in space, the X-ray tube and detector rotate around. These scanners are typically used for small specimens (in some cases animals), biomedical samples, foods, microfossils, and other studies for which minute detail is desired [96].
The X-ray microtomography system was first developed and built by Jim Elliott in the early 1980s [97].
36 Material used: For this test, as the aim was to check the internal structure of samples, a SkyScan (1174v2) from Bruker, Figure 5- 10, was used with the following parameters;
- Voltage: 50 kV, - Current: 800 µA, - Pixel size: 11.23 µm, - Execution time: 3500 ms, - Rotation: 0.700°,
- Without any filter
37
6. Results and Discussion
6.1. Shore Hardness Test
The tests were performed under the conditions specified previously, the results were entered in an excel spreadsheet to calculate the average for each readings/sample (C1, C2, and so on...), the average and the standard deviation (Std) for the three samples.
Table 5- 2 Shore D hardness values of different mixtures
Composition Mixture SP1 SP2 SP3 Average Std
C1 PP 100 D/15:54 D/15:53 D/15:52 D/15:53 0,92 C2 PP70/GTR(0.25mm) 30 D/15:53 D/15:54 D/15:53 D/15:53 0,38 C3 PP50/GTR(0.25mm) 50 D/15:47 D/15:47 D/15:48 D/15:47 0,38 C4 PP30/GTR(0.25mm) 70 D/15:36 D/15:37 D/15:37 D/15:37 0,72 C5 PP70/GTR(1mm) 30 D/15:53 D/15:50 D/15:53 D/15:53 1,69 C6 PP50/GTR(1mm) 50 D/15:49 D/15:50 D/15:50 D/15:50 0,58 C7 TPE (measured on IRHD
scale) IRHD 15:44 IRHD 15:43 IRHD 15:43 IRHD 15:43 0,64
Figure 5- 11 Mean of hardness values from different mixtures
From the data reported in Table 5- 1 and Figure 5- 11, it can be seen that adding 30wt% of GTR, regardless to particle size, does not affect the hardness of the mixtures as the values stayed the same of pure PP, D/15:53. In fact, the results have shown that adding
0 10 20 30 40 50 60 C1 C2 C3 C4 C5 C6
38 smaller amounts of GTR to PP (30wt%) does not have an influence in the hardness obtained (Samples C1, C2 and C3). Moreover, when comparing samples C2 and C5 with different GTR particle sizes, the results continue to be equal. Probably, owing to the good dispersion of the particles of GTR in the PP matrix making possible to the durometer’s tip to hit mainly the PP matrix due to geometric conditions.
For 50wt% of GTR, a drop of 5.7% for 1mm particle size and of 11.3% for the 0.25mm particles were registered during the test. This also can be assigned to the influence of GTR particles size and distribution due to the presence of higher percentage of GTR in the mixture.
The hardness value decreases even further with increase in the 0.25mm particles content for 70wt% to a value of 37 on shore D, which represent 32.3% less than the pure PP. Because of big percentages of GTR, now the hardness is mainly influenced by GTR and not PP as seen earlier.
Figure 5- 12 Shore A-D hardness scale cross references [35]
Sukanya et al. [98], studied the properties of thermoplastic elastomers from waste polyethylene (WPE) and reclaim rubber (RR). The study covered different percentages on the mixtures (0,5,10,15,20,30…,70wt% of RR), they observed that the shore D hardness increase as the content increase up until 15wt% then it was a dead band until they pass the 30wt%.
In the present case, the dead band was observed until 50wt% of GTR content were added, which can be interpreted as; absence of agglomerated GTR particles in the mixture and the lack of interaction with the PP particles. More experiments with different content percentages should be performed to evaluate the precise interval of the dead band for each
39 particle size. Beside that it can be concluded that, finer particles have a better interaction with the PP matrix which make the resultant blend softer.
6.2. Contact Angle Test
The experiment was developed according to the method previously described, giving the results for the different specimens, which are displayed on Table 5- 3. The mean calculated from the experimental results is shown in Figure 5- 13.
Table 5- 3 Contact angles values for different mixtures
Compositions Mixture SP1 SP2 SP3 MEAN STD
C1 PP 100 77,21 80,86 80,18 79,4 1,9 C2 PP70/GTR(0.25mm) 30 88,47 86,43 88,35 87,8 1,1 C3 PP50/GTR(0.25mm) 50 89,67 89,04 92,31 90,3 1,7 C4 PP30/GTR(0.25mm) 70 88,63 87,70 89,71 88,7 1,0 C5 PP70/GTR(1mm) 30 83,59 83,89 80,98 82,8 1,6 C6 PP50/GTR(1mm) 50 90,03 88,20 89,55 89,3 0,9 C7 TPE (IRHD 42) 98,06 102,34 102,87 101,1 2,6
Figure 5- 13 Contact angle mean for different mixtures 72,00 74,00 76,00 78,00 80,00 82,00 84,00 86,00 88,00 90,00 92,00 C1 C2 C3 C4 C5 C6
Mean contact angle values for different mixtures
40 The results shown in Table 5- 3 and Figure 5- 13, indicates that incorporating GTR particles with PP improves the wettability property as it increases for different percentages of GTR and as well for different particle sizes.
The contact angle increases 10.6% when adding 30wt% of 0.25mm particles and 4.3% when adding 30wt% of 1mm particles.
The maximum contact angle recorded for the blend PP/GTR is 90,3° for PP50GTR(0.25mm)50 which represents an increase of 13.7% when compared to pure PP. Thus, it was observed a slight decrease when adding 70wt% of GTR content compared to the 50wt%.
Hossain et al [99] investigated moisture damage resistance of GTR-modified asphalt binder by static contact angle measurements, and observed a continuous-decline trend of contact angle with an increase of GTR content.
In the present case; the results reported show the particle size have more influence on the wettability performance of the mixture than the particle content. This can be assigned to a better GTR/PP interaction.
This can be of great use when the wettability property is considered as an important feature on the material. Independently from the other properties and just taking into consideration the hydrophobicity, this mixture can be used for coating, outdoor use and electrical insulation.
6.3. Tensile Test
The prepared specimens were tested with the speed of 1mm/min as specified in ISO 527-2, clause 9. The mean of the results and their respective deviations, were calculated at least with 4 samples for each mixture, are depicted in Table 5- 4.
![Figure 2- 2 Breakdown of tire ingredients [21]](https://thumb-eu.123doks.com/thumbv2/123dok_br/18606774.909668/26.892.174.674.107.383/figure-breakdown-tire-ingredients.webp)
![Figure 2- 3 World’s biggest tyre graveyard localised in Kuwait with over 7 million tires [9]](https://thumb-eu.123doks.com/thumbv2/123dok_br/18606774.909668/27.892.169.828.106.597/figure-world-biggest-graveyard-localised-kuwait-million-tires.webp)

![Figure 2- 6 Hierarchy of waste tire utilization [13]](https://thumb-eu.123doks.com/thumbv2/123dok_br/18606774.909668/30.892.154.723.112.454/figure-hierarchy-waste-tire-utilization.webp)
![Figure 2- 7 ELT management schemes in Europe [44]](https://thumb-eu.123doks.com/thumbv2/123dok_br/18606774.909668/31.892.174.833.207.849/figure-elt-management-schemes-europe.webp)
![Figure 2- 8 Boat bumper and sound absorbing wall [17]](https://thumb-eu.123doks.com/thumbv2/123dok_br/18606774.909668/33.892.200.762.651.814/figure-boat-bumper-sound-absorbing-wall.webp)
![Figure 5- 1 Diagram of a durometer indenter or presser foot used for Shores A and D [82]](https://thumb-eu.123doks.com/thumbv2/123dok_br/18606774.909668/46.892.155.757.746.1038/figure-diagram-durometer-indenter-presser-foot-used-shores.webp)
![Figure 5- 2 Thermoplastic hardness range[65]](https://thumb-eu.123doks.com/thumbv2/123dok_br/18606774.909668/47.892.212.705.104.595/figure-thermoplastic-hardness-range.webp)
