Printed version ISSN 0001-3765 / Online version ISSN 1678-2690 http://dx.doi.org/10.1590/0001-3765201820140465
www.scielo.br/aabc | www.fb.com/aabcjournal
Quantification of anti-nutritional factors and their
correlations with protein and oil in soybeans
RAFAEL D. BUENO1
, LEANDRO L. BORGES1
, PEDRO I.V. GOOD GOD2
, NEWTON D. PIOVESAN1
, ARLINDO I. TEIXEIRA3
, COSME DAMIÃO CRUZ1 and
EVERALDO G. DE BARROS4
1
Universidade Federal de Viçosa/UFV, Instituto de Biotecnologia Aplicada à Agropecuária/ Bioagro, Campus Viçosa, Avenida Ph Rolfs, s/n, 36570-900 Viçosa, MG, Brazil 2
Universidade Federal de Viçosa/UFV, Instituto de Ciências Agrárias, Campus Rio Paranaíba, Rodovia AMG 230, Km 7, 38810-000 Rio Paranaíba, MG, Brazil 3
Instituto Federal do Sudeste de Minas, Campus Barbacena, Rua Monsenhor José Augusto, 204, São José, 36205-018 Barbacena, MG, Brazil
4
Programa de Pós-Graduação em Ciências Genômicas e Biotecnologia, Universidade Católica de Brasília, Campus Avançado Asa Norte, Avenida W5, 70790-160 Brasília, DF, Brazil
Manuscript received on September 12, 2014; accepted for publication on August 31, 2015
ABSTRACT
Soybeans contain about 30% carbohydrate, mainly consisting of non-starch polysaccharides (NSP) and oligosaccharides. NSP are not hydrolyzed in the gastrointestinal tract of monogastric animals. These NSP
negatively affect the development of these animals, especially the soluble fraction. This work aimed to
establish a method to quantify NSP in soybeans, using high performance liquid chromatography (HPLC),
and to estimate correlations between NSP, oligosaccharides, protein and oil. Sucrose, raffinose + stachyose,
soluble and insoluble NSP contents were determined by HPLC. Oil and protein contents were determined
by near-infrared spectroscopy (NIRS). The soluble PNAs content showed no significant correlation with protein, oil, sucrose and raffinose + stachyose contents, but oligosaccharides showed a negative correlation with protein content. These findings open up the possibility of developing cultivars with low soluble NSP
content, aiming to develop feed for monogastric animals.
Key words: soybean, carbohydrates, anti-nutritional factors, quantitative analysis, HPLC, NIR spectroscopy.
Correspondence to: Rafael Delmond Bueno E-mail: [email protected]
INTRODUCTION
Soybeans is the main source of protein in the diet of monogastric animals, but its use for certain species is limited by the presence of anti-nutritional factors (Anderson and Wolf 1995, Francis et al. 2001). Experiments have shown that feeds based on
soybean limit the growth of monogastric animals, mainly because they increase the viscosity of the digesta, reducing the absorption of the nutrients
(Kornegay 1978, Skrede and Krogdahl 1985,
Some anti-nutritional factors present in soybean grains are thermolabile, such as protease inhibitors and lectins. However, thermo-stable anti-nutritional factors are also present, such as non-starch polysaccharides (NSP) and oligosaccharides, which are not eliminated by thermal treatment
(Leske et al. 1993, Francis et al. 2001). These
soluble components are one of the main factors responsible for the antinutritional effects of soybeans (Choct et al. 2010).
The presence of raffinose oligosaccharides (RO), in particular raffinose and stachyose in soybeans, cause abdominal discomfort in humans and monogastric animals, such as cramps,
flatulence and diarrhea (Brasil et al. 2010). This
occurs because the mucous membrane in the small
intestine does not possess the α-galactosidase (E.C. 3.2.1.22 α-galactoside galactohydrolase) enzyme necessary for the hydrolysis of the α-1,6 linkages
present in RO, allowing these sugars to pass intact to the large intestine where they are fermented by anaerobic microorganisms creating excessive gas (Karr-Lilienthal et al. 2005, Smits and Annison 1996).
The carbohydrate fraction in soybeans contains about 10% oligosaccharides (5% sucrose,
4% stachyose and 1% raffinose) (Choct et al. 2010)
and between 15 to 25% NSP, constituted by 8% of cellulose polymers and the rest are hemicelluloses and pectic polysaccharides (Choct 1997). The NSP are formed by monosaccharide polymers, and are not digested by enzymes of digestive tract of non-ruminant animals (Guimarães et al. 2001).
NSP can be divided in three groups: cellulose polymers, non-cellulose polymers (pentosans,
arabinoxylans, xylans, β-glucans) and pectic
polysaccharides (glucomannans, galactomannans, arabinans, xyloglucans and galactans) (Choct and
Kocher 2000). NSP can be also classified as soluble
and insoluble.
Insoluble NSP are constituted by cellulose polymers and some hemicelluloses, while soluble
NSP are composed of pectins and the hemicellulose fraction. Monogastric animals do not have the enzymes to hydrolyze these carbohydrates, and thus, their digestion occurs by means of bacterial
fermentation. The role of fibre in monogastric diets
has attracted much attention in recent years, due
to the discovery of the antinutritional effects of
soluble NSP (Choct 1997).
According to Sinha et al. (2011), the presence of soluble NSP in the diet of monogastric animals and fish reduces the intestinal absorption of glucose, digestibility of amino acids, absorption of minerals and use of lipids. High levels of soluble fraction NSP, lead to decreased nutrient digestion and absorption in poultry and, to a lesser extent, in pigs (Antoniou et al. 1981, Choct and Annison 1990). Soluble NSP increase the viscosity of the digesta, leading to changes in the physiology and
the ecosystem of the gut (Angkanaporn et al. 1994).
This is probably related to a slower digesta passage
rate. The effect of NSP on digestibility depends on
their levels in the diet, their origin and composition (Freire et al. 2000). Soybeans contain on average 8-15% of insoluble NSP and 3-4% of soluble NSP (Choct 1997). Thus, the inclusion of high levels of
soybeans in feeds for monogastric animals and fish can increase the risk of intestinal disorders (Smits
and Annison 1996, Sinha et al. 2011).
Chemical and nutritional properties of soybean carbohydrates have been extensively reviewed (Karr-Lilienthal et al. 2005), as well as the anti-nutritional effects of soluble NSP and soybean oligosaccharides on digestibility, intestinal health and growth performance of pigs and poultry (Choct et al. 2010). However, NSP quantitation methods are scarce in the literature. These methods are essential to guide plant breeding programs to select plants with lower NSP levels, mainly in the soluble fraction.
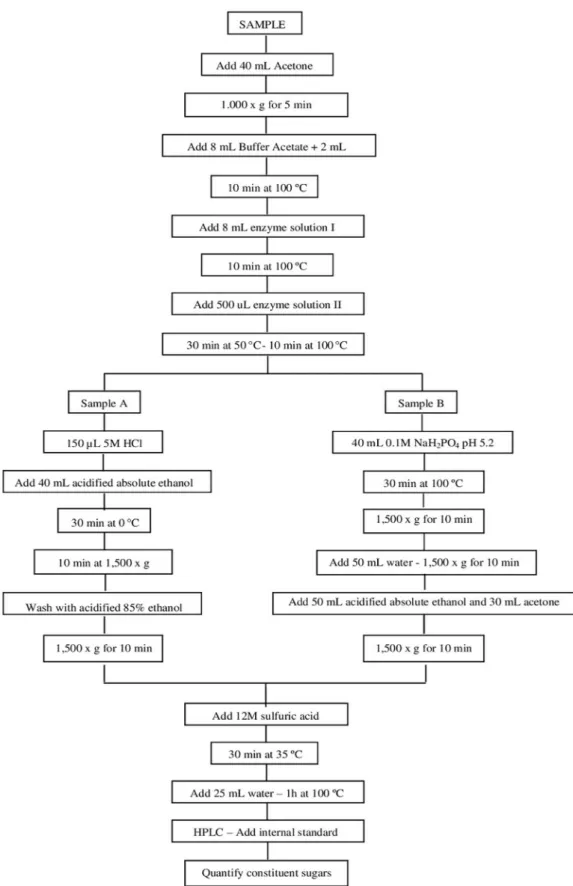
detailed flow chart of the steps for quantification of
NSP monosaccharide constituents.
Forty mL acetone was added to each sample,
and these were then shaken for 30 min. They were
then centrifuged at 1,000 x g, the supernatant was discarded and the tubes were placed in an oven at 75 ºC for acetone evaporation. The dry residue was
resuspended in 8 mL 0.1 M sodium acetate buffer,
pH 5.2, at 50 ºC, followed by addition of 2 mL dimethyl sulfoxide (DMSO). The homogenate was
then shaken for 10 min at 100 ºC. Two enzymatic
procedures were carried out to hydrolyze the starch.
First 8 mL of a thermo-stable α-amylase was added
to each tube, and these tubes were then incubated
in boiling water for 10 min. The α-amylase solution contained 2.5 mL of thermo-stable α-amylase
(code A3306; Sigma Chemical Co., St. Louis, MO) diluted in 200 mL 0.1 M sodium acetate
buffer pH 5.2. The tubes were then transferred to
another water bath at 50 ºC for 3 min, and then 500 μL of an enzymatic solution containing 10% (w/v) pancreatine (code P7545, Sigma Chemical Co., St. Louis, MO) and 2.5 mL (1,000 units) of pululanase (code P2986, Sigma Chemical Co., St. Louis, MO) were added to each tube. The tubes were maintained in a water bath for 30 min at 50 ºC and then for 10 min at 100 °C.
Precipitation and washing of the residue for
quantification of total NSP - (Sample A)
After the stages of enzymatic hydrolysis, samples designated “A” were cooled in an ice bath and 150 μL of 5 M HCl was added to each tube, which remained in the ice bath for 5 min. Next, 40 mL
acidified absolute ethanol was added to the tubes
(1 mL 5 M HCl / liter of absolute ethanol) and the determine the total and insoluble NSP, 300 mg of dried milled soybean from each sample was used.
The soluble NSP were determined by the difference
between the total NSP and the insoluble NSP. NSP was determined based on the methodology protein (Taware et al. 1997, Wilcox 1998, Xinhai
et al. 1999, Morrison et al. 2000, Wilcox and Shibles 2001, Alt et al. 2002, Bueno et al. 2013). However, correlations between these characters and the contents of oligosaccharides or NSP
have received little attention. The knowledge of
phenotypic association among these characters is important because it shows how the selection for one trait influences the expression of other characters. Breeding programs, usually in addition to targeting the upgrading of a main character
seeks also to maintain or improve the expression of other characters. This work aimed at establishing a
methodology to determine NSP in soybeans, using high performance liquid chromatography (HPLC) and to estimate the correlations among productivity, biochemical and anti-nutritional components of soybeans.
MATERIALS AND METHODS
MATERIALS
Analyses were carried out on six soy genotypes, p r o v i d e d b y C O O PA D A P ( C o o p e r a t i v a Agropecuária do Alto Paranaíba, Minas Gerais, Brazil): CS 02521, MSOY 8001, VENCEDORA, CS 02731, ELITE and CS 02564.
METHODS NSP Analysis
Soybean seeds were milled, divided and weighed in representative samples (A and B). To determine the total and insoluble NSP, 300 mg of dried milled soybean from each sample was used. The soluble
NSP were determined by the difference between
the total NSP and the insoluble NSP. NSP was determined based on the methodology developed by Englyst et al. (1994), which was adapted for the
specific conditions of this work. The assays were
Figure 1 - Flow chart illustrating the common hydrolysis steps and specific treatments for quantification of
developed by Englyst et al. (1994), which was
adapted for the specific conditions of this work.
The assays were run in duplicate for each sample.
Extraction and washing of the residue for
quantification of the insoluble NSP (Sample B)
After the enzymatic treatment, 40 mL 0.1 M sodium phosphate, pH 5.2 was added to the samples designated “B” and the tubes were incubated in
a boiling water bath for 30 min, with shaking by
inversion every 5 min. Next, the tubes were cooled at room temperature and centrifuged at 1,500 x g for 10 min. The supernatant was discarded and 10 mL water was added to the residue, which was mixed by inversion. Another 40 mL water was added, and
the tubes were shaken by inversion; centrifugation
was done at 1,500 x g for 10 min. The supernatant was discarded and this stage was repeated with 50
mL acidified absolute ethanol. Thirty mL acetone
was added to the residue and it was mixed in a vortex. Next, the tubes were centrifuged at 1,500 x g for 10 min. The supernatant was discarded and the tubes were placed in an oven at 75 ºC for total evaporation of the acetone.
Quantification of NSP monosaccharide
constituents
To each tube containing samples A and B 5 mL of 12 M sulfuric acid was added, then, these tubes were vortexed placed in a water bath at 35 ºC for 30 min. Next, 25 mL water was added, and the tubes were
mixed by inversion, kept in a water bath at 100 ºC
for 1 h and then, cooled down to room temperature.
The samples were vacuum filtered through a 47
mm diameter membrane with a 0.45 μm porosity.
The filtrate was transferred to a volumetric flask
of 250 mL, and the volume was completed to 250 mL with water. Then, 2.5 mL internal standard (1,000 ppm fucose) and 2.5 mL of hydrolysate
were added to a 25 mL flask, and the volume was
completed to 25 mL with deionized water. The
monosaccharides were separated and quantified by
high performance liquid chromatography (HPLC) in a Dionex equipment, using a CarboPac PA1 4 x 250 mm column and a mobile phase composed
of deionized water. The flow rate was of 1 mL/
min; the temperature of the column was 27 ºC and the detection was of the pulse amperometric type. After calibrating the equipment according to Englyst et al. (1994), 20 μL of each sample resulting from the acid hydrolysis were injected,
allowing the identification and quantification of
each carbohydrate present.
The concentrations of total, insoluble and soluble NSP (in g/100 g) were calculated as: total NSP = neutral sugars calculated for each sample A; insoluble NSP = neutral sugars calculated for each sample B and soluble NSP = total NSP – insoluble NSP.
Quantification of uronic acids
Neutral sugars and uronic acids compose the non-starch polysaccharides (NSP) that are measured
as an index of dietary fibre (Englyst et al. 1994).
Uronic acids are a class of sugar acids with both the carbonyl and the carboxylic acid functional groups. Soybean hydrolysates contain a variety of hemicellulosic sugars (including glucose, xylose, mannose, arabinose, and cellobiose) and sugar acids (e.g., galacturonic and glucuronic acids). Accurate
quantification of both mono- and disaccharides and
the uronic acids in biomass materials is important because compositional analysis enables evaluation of conversion yields and carbohydrate content. The
quantification of uronic acids in the samples was
test tube, followed by shaking. After this stage, the
tubes were heated to 70 °C for 40 min and cooled at room temperature. Then 200 μL of the solution of 0.1% 3,5-dimethylphenol (w/v) in glacial acetic
acid was added, followed by shaking. The test
tubes were left at room temperature for 15 min. The absorbances of the samples were measured at 400 and 450 nm. The absorbance readings at A450 nm were subtracted from those at A400 nm to determine the uronic acids concentration, expressed in μg/ mL, from a calibration curve prepared with uronic acid standards (25-150 μg/mL). Total uronic acid content was expressed in g/100 g of dry matter.
Quantification of sucrose and raffinose oligosaccharide (RO)
Extraction and quantification of sucrose and ROs
in soybeans were according to Guimarães et al. (2001). The beans were ground and about 30 mg
of soybean flour was used for sugar extraction. The
oil was removed by four successive extractions with 1.0 mL petroleum ether at 42 °C for 5 min. Three successive extraction steps with 80% ethanol at 100 °C for 5 min each were carried out
to extract the sugars from the defatted flour. After
each extraction step, the mixture was centrifuged at 18,407 x g for 5 min at room temperature. The alcoholic extracts were combined, evaporated in an oven at 50 °C, the sugars were resuspended in 1.0 mL 80% ethanol and the samples were frozen at -20 °C. Prior to analysis, the ethanol extracts were thaw, centrifuged at 18,407 x g for 10 min and
filtered in Millipore filter with a diameter of 0.45 mm. The filtrate was analyzed by HPLC.
For quantification of sucrose and ROs, standard
solutions containing sucrose (0 to 2,500 μg/mL),
raffinose (0 to 1,000 μg/mL) and stachyose (0 to
2,500 μg/mL) were used to build specific standard curves for each sugar.
For the standard curves and the analysis of the extracted sugars, a Shimadzu chromatograph 10A
series, equipped with a refraction index detector
was used. A column (25 x 0.465 cm) containing
aminopropyl group (-NH2) in the stationary phase
was used to separate the sugars. A
acetonitrile-water mixture (80:20) was used as mobile phase, in
isocratic conditions. The analyses were carried out
at 35 ºC in a 1.2 mL/min flow rate.
Quantification of total carbohydrate and ash
The total carbohydrate content was obtained by
percentage difference, as follows: %Carbohydrate = 100 - (%Protein + %ash + %oil). Ash content
was determined by calcinating the samples
at 550 °C, following the method described in
analytical guidelines from the Adolfo Lutz Institute
(Pregnolatto and Pascuet 1985).
Quantification of protein and oil
The protein and oil contents in the beans were
determined using a near-infrared spectrometer
(NIRS, Agrosystem, model Instalab 600 product
analyzer). About 10 grams of beans were used for
each genotype. The beans were ground in a mill
and analyzed in the NIR equipment.
Statistical analyses
Analysis of variance based on the completely
randomized model of the fixed nature, to test the
effect of the genotypes by means of the F-test,
utilized the statistical model Yij = μ + Gi + εij.
Duncan test was performed for comparison
between genotypes. The Pearson correlation
coefficients were also estimated between pairs
of evaluated characteristics and the significance
of correlation was estimated by the t-test. All the
statistical analyses were carried out using the
RESULTS AND DISCUSSION
QUANTIFICATION OF NSP
The total NSP content, calculated by the sum of the concentrations of the individual monosaccharides, is shown in Table I. NSP contents in soybean line
CS 02 731 and variety MSOY 8001 were different
of the other genotypes, according to the Duncan
test (p≤0.05). The monosaccharide concentrations
(Table I) are in agreement with the results reported by Irish and Balnave (1993), Huisman et al. (1998), and Guillon and Champ (2002). Among the six genotypes analyzed, glucose was the main
monosaccharide in the total NSP. Differences among
genotypes were also detected for concentrations of galactose, uronic acids, xylose and arabinose. According to (Hollung et al. 2005) and (Redondo-Cuenca et al. 2007), high concentrations of uronic acids, galactose and arabinose originate from the polysaccharide arabinogalactan, in which the principal chain consists of residues of D-galacturonic acid and L-ramnose, and the side chain is composed of galactose and arabinose. Arabinogalactans are pectic substances from the soluble fraction of NSP (Huisman et al. 1998).
In Table II, the mean values of monosaccharide concentrations (neutral sugars and uronic acids) of the insoluble fraction of the NSP are presented, expressed in g/100 g of dry matter. Concentrations of insoluble NSP did not differ among the six genotypes analyzed. The main monosaccharides of the insoluble NSP fraction of the six genotypes analyzed were glucose (32 to 43%) and galactose (14 to 21%). The genotype presenting the highest glucose content in the NSP insoluble fraction was line CS 02 731, while line CS 02 564 presented the lowest glucose content. The high galactose content can be attributed to the presence of galactomanans such as hemicellulosic polysaccharides. High glucose content in the insoluble fraction of NSP indicates that cellulose was the predominant polysaccharide (Redondo-Cuenca et al. 2007).
Uronic acid content from the insoluble NSP fraction varied from 13 to 22%, forming two
different groups (p≤0.05) in the Table II. Group 1
was formed by lines CS 02 731, CS 02 564 and by cultivar ELITE. Group 2 was formed by line CS 02 521 and cultivars MSOY 8001 and VENCEDORA. There was no difference for the mannose and arabinose contents among the genotypes in agreement with the results of Redondo-Cuenca et al. (2007). Irish and Balnave (1993) found concentrations of insoluble NSP similar to those
presented in the current work.
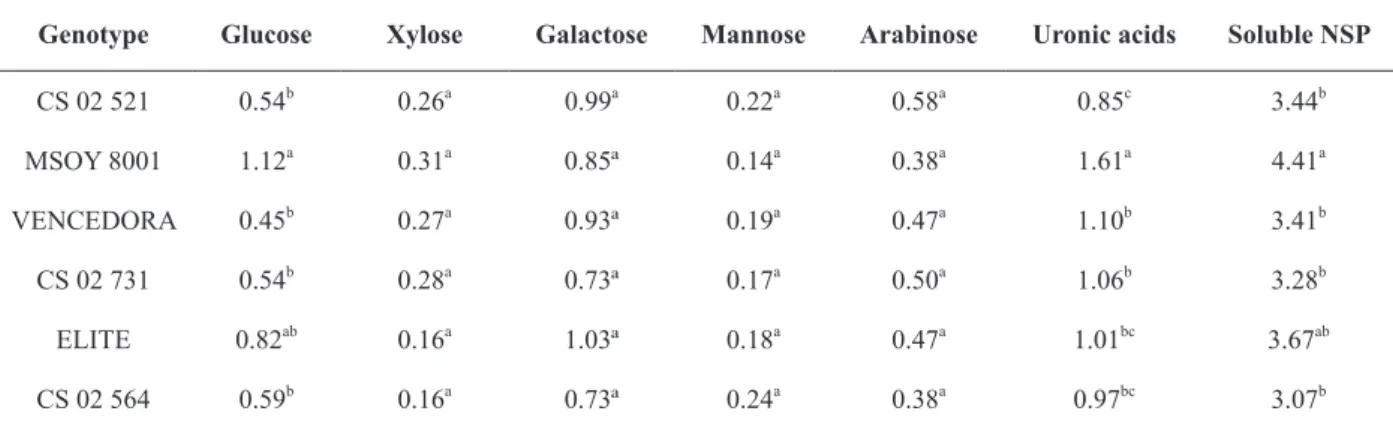
The soluble NSP content was about four times lower than that of insoluble NSP content (Tables II and III). According to Knudsen (1997) and Hollung et al. (2005), approximately one third of the total NSP are constituents of the soluble fraction. Cultivar MSOY 8001 was the genotype with the highest soluble NSP content (4.41 g/100 g
dry matter), while the other five genotypes did not differ among themselves at 5% probability.
Soluble NSP derivatives of soluble fractions of hemicellulose and pectin, and the high galactose and uronic acid concentrations are due to the fact that pectin are rich in galacturonic acid (150 to 500
units linked by α-1,4 glycosidic bonds) (Jayani et
al. 2005). Glucose, arabinose, mannose and xylose derive from the soluble fraction of hemicellulose,
which is mainly formed by residues of β-glucans,
D x y l a n s , D - m a n n a n s , x y l o g l u c a n s a n d arabinoxylans (Irish and Balnave 1993, Hollung et al. 2005, Choct et al. 2010, Maeda 2000).
CORRELATIONS ANALYSIS AMONG THE CHARACTERS EVALUATED
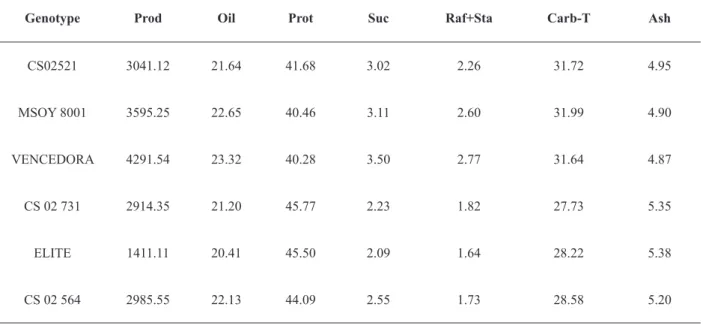
Table IV presents the mean results for productivity,
oil, protein, sucrose, raffinose + stachyose and
TABLE I
Mean concentrations of total NSP and its constituent (monosaccharides and uronic acids) in six soybean genotypes, expressed in dry matter (g.100g-1).
Genotypes Glucose Xylose Galactose Mannose Arabinose Uronic acids Total NSP
CS 02 521 5.28c
1.81a 3.34a 0.72a 2.20a 2.60c 15.95bc MSOY 8001 5.52b
1.57b 3.38a 0.60d 2.11ab 3.55ab 16.73a VENCEDORA 4.89d
1.48bc 3.32a 0.67ab 2.00bc 3.10b 15.46cd
CS 02 731 5.89a 1.61b 2.76b 0.64bc 1.99bc 3.60a 16.49a
ELITE 5.46bc
1.46bc 2.77b 0.62cd 1.94c 3.70a 15.95bc CS 02 564 4.46e
1.38c 2.92b 0.71a 1.93c 3.70a 15.10d
Means followed by the same letter in columns do not differ significantly at the level of p ≤0.05, by the Duncan test.
TABLE II
Mean concentrations of insoluble NSP and its constituent (monosaccharides and uronic acids) in six soybean genotypes, expressed in dry matter (g.100g-1).
Genotype Glucose Xylose Galactose Mannose Arabinose Uronic Acids Insoluble NSP
CS 02 521 4.75b
1.55a 2.35ab 0.49a 1.63a 1.75b 12.52a MSOY 8001 4.41b
1.25b 2.53a 0.44a 1.74a 1.95b 12.32a
VENCEDORA 4.44b 1.20b 2.39ab 0.48a 1.52a 2.02b 12.05a
CS 02 731 5.35a
1.33ab 2.04c 0.47a 1.48a 2.55a 13.22a
ELITE 4.64b
1.31ab 1.74d 0.43a 1.47a 2.70a 12.29a CS 02 564 3.87c
1.22b 2.19bc 0.47a 1.55a 2.73a 12.03a
Means followed by the same letters in columns do not differ significantly at the level of p ≤0.05, by the Duncan test.
TABLE III
Mean concentrations of soluble NSP and its constituent (monosaccharides and uronic acids) in six soybean genotypes, expressed in dry matter (g.100g-1).
Genotype Glucose Xylose Galactose Mannose Arabinose Uronic acids Soluble NSP
CS 02 521 0.54b
0.26a 0.99a 0.22a 0.58a 0.85c 3.44b MSOY 8001 1.12a
0.31a
0.85ª 0.14a
0.38a
1.61a
4.41a VENCEDORA 0.45b
0.27a
0.93ª 0.19a
0.47a
1.10b
3.41b CS 02 731 0.54b
0.28a
0.73ª 0.17a
0.50a
1.06b
3.28b ELITE 0.82ab
0.16a
1.03ª 0.18a
0.47a
1.01bc
3.67ab CS 02 564 0.59b
0.16a
0.73ª 0.24a
0.38a
0.97bc
3.07b
the characteristics studied, which is consistent with the data reported in the literature (Hymowitz et al. 1972, Bonato et al. 2000, Hou et al. 2009, Bueno et al. 2013).
P a i r w i s e e s t i m a t e s f o r t h e P e a r s o n
correlation coefficients of the evaluated characters
(productivity, oil, protein, sucrose, raffinose
+ stachyose, total carbohydrates, Total NSP,
Insoluble NSP and Soluble NSP) are depicted in Table V. Productivity and protein content were
negatively correlated (-0.80). This fact confirms
the difficulty of obtaining genotypes with both high yield and high protein content, indicating that selection for one trait can result in the decline of other. In contrast, productivity was positively and
significantly correlated with oil (0.84), while that
the protein and oil contents presented a negative
and significant correlation (-0.83). Similar results
were found by Bonato et al. (2000), Wilcox and Shibles (2001) and Rodrigues et al. (2010).
Productivity was positively correlated
with sucrose (0.74) and raffinose + stachyose
(0.79) contents. These results are in accordance with Table IV that shows that high productivity individuals also had high concentrations of oil,
sucrose, raffinose + stachyose and low protein
content. Similar associations were demonstrated by Wilcox and Shibles (2001) in a study that found
significant associations between productivity and contents of protein and oil, while no significant
correlation was seen between productivity and the contents of total carbohydrates, sucrose and
raffinose + stachyose.
Oil content associated positively and significantly with sucrose (0.68) and stachyose
+ raffinose (0.75). This significant positive
association was expected, sucrose is the major form in which carbon is assimilated photosynthetically
in which it is transported to sinks, such as the oil
that is accumulated in the seeds (Baud and Lepiniec 2010).
Sucrose content was positively and significantly correlated with stachyose + raffinose (0.97) and
with total carbohydrate (0.69) contents (Table
V). The high and significant positive correlations between sucrose and raffinose + stachyose contents
are in agreement with the RO metabolic pathway which depends on sucrose as substrate (Dey 1985). These correlations indicate that selection of soybean cultivars with high sucrose and low
raffinose + stachyose contents will be a difficult task if only classical breeding methods are used.
Positive correlations were reported previously between sucrose and total sugar (r = 0.85) (Hymowitz et al. 1972) and between sucrose and
raffinose + stachyose (Hartwig et al. 1997, Cicek et
al. 2006). Hymowitz et al. (1972) reported sucrose
content to be positively correlated with raffinose and negatively correlated with stachyose; raffinose
were also negatively correlated stachyose. In the six genotypes evaluated in this study, no negative correlations were detected among the three sugars.
The data demonstrated that increases in seed protein in six soybean genotypes were at the expense of both oil and carbohydrates, particularly sucrose (Tables IV and V). The decreases in seed carbohydrates with increasing seed protein would contribute to increased nutritional value of the meal. The value of the Pearson correlation coefficient obtained between total carbohydrate
and total NSP contents was significant and positive
(0.75). The same trend was observed between total NSP and insoluble NSP contents (0.62) (Table V). However, total, insoluble and soluble NSP
contents did not correlate significantly at 1 or 5 %
probability with productivity, or with protein, oil,
sucrose and raffinose + stachyose contents. These findings indicate that productive genotypes with
TABLE IV
Mean values for productivity (Prod, Kg.ha-1) and content of oil (Oil), protein (Prot), sucrose (Suc), raffinose+stachyose
(Raf + Sta) and total carbohydrates (Carb-T), in six soybean genotypes, based on dry matter.
Genotype Prod Oil Prot Suc Raf+Sta Carb-T Ash
CS02521 3041.12 21.64 41.68 3.02 2.26 31.72 4.95
MSOY 8001 3595.25 22.65 40.46 3.11 2.60 31.99 4.90
VENCEDORA 4291.54 23.32 40.28 3.50 2.77 31.64 4.87
CS 02 731 2914.35 21.20 45.77 2.23 1.82 27.73 5.35
ELITE 1411.11 20.41 45.50 2.09 1.64 28.22 5.38
CS 02 564 2985.55 22.13 44.09 2.55 1.73 28.58 5.20
Mean values were obtained in triplicate for each sample.
TABLE V
Estimated pairwise Pearson correlation coefficients for: productivity (Prod, Kg.ha-1) and contents (g.100 g
-1) of oil (Oil),
protein (Prot), sucrose (Suc), raffinose + stachyose (Raf+Sta), total carbohydrates (Carb), total NSP (tNSP), insoluble NSP (iNSP) and soluble NSP (sNSP), analyzed in six soybean genotypes, based on dry matter.
Prod Oil Prot Suc Raf+Sta Carb tNSP iNSP sNSP
Prod 0.84** -0.80** 0.74** 0.53 0.78** 0.79** 0.46 -0.07
Oil -0.83** 0.68* 0.75** 0.27 -0.20 -0.40 0.22
Prot -0.84** -0.86** -0.49 -0.01 0.31 -0.35
Suc 0.97** 0.69* 0.13 -0.19 0.36
Raf+Sta 0.68* 0.13 -0.21 0.39
Carb 0.75** 0.51 0.31
tNSP 0.62* 0.47
iNSP -0.40
sNSP
CONCLUSIONS
We have demonstrated that HPLC is a potential tool to identify heat-stable antinutritional factors, such as NSP and oligosaccharides in soybeans, and that it can be used for selecting more appropriate soybean genotypes for feeding monogastric
animals. A positive and significant association was found between sucrose and raffinose + stachyose contents. Likewise, significant and positive
correlations were observed between oil, sucrose and
raffinose + stachyose contents. On the other hand, protein content was negatively and significantly correlated with sucrose and raffinose + stachyose contents. Significant correlations were not found
between NSP content with protein, oil, sucrose
and raffinose + stachyose contents. Based on these
observations it can be predicted that lines with lower NSP content, especially soluble NSP, can be
selected without affecting oil or protein content.
ACKNOWLEDGMENTS
We wish to acknowledge the memory of Dr.
Maurilio Alves Moreira (“in memoriam”) for his
guidance during this work. The authors express
their gratitude to Fundação de Amparo à Pesquisa do Estado de Minas Gerais (FAPEMIG) and
Conselho Nacional de Desenvolvimento Científico
e Tecnológico (CNPq) (Brazilian government)
for financial support and to Cooperativa do Alto
Paranaíba for supplying the genetic material.
REFERENCES
ALT BJ, FEHR WR AND WELKE GA. 2002. Selection for large seed and high protein in two- and three-parent soybean populations. Crop Sci 42: 1876-1881.
ANDERSON RL AND WOLF WJ. 1995. Compositional changes in trypsin-inhibitors, phytic acid, saponins and isoflavones related to soybean processing. J Nutr 125: S581-S588.
ANGKANAPORN K, CHOCT M, BRYDEN WL, ANNISON EF AND ANNISON G. 1994. Effects of wheat pentosans
on endogenous amino-acid losses in chickens. J Sci Food
Agr 66: 399-404.
ANTONIOU T, MARQUARDT RR AND CANSFIELD PE. 1981. Isolation, partial characterization, and antinutritional activity of a factor (pentosans) in rye grain. J Agr Food Chem 29: 1240-1247.
BAUD S AND LEPINIEC L. 2010. Physiological and developmental regulation of seed oil production. Prog Lipid Res 49: 235-249.
BONATO ER, BERTAGNOLLI PF, LANGE CE AND RUBIN SAL. 2000. Teor de óleo e de proteína em genótipos de soja desenvolvidas após 1990. Pes Agro Bras 35: 2391-2398. BRASIL APR, DE REZENDE ST, PELUZIO MDG AND
GUIMARAES VM. 2010. Removal of oligosaccharides in soybean flour and nutritional effects in rats. Food Chem 118: 251-255.
BUENO RD, BORGES LL, ARRUDA KMA, BHERING LL, BARROS EG AND MOREIRA MA. 2013. Genetic parameters and genotype x environment interaction for productivity, oil and protein content in soybean. Afr J Agr Res 8: 4853-4859.
CHOCT M. 1997. Feed non-starch polysaccharides: chemical structures and nutritional significance. Feed Mill Int 191: 13-26.
CHOCT M AND ANNISON G. 1990. Anti‐nutritive activity
of wheat pentosans in broiler diets. British poultry science 31: 811-821.
CHOCT M, DERSJANT-LI Y, MCLEISH J AND PEISKER M. 2010. Soy Oligosaccharides and soluble non-starch polysaccharides: a review of digestion, nutritive and anti-nutritive effects in pigs and poultry. Asian Austral J Anim 23: 1386-1398.
CHOCT M AND KOCHER A. 2000. Non-starch polysaccharides: chemical structures and nutritional significance. Feed Mill Int: 13-27.
CICEK MS, CHEN PY, MAROOF MAS AND BUSS GR. 2006. Interrelationships among agronomic and seed quality traits in an interspecific soybean recombinant inbred population. Crop Sci 46: 1253-1259.
CRUZ CD. 2013. GENES - a software package for analysis in
experimental statistics and quantitative genetics. Acta Sci Agron 35: 271-276.
DEY PM. 1985. D-galactose-containing oligosaccharides. In: Dey PM and Dixon RA (Eds), Biochemistry of storage
carbohydrates in green plants, New York: Academic Press,
p. 53-129.
ENGLYST HN AND CUMMINGS JH. 1984. Simplified method for the measurement of total non-starch polysaccharides by gas-liquid-chromatography of constituent sugars as alditol acetates. Analyst 109: 937-942.
liquid-chromatographic or spectrophotometric measurement of constituent sugars. Analyst 119: 1497-1509.
FRANCIS G, MAKKAR HPS AND BECKER K. 2001. Antinutritional factors present in plant-derived alternate fish feed ingredients and their effects in fish. Aquaculture 199: 197-227.
FREIRE JPB, GUERREIRO AJG, CUNHA LF AND AUMAITRE A. 2000. Effect of dietary fibre source on total tract digestibility, caecum volatile fatty acids and digestive transit time in the weaned piglet. Anim Feed Sci Tech 87: 71-83.
GUILLON F AND CHAMP MMJ. 2002. Carbohydrate fractions of legumes: uses in human nutrition and potential for health. Brit J Nutr 88: S293-S306.
GUIMARÃES VM, REZENDE ST, MOREIRA MA, BARROS EG AND FELIX CR. 2001. Characterization
of α-galactosidases from germinating soybean seed and
their use for hydrolysis of oligosaccharides. Phytochem 58: 67-73.
HARTWIG EE, KUO TM AND KENTY MM. 1997. Seed protein and its relationship to soluble sugars in soybean. Crop Sci 37: 770-773.
HOLLUNG K, ØVERLAND M, HRUSTIC M, SEKULIC P, MILADINOVIC J, MARTENS H, NARUM B, SAHLSTRØM S, SØRENSEN M AND STOREBAKKEN T. 2005. Evaluation of nonstarch polysaccharides and oligosaccharide content of different soybean varieties (Glycine max) by near-infrared spectroscopy and proteomics. J Agr Food Chem 53: 9112-9121.
HOU A, CHEN P, SHI A, ZHANG B AND WANG YJ. 2009. Sugar variation in soybean seed assessed with a rapid extraction and quantification method. Int J Agr 1: 1-8. HUISMAN MMH, SCHOLS HA AND VORAGEN AGJ.
1998. Cell wall polysaccharides from soybean (Glycine max.) meal. Isolation and characterisation. Carbohyd Polym 37: 87-95.
HYMOWITZ T, COLLINS FI, PANCZNER J AND WALKER WM. 1972. Relationship between the content of oil, protein, and sugar in soybean seed. Agron J 64: 613-616. IRISH GG AND BALNAVE D. 1993. Non-starch
polysaccharides and broiler performance on diets containing soyabean meal as the sole protein concentrate. Crop Past Sci 44: 1483-1499.
JAYANI RS, SAXENA S AND GUPTA R. 2005. Microbial pectinolytic enzymes: a review. Process Biochem 40: 2931-2944.
KARR-LILIENTHAL LK, KADZERE CT, GRIESHOP CM AND FAHEY JR GC. 2005. Chemical and nutritional properties of soybean carbohydrates as related to nonruminants: a review. Livest Prod Sci 97: 1-12.
KNUDSEN KEB. 1997. Carbohydrate and lignin contents of plant materials used in animal feeding. Anim Feed Sci Tech 67: 319-338.
KORNEGAY ET. 1978. Feeding value and digestibility of soybean hulls for swine. J Anim Sci 47: 1272- 1280. LESKE KL, JEVNE CJ AND COON CN. 1993. Effect of
oligosaccharide additions on nitrogencorrected true metabolizable energy of soy protein-concentrate. Poultry Sci 72: 664-668.
MAEDA H. 2000. Soluble soybean polysaccharide. In: Phillips
GO and Williams PA (Eds), Handbook of hydrocolloids,
Cambridge, England: Woodhead Publishing, p. 309-319. MORRISON MJ, VOLDENG HD AND COBER ER. 2000.
Agronomic changes from 58 years of genetic improvement of short-season soybean cultivars in Canada. Agron J 92: 780-784.
PREGNOLATTO W AND PASCUET NS. 1985. Métodos físico-químicos para análise de alimentos, São Paulo, SP: Instituto Adolfo Lutz, 1020 p.
REDONDO-CUENCA A, VILLANUEVA-SUAREZ MJ, RODRIGUEZ-SEVILLA MD AND MATEOS-APARICIO I. 2007. Chemical composition and dietary fibre of yellow and green commercial soybeans (Glycine max). Food Chem 101: 1216-1222.
RODRIGUES JID, DE MIRANDA FD, FERREIRA A, BORGES LL, FERREIRA MFD, GOOD-GOD PIV, PIOVESAN ND, DE BARROS EG, CRUZ CD AND MOREIRA MA. 2010. Mapping QTL for protein and oil content in soybean. Pesq Agro Bras 45: 472-480.
SINHA AK, KUMAR V, MAKKAR HPS, DE BOECK G AND BECKER K. 2011. Non-starch polysaccharides and their role in fish nutrition - a review. Food Chem 127: 1409-1426.
SKREDE A AND KROGDAHL A. 1985. Heat affects nutritional characteristics of soybean-meal and excretion
of proteinases in mink and chicks. Nutr Rep Int 32:
479-489.
SMITS CHM AND ANNISON G. 1996. Non-starch plant polysaccharides in broiler nutrition-towards a physiologically valid approach to their determination. World’s Poultry Sci J 52: 203-222.
TAWARE SP, HALVANKAR GB, RAUT VM AND PATIL VP. 1997. Variability, correlation and path analysis in soybean hybrids. Soybean Gen News 24: 96-98.
WILCOX JR. 1998. Increasing seed protein in soybean with eight cycles of recurrent selection. Crop Sci 38: 1536-1540.
WILCOX JR AND SHIBLES RM. 2001. Interrelationships among seed quality attributes in soybean. Crop Sci 41: 11-14.
ZHANG LY, LI DF, QIAO SY, JOHNSON EW, LI BY, THACKER PA AND HAN IK. 2003. Effects of stachyose