http://www.uem.br/acta ISSN printed: 1679-9275 ISSN on-line: 1807-8621
Doi: 10.4025/actasciagron.v38i3.28424
Importance of agronomic traits in the individual selection process
of sugarcane as determined using logistic regression
Bruno Portela Brasileiro1*, Luiz Alexandre Peternelli1, Luís Cláudio Inácio da Silveira2 and
Márcio Henrique Pereira Barbosa2
1Departamento de Estatística, Universidade Federal de Viçosa, 36570-000, Viçosa, Minas Gerais, Brazil. 2Departamento de Fitotecnia,
Universidade Federal de Viçosa, Viçosa, Minas Gerais, Brazil. *Author for correspondence: E-mail: [email protected]
ABSTRACT. The aim of this study was to evaluate the importance of agronomic traits during the selection of sugarcane (Saccharum spp.), as well as to evaluate the potential for using logistic regression and decision trees to identify the best genotypes. A total of 7,719 seedlings of 128 half-sib families were evaluated during the first test phase (T1), and 659 clones were selected for the second (T2). Logistic regression was applied to both populations. The number of stalks, bud prominence and length of the internode were the most important selection traits in the T1 population. The plant vigor, stalk diameter and stalk height were the most important selection traits in the T2 population. There were 174 individuals selected when using the mass selection method in T1 and 113 individuals in T2, whereas a logistic regression selected 153 individuals in T1 and 79 in T2. The apparent error rates of the logistic models fitted to the selections in T1 and T2 were 0.8 and 5.10%, respectively. By using a decision tree, 67 clones were selected among the most productive ones in phase T2. Therefore, the formulation of decision trees is highly applicable to identifying potential clones during the initial phases of breeding programs.
Keywords:Saccharum spp., decision tree, crop breeding.
Importância dos caracteres agronômicos no processo de seleção individual em
cana-de-açúcar determinado via regressão logística
RESUMO. O objetivo desse trabalho foi avaliar a importância dos caracteres agronômicos durante o processo de seleção individual em cana-de-açúcar, além de avaliar o potencial do uso da regressão logística e da árvore de decisão na identificação dos melhores genótipos. Foram avaliados 7.719 seedlings na primeira fase de teste (T1) e 659 clones na segunda fase de teste (T2). Os caracteres número de colmos, saliência da gema e comprimento do entre-nó foram os de maior importância no processo de seleção massal realizado no T1. Vigor da planta, diâmetro de colmo e altura de colmo foram os mais importantes na seleção do T2. Pelo método massal foram selecionados 174 indivíduos no T1 e 113 no T2, enquanto a regressão logística selecionou 153 indivíduos no T1 e 79 no T2. A taxa de erro aparente dos modelos logísticos ajustados para as seleções no T1 e T2 foram de 0,8 e 5,10%, respectivamente. Com o uso da árvore de decisão foram selecionados 67 clones dentre os mais produtivos na fase T2. A elaboração de árvores de decisão apresenta grande aplicabilidade na identificação de clones potenciais nas fases iniciais dos programas de melhoramento genético da cana-de-açúcar.
Palavras-chave:Saccharum spp., árvore de decisão, melhoramento genético.
Introduction
During the initial phases of sugarcane (Saccharum
spp.) genetic breeding programs, the genotypes are not evaluated through replication. The plants are maintained in a single environment, and the best genotypes are visually selected (mass selection), i.e., based on the phenotype of the individuals (Oliveira et al., 2013). The main selection criteria adopted by breeders during mass selection are associated with traits that are components of production, such as the number of stalks and the stalk diameter and height (Oliveira et al., 2008; Zhou et al., 2011).
Although mass selection is routinely used during the initial phases of sugarcane genetic breeding programs, this type of strategy has been criticized due to its inefficiency because of the lack of replication and the lack of genotype-environment interactions (Barbosa, Resende, Bressiani, Silveira, & Peternelli, 2005; Stringer, Cox, Atkin, Wei, & Hogarth, 2011).
Oliveira et al. (2013), followed by visual selection of the best available genotypes from the best families. In visual selection, discarding or keeping an individual depends on a combination and magnitude of the production components (Zhou et al., 2011). However, the incidence of a certain disease, the prominence of the axial bud, the presence of a stalk pith, the occurrence of flowering, the plant vigor, fiber and sugar content, as well as other agronomically important traits may also influence decisions made by the breeder.
Studies of sugarcane have intensively explored path analysis to evaluate the effect of quantitative traits related to sugar and biomass yield (Espósito, Peternelli, Mendes, & Barbosa, 2012; Brasileiro, Peternelli, & Barbosa, 2013; Silveira et al., 2015). However, the effects of quantitative, binary and multicategorical traits on yield or on the breeder's decision to select or eliminate a genotype based on probability cannot be simultaneously evaluated in this type of analysis.
The choice to select or reject a determined genotype is inherently a binary response. In this case, a logistic regression analysis may be applied to evaluate the effect or power of discrimination of each agronomic trait used as a selection criterion, as well as to calculate the probabilities of the selection of different individuals (Agresti, 2007). Zhou et al. (2014) demonstrated the potential for using a logistic regression model as a statistical decision support tool for selection among individual seedlings based only on production components during the initial phases of genetic breeding programs for sugarcane. Brasileiro et al. (2015) also noted the potential for logistic regression during seedling selection and the importance of qualitative traits in breeder decision-making.
The aim of this study was to evaluate the relative importance of agronomic traits during the mass selection process in sugarcane at different stages of a breeding program to deepen the understanding of yield components and qualitative agronomic traits, as well as to evaluate the potential of using logistic regression in the construction of decision trees to identify the best genotypes.
Material and methods
Test phase 1 - T1
The 128 half-sib families used in this study were produced from crosses made in 2010 at the Serra do Ouro Experimental Station, which belongs to the Universidade Federal de Alagoas and is located in the municipality of Murici, Alagoas State, Brazil.
After acclimatization, the seedlings were sent to the Centro de Experimentação em Cana-de-açúcar (CECA) for use in the experiment. CECA belongs to the Universidade Federal de Viçosa in the municipality of Oratórios, Minas Gerais State, and is located at 20º25’S latitude and 42º48’W longitude at an altitude of 494 m.
The 128 families were distributed in 7 experiments in a randomized block design with 6 replicates. Each experiment consisted of 20 families, and two of these families (RB011532 × ? and SP80-3250 × ?) were present in all of the experiments, which allowed for them to be subjected to a combined analysis. The 840 evaluated plots consisted of 10 plants distributed along a 5 m long plant row with a spacing of 1.40 m, for a total of 8,400 plants.
Phenotype evaluation in T1
After the first cutting and already in the ratoon cane stage, 7,719 surviving plants from the 128 families were evaluated during the months of May and June 2012. The traits were evaluated per plant, and the stalk diameter (SD), stalk height (SH), number of stalks (NS), bud prominence (BP), internode length (IL), leaf architecture (LA), the presence of cracks (CR) and suckers (SU) were used as the selection criteria.
As noted by Brasileiro et al. (2015), the use of categorical data for yield components (SD, SH and NS) did not affect the quality of the logistic model. Therefore, due to the ease of classification by the breeder of the perceived stem diameter and plant height, the genotypes were classified as good diameter (SD = 1) and poor diameter (SD = 0), as well as tall plant (SH = 1) and short plant (SH = 0); the breeders had 25 years of work experience in clonal selection. In particular, for NS, a value of 1 was assigned to plants that had at least 6 stalks, as suggested by Pedrozo et al. (2008).
Test phase 2 - T2
Based on the application of Simulated Individual BLUP (BLUPIS) (Resende & Barbosa, 2006) and mass selection, 659 clones were selected from the best families identified in phase T1. The T2 phase was established at CECA in July 2012 in an augmented block design (ABD), with two cultivars as controls (RB867515 and SP80-1842) and 49 replicates. Each of the 757 plots consisted of one 4-m long plant row, with plants spaced 1.4 m apart. The ABD has proven to be effective in this final phase of experimentation in sugarcane (Souza, Peternelli, & Barbosa, 2006; Peternelli, Souza, Barbosa, & Carvalho, 2009).
Phenotypic evaluation in T2
Phenotypic evaluation of the 659 clones selected in the 128 families was carried out in the plant cane stage in May and June 2013. The NS, SD, SH, BP, CR, IL and LA traits were evaluated and used as selection criteria, as described above, as well as the presence of leaf hairiness (LH), the presence of smut (Ustilago scitaminea) (PS), flowering (FL), stalk pith (SP), hollow stalk (HS) and plant vigor (VIG).
For the NS, SD, SH, BP, IL and LA traits, a value of 1 (one) was assigned when selection was desirable based on each trait and 0 (zero) was assigned otherwise. For LH, CR, FL, PS, SP and HS, 1 was assigned to indicate the presence of leaf hairiness, stalk cracks, flowering, smut, stalk pith and hollow stalk and 0 for the absence of these features in the plants. For VIG, distinct values from 1 to 5 were assigned, with 1 = least vigor and 5 = greatest vigor. The scores were assigned by a technician with 25 years of experience in clonal selection, and mainly reflect plant health, plant architecture, and stem number, diameter and height.
The sucrose content (SC) in the sugarcane was also evaluated by technological analysis. For this analysis, a 500 g sample of bagasse was separated after grinding 10 stalks per plot. The extracted broth was clarified for analysis with a sugar polarimeter, and the sucrose content (SC) was determined according to the methodology of Fernandes (2003).
Values in tons of cane per hectare (TCH) were estimated from the number of stalks and the weight of a 10-stalk sample per plot:
6 . 5 / ) 10 ( × ×
= NS SW
TCH , in which NS is the
number of stalks in the plot, SW is the average stalk weight obtained from weighing a 10-stalk sample,
and 5.6 is the area occupied by the plot in m2. The
tons of sucrose per hectare (TSH) was estimated
using the following formula: TSH =(TCH×SC)/100
Mass selection
Mass selection was performed in phases T1 and T2 by a technician with 25 years of experience in visual selection in the sugarcane genetic breeding program. Before making decisions about the genotypes to be selected, all of the genotypes present in the experiment were individually evaluated based on the aforementioned selection criteria. All of the clones selected by mass selection were planted in stage T2 along with the clones indicated by BLUPIS.
Logistic regression
The logistic regression model constitutes a special type of generalized linear model developed for cases in which the response variable is categorical (binary or multinomial). Through a logistic model, the impact of the explanatory variables on the response variable may be evaluated (Agresti, 2007). Therefore, a logistic regression was applied with the aim of determining the importance of the agronomic traits in the mass selection process carried out in phases T1 and T2.
In model prediction, a cut-off point of 0.5 was
adopted; i.e., individuals i(i=1,2,3,...n) were
selected if they exhibited a probability of selection above 0.5. The probability of selection was estimated using the following logistic regression model:
) k 0 j ) ij x j ˆ exp( 1 /( k 0 j ) ij x j ˆ exp( i pˆ = β + = β = ,
where: βˆj= regression coefficients,
x
ij
= values ofthe explanatory variables (selection criteria)
j
ineach individual
i
, andk
= the number of variables.The apparent error rates of the regression models were calculated based on the number of individuals incorrectly classified by the logistic model in relation to the total number of plants evaluated in the experiment:
= = g 1 j j m N 1 AER ,
where: N = total number of observations, g = number of responses (Select = 1 or Discard = 0),
and mj = number of incorrect classiications in each
Logistic regression analyses were performed using R software (R Development Core Team, 2015).
Selection in T2 through a decision tree
For selection using a decision tree (Breiman, Friedman, & Olshen, 1984), a pre-selection of 10% of the individuals with the highest mean genotypic values for TCH or TSH was performed via REML/BLUP. The information from the traits evaluation of these clones was then used to implement a decision tree.
The data on tons of cane per hectare (TCH) and tons of sucrose per hectare (TSH) of the 659 clones were analyzed via REML/BLUP using the following model: y = Xr+Zg+Wb+e, in which y= the data vector (y~N(Xr, V)); r is the vector of the effects, assumed to be fixed (overall mean value); g is the vector of the genotypic effects (random), g~N(0,G), where G = genetic
covariance matrix of the genotypes (G = I
σ
g2); bis the vector of the environmental effects of
blocks (fixed), where b~N(0, I
σ
b2); e is thevector of errors or residues (random), where e~N(0, R), and R = residual covariance matrix
(R = I 2
e
σ ). The X, Z and W variables are the
incidence matrices for the said effects. The
variance components
σ
g2,2 b
σ and σ2e
correspond to the genotypic variance, block variance, and residual variance, respectively.
The REML/BLUP mixed models were analyzed using SELEGEN software (Resende, 2007).
Results and discussion
All of the traits exhibited significant effects in the logistic regression model fitted to the mass selection applied in phase T1 (Table 1). Therefore, all of the evaluated traits have some influence on breeder decision-making.
According to the values of the odds ratios
(exp(
β
ˆ
j), which reflect the effect of each trait onthe probability of selection by logistic regression, NS, BP, IL, SD, SH, LA, SS and CR, in this order, were the most important traits in the mass selection process in T1 (Figure 1).
In phase T2, according to the obtained results, it was possible to verify the absence of significant effects of the NS, CR, IL, LA, FL, LH and PS traits in the complete logistic regression model (Table 1).
In this case, we decided to eliminate these
traits
from the analysis for having no influence on breeder decision-making. A new model with the remaining traits was fitted (reduced model) and, according to the values of the odds ratios, the VIG, SD, SH, BP, SP and HS traits were the most important, in that order, in the mass selection process carried out in T2 (Figure 1).
According to the obtained Akaike information criteria (AIC) values, a better fit was observed in the reduced model (AIC = 205.32 for the reduced model vs. AIC = 214.54 for the full model). The smaller values of AIC reflect a better overall fit (Akaike, 1974) (Table 1). Therefore, the removal of traits that do not contribute to breeder decision-making contributed to a better final predictive model.
In phase T1, according to the odds ratios, a plant with more than 5 stalks has a 1.665 times greater chance of being selected than a plant with up to 5 stalks. If a plant has a bud that is not very prominent, its chance of being selected is 408 times greater than that of a plant with a large bud. A plant with a uniform internode has a 90 times greater chance of being selected compared to plants with non-uniform internodes. If the plant has an SD that is considered good, its chance of selection will be 85 times greater than that of a plant with a small stalk diameter. Finally, for SH, the chance of a plant with good height being selected is 77 times greater than that of a plant with shorter stature (Table 1).
Table 1. The regression coefficients (βˆj), standard deviation (DEV), p-value and odds ratio (OR) of the explanatory variables (traits) used in the logistic models fitted to the mass selection carried out in phases T1 and T2.
Traits
Parameters in T1 Parameters – full model in T2 Parameters – reduced model in T2
j ˆ
β DEV p-value‡ OR
j ˆ
β DEV p-value OR βˆj DEV p-value OR
SU†
-0.9 0.31 0.01 0.41
NS 7.42 1.03 0.00 1,665.03 0.99 0.76 0.19
SH 4.35 0.45 0.00 77.12 1.62 0.62 0.01 5.04 1.60 0.60 0.01 4.97 BP 6.01 0.74 0.00 408.30 1.50 0.57 0.01 4.49 1.49 0.56 0.01 4.45 SD 4.45 0.42 0.00 85.95 2.25 0.65 0.00 9.44 2.27 0.63 0.00 9.67 CR -2.62 0.41 0.00 0.07 -0.07 0.62 0.91
IL 4.50 0.75 0.00 90.46 14.31 921.81 0.99 LA 1.81 0.35 0.00 6.10 0.28 0.58 0.63
FL 0.46 0.49 0.35
LH 0.11 0.52 0.82
PS -13.53 4,604.47 1.00
SP 0.98 0.43 0.02 2.67 0.97 0.42 0.02 2.65
HS -3.19 1.30 0.01 0.04 -3.12 1.29 0.02 0.04
VIG 3.70 0.54 0.00 40.58 3.86 0.53 0.00 47.69
Intercept -26.13 1.80 0.00 -29.70 921.81 0.97 -14.19 1.56 0.00
†SU: sucker; NS: number of stalks; SH: stalk height; BP: bud prominence;SD: stalk diameter; CR: cracks; IL: internode length; LA: leaf architecture; FL: flowering; LH: leaf hairiness; PS: smut; SP: stalk pith; HS: hollow stalk; VIG: plant vigor; ‡p-value: probability values associated with the z statistic of Wald.
According to the results, the greater importance of the NS trait in the individual selection process in T1 is evident. In fact, in T1, the best sugarcane genotypes can be selected based on the trait number of stalks, keeping in mind that its direct effect on tons of cane per hectare is high magnitude (Espósito et al., 2012; Brasileiro et al., 2013; Silveira et al., 2015). Pedrozo et al. (2008) observed that plants with fewer than 6 stalks in the T1 phase exhibit low yields in the T2 phase. They recommended the selection of plants with more than 5 stalks for the initial phase. However, other traits should also be taken into consideration in the selection process, such as SH, SD, IL and BP, to ensure that the plants meet the needs of the productive sector.
Due to the increased adoption of mechanized planting, the size of the axial bud has come to be of great importance in the selection process of new clones. The great size of the axial bud causes bud losses and difficulties in the mechanized planting process and creates a need for a greater quantity of buds per linear meter to establish the crop (Figure 2). Although a logistic regression can be used to obtain a model for individual selection in the best families, the main objective of this study was to quantify the relative importance of each trait, which causes a breeder to select or eliminate a genotype by mass selection, as discussed above.
Because of the apparent low error rate, it is possible to efficiently calculate the probability of plant selection from the best families of a population during the T1 and T2 test phases based on regression coefficients estimated in logistic regression models for each respective phase. Therefore, breeding programs can standardize the individual selection process based on the most important criteria for breeders and can accomplish this individual assessment only in families with the highest genotypic means for TCH and TSH. In this study, plants with
probability values greater than 0.5 (pˆi>0.5) were
selected, but the selection intensity can also be adjusted by defining another selection limit.
In the T2 phase, the chance of an individual being selected increases 47 times for every additional unit on the scoring scale for VIG. The great importance of this variable is easily explained because plants with greater vigor are the most interesting for breeders because they usually have high SN, SH and SD, aside from being disease-free. A plant with a large SD has a 9 times greater chance of being selected than a plant with a small diameter. A plant considered tall has a nearly 5 times greater chance of being selected than a plant of low stature. Plants with a small bud are nearly 5 times more likely to be selected than plants with a large bud, and plants with no stalk pith have a nearly 3 times greater chance of being selected than plants with a stalk pith (Table 1).
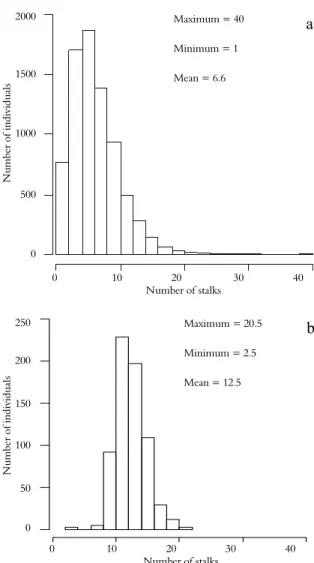
The importance of these agronomic traits was also subject to the influence of peculiarities inherent to T1 and T2. The NS, for example, was the trait of greatest importance in the mass selection applied in T1, yet it did not exhibit a significant effect in the model fitted to the selection practice in phase T2 (Table 1). This can be explained by the fact that the phase T2 population exhibited less variability in the number of stalk traits. The selection of genotypes with a large number of stalks in T1 results in less variability in NS after the first selection cycle, as seen in Figure 3.
Figure 1. Relative importance (RI) of agronomic traits in the mass selection process during phases T1 (a) and T2 (b) in the sugarcane genetic breeding program at the Universidade Federal
de Viçosa ( p ) 100
1 j j
ˆ / j ˆ (
RI ×
= β β
= ). The NS = number of
stalks, SH = stalk height, SD = stalk diameter, BP = bud prominence, CR = presence of cracks, SU = sucker, LA = leaf architecture, IL = internode length, SP = stalk pith, VIG = plant vigor, and HS = hollow stalk.
Because of the difficulty in visually identifying the most productive clones in phase T2, we recommend counting the number of stalks and weighing a sample of 10 to 20 stalks per plot to obtain the TCH and TSH estimates.
The TCH and TSH data should be analyzed using the REML/BLUP, and the relationship matrix of the clones can be used for evaluation if the families are well represented in T2. As discussed by Peternelli and Resende (2015), 25
plants represent 90% of the maximum effective size of the half-sib family. Selecting clones based on production capacity eases the reliance on the visual identification of the best genotypes. By selecting for TCH and/or TSH, it is possible to make visual selections with only the most productive clones. In addition to yield, it is necessary to evaluate secondary traits such as plant vigor, stalk pith, bud prominence, flowering intensity and the incidence of certain diseases. Using these selection criteria, the breeder will be able to more efficiently identify the best genotypes in a shorter period of time.
The logistic regression models fitted to the initial selection phases were efficient in predicting the individuals to be selected. In T1, 153 individuals exhibited a probability for selection above 0.5. The model for selection in T1 showed nearly 100% accuracy (Table 2). These results demonstrate the efficiency of logistic regression for determining the relative importance of each trait in breeder decision-making.
Figure 2. Images of a not very prominent bud (a), preferable in mechanized planting, and of a large bud (b), which is an undesirable trait in new cultivars.
a
Nu
mber
of ind
ivi
duals
2000
1500
1000
500
0
0 10 20 30 40 Number of stalks
Nu
mber of
indiv
id
u
als
250
200
150
100
50
0
0 10 20 30 40 Number of stalks
Figure 3. Histograms of the number of stalks per linear meter in the evaluated genotypes in the populations in phases T1 (a) and T2 (b) in the sugarcane genetic breeding program of the Universidade Federal de Viçosa (PMGCA/UFV).
In T2, 79 individuals reached the selection
threshold (pˆi >0.5). The accuracy capacity of the
model fitted to mass selection in T2 was approximately 95%, with 100% predictive capacity of the selection conditions (Table 2).
The explanatory variables used to establish the logistic model, consisting of traits usually analyzed during visual selection, are easily and quickly assessed. Furthermore, the possibility of using
continuous, binary and/or multicategorical traits
makes the application of logistic regression even more interesting in sugarcane breeding programs for selecting potential clones, in view of the importance of many of the qualitative traits. The results demonstrate the ability of logistic regression to produce the best decision using the same criteria used by professionals responsible for selection during phases T1 and T2 of sugarcane breeding programs.
To assist decision-making in selection or rejection of a determined genotype, a decision tree was proposed to select sugarcane genotypes in the T2 phase of the genetic breeding program. Decision trees constitute a powerful and widely used technique in classification problems (Breiman et al., 1984). This is an interesting tool that may be adopted for clone selection.
The rules for obtaining a decision tree were formulated with a view toward selecting clones with the greatest productivity potential and the smallest number of undesirable features. In this study, a decision tree was generated from the traits that exhibited the greatest importance in the visual selection process conducted in T2, together with the genotypic information on TCH and TSH production traits and the experience of the breeder in identifying the best clones (Figure 4).
According to the generated rules (Figure 4), the first step is the pre-selection of the best 10% of the clones for TCH and TSH. In the second step, all of the clones that are among the 10 best for TCH and TSH, r that exhibit vigor (VIG) greater than or equal to 3 and clones that were considered promising by the breeder during mass selection advance to the third test phase (T3). The third step consists of discarding clones that exhibit stalk piths or buds unsuited to mechanized cropping (Figure 4).
After pre-selecting the 66 clones with the greatest mean values for TCH and TSH, 90 clones were pre-selected and, according to the rule validation process, together with the response generated, 67 clones were selected.
Table 2. Classifications using logistic regression models with mass selection applied in T1 and T2 as a response.
Phase Mass selection Regression model Total AER† Select (1) Discard (0)
T1
Select (1) 133 41 174
0.80%
Discard (0) 20 7,525 7,545
Total 153 7,566 7,719
T2
Select (1) 79 34 113
5.10%
Discard (0) 0 546 546
Total 79 580 659
†AER = Apparent error rate in percentage or percentage of individuals classified incorrectly.
maximum = 20.5 minimum = 2.5
mean = 12.5 median = 12.2 standard deviation = 2.3 Maximum = 40
Minimum = 1
Mean = 6.6
a
Maximum = 20.5
Minimum = 2.5
Mean = 12.5
In selection carried out using the mass selection method, 113 clones advanced to the T3 phase; of these, only 27 were part of the 90 clones with the greatest mean values for TCH or TSH. Using the mass selection method, most of the selected genotypes showed low productive potential; consequently, greater genetic gains are expected through the use of a selection strategy via a decision tree (Figure 4).
Using the decision tree, genotypes with low yields or undesirable characteristics are discarded, allowing only the highest yielding genotypes and those near the desired idiotype to advance to the T3 phase. Therefore, this tool should be incorporated into the sugarcane selection process and applied to other species of propagated plants as well.
Figure 4. Decision tree for selection of genotypes during the T2 phase of the sugarcane genetic breeding program at the Universidade Federal de Viçosa (PMGCA/UFV).
The rules to be used in creating the decision tree may change depending on the climatic conditions in each crop year, the incidence of a specific disease at the experimental locations, and the aims and criteria considered most important for each genetic breeding program.
The application of a decision tree to sugarcane selection may be automated in the field. Consequently, decisions may be made in a more rapid and efficient manner, leaving the evaluation of secondary traits to only those genotypes with the greatest productive potential.
Conclusion
Based on a logistic regression, it was possible to evaluate the importance of agronomic traits in the selection and to predict the individuals most likely to be selected in the T1 and T2 phases. Furthermore, the use of a decision tree has great the potential in selection during the T2 phase of sugarcane breeding programs, aimed at simplifying the identification of the best genotypes.
The number of stalks, bud prominence and internode length traits were the most relevant during the selection carried out in T1. The plant vigor, stalk diameter and stalk height were the most important for selection in T2.
Acknowledgements
The authors are indebted to the Coordination of Improvement of Higher Education Personnel (CAPES) and the National Research Council (CNPq) for financial support.
References
Agresti, A. (2007). An introduction to categorical data analysis. New York, NY: John Wiley & Sons.
Akaike, H. (1974). A new look at the statistical model identification. IEEE Transaction on Automatic Control, 19(6), 716-723.
Atkin, F. C., Dieters, M. J., & Stringer, J. K. (2009). Impact of depth of pedigree and inclusion of historical data on the estimation of additive variance and breeding values in a sugarcane breeding program.
Theoretical and Applied Genetics, 119(3), 555-565. Barbosa, M. H. P., Resende, M. D. V., Bressiani, J. A.,
Silveira, L. C. I., & Peternelli, L. A. (2005). Selection of sugarcane families and parents by Reml/Blup. Crop Breeding and Applied Biotechnology, 5(4), 443-450. Brasileiro, B. P., Marinho, C. D., Costa, P. M. A., Cruz,
C. D., Peternelli, L. A., & Barbosa, M. H. P. (2015). Selection in sugarcane families with artificial neural networks. Crop Breeding and Applied Biotechnology,
15(2), 72-78.
Brasileiro, B. P., Peternelli, L. A., & Barbosa, M. H. P. (2013). Consistency of the results of path analysis among sugarcane experiments. Crop Breeding and Applied Biotechnology, 13(2), 113-119.
Breiman, L., Friedman, J. C., & Olshen, R. A. (1984).
Classification and Regression Trees. Boca Raton, FL: Chapman & Hall/CRC.
Espósito, D. P., Peternelli, L. A., Mendes, T. O. P., & Barbosa, M. H. P. (2012). Análise de trilha usando valores fenotípicos e genotípicos para componentes do rendimento na seleção de famílias de cana-de-açúcar.
Ciência Rural, 42(1), 38-44.
Oliveira, R. A., Daros, E., Bespalhok-Filho, J. C., Zambon, J. L. C., Ido, O. T., Weber, H., ... Zeni-Neto, H. (2008). Seleção de famílias de cana-de-açúcar via modelos mistos. Scientia Agraria, 9(3), 269-274. Oliveira, R. A., Daros, E., Resende, M. D. V.,
Bespalhok-Filho, J. C., Zambon, J. L. C., & Ruaro, L. (2013). Early selection in sugarcane family trials via BLUP and BLUPIS procedures. Acta Scientiarum. Agronomy, 35(4), 427-434.
Pedrozo, C. A., Barbosa, M. H. P., Resende, M. D. V., Peternelli, L. A., Costa, P. M. A., & Silva, F. L. (2008). Eficiência da seleção em fases iniciais do melhoramento da cana-de-açúcar. Revista Ceres, 55(1), 1-8.
Peternelli, L. A., Souza, E. F. M., Barbosa, H. H. P., & Carvalho, M. P. (2009). Delineamentos aumentados no melhoramento de plantas em condições de restrições de recursos. Ciência Rural, 39(9), 2425-2430. Peternelli, L. A., & Resende, M. D. V. (2015).
Experimental Designs for Next Generation Phenotyping. In R. Fritsche-Neto, & A. Borém (Ed.),
Phenomics: How Next-Generation Phenotyping is Revolutionizing Plant Breeding (p. 15-32). New York, NY: Springer.
R Development Core Team. (2015). R: A language and environment for statistical computing. R Foundation for Statistical Computing. Vienna, Austria.
Resende, M. D. V. (2002). Genética biométrica e estatística no melhoramento de plantas perenes. Brasília, DF: Embrapa Informação Tecnológica.
Resende, M. D. V. (2007). Software SELEGEN-REML/BLUP: sistema estatístico e seleção genética computadorizada via modelos lineares mistos. Colombo, PR: Embrapa Florestas.
Resende, M. D. V., & Barbosa, M. H. P. (2006). Selection via simulated Blup based on family genotypic effects in sugarcane. Pesquisa Agropecuária Brasileira, 41(3), 421-429.
Silveira, L. C. I., Brasileiro, B. P., Kist, V., Daros, E., Peternelli, L. A., & Barbosa, M. H. P. (2015). Selection strategy in families of energy cane based on biomass production and quality traits. Euphytica, 201(2), 1-13. Stringer, J. K., Cox, M. C., Atkin, F. C., Wei, X., &
Hogarth, D. M. (2011). Family Selection Improves the Efficiency and Effectiveness of Selecting Original Seedlings and Parents. Sugar Tech, 13(1), 36-41. Souza, E. F. M., Peternelli, L. A., & Barbosa, M. H. P.
(2006). Designs and model effects definitions in the initial stage of a plant breeding program. Pesquisa Agropecuária Brasileira, 41(3), 369-375.
Zhou, M. M., Collins, A., Kimbeng, C. A., Tew, T. L., Gravois, K. A., & Pontif, M. J. (2011). Artificial neural network models as a decision support tool for selection in sugarcane: a case study using seedling populations. Crop Science, 51(1), 21-31.
Zhou, M. M.; Kimbeng, C. A.; Tew, T. L.; Gravois, K. A.; Pontif, M. J.; Bischoff, K. P. (2014). Logistic regression models to aid selection in early stages of Sugarcane Breeding. Sugar Tech, 16(2), 150-156.
Received on July 5, 2015. Accepted on October 10, 2015.