ISSN 2179-8087 (online)
Original Article
Silviculture
Creative Commons License. All the contents of this journal, except where otherwise noted, is licensed under a Creative Commons Attribution License.
Soil Influences on Tree Species Distribution in a
Rupestrian Cerrado Area
Daniel Dantas
1, Maria José Souza
2, Arthur Vieira
3, Marcio Oliveira
3,
Israel Pereira
3, Evandro Machado
3, Claudio Marcio Souza
2, Wellington Rocha
21Programa de Pós-graduação em Engenharia Florestal, Universidade Federal de Lavras – UFLA, Lavras/MG, Brasil 2Departamento de Agronomia, Universidade Federal dos Vales do Jequitinhonha e Mucuri – UFVJM,
Diamantina/MG, Brasil
3Departamento de Engenharia Florestal, Universidade Federal dos Vales do Jequitinhonha e Mucuri – UFVJM, Diamantina/MG, Brasil
ABSTRACT
This study aimed to analyze relations between the distribution of tree species and variations in soil texture, fertility and organic matter levels in a rupestrian cerrado area located in Diamantina-MG. Individual trees with circumference at soil level (PC) ≥ 3 cm were sampled in 10 plots of 20x50m. Samples of surface soil (0.00-0.20 m of depth) were collected from each plot and analyzed for their chemical and physical properties. Through canonical correspondence analysis, Eremanthus incanus, Kielmeyera lathrophyton, Terminalia sp and Vochysia discolor show a stronger relation to higher potassium and remaining phosphorus levels; the species Xylopia sericea, Protium spruceanum and Protium heptaphyllum show a stronger relation to higher levels of organic matter and total cation exchange capacity; the species Roupala montana, Qualea grandiflora, and Erythroxylum suberosum grew uniformly in all plots. There is relation between species distribution and chemical and physical soil variables in the area.
1. INTRODUCTION
The Cerrado has one of the greatest biological diversities on the planet. According to Deus (2011), this biome has an endemic flora of 40%, meaning this percentage of species is unique to Brazilian savannas. Its phytophysiognomy shows several endangered species as well as some of potential medicinal use. Its estimated richness includes over 6,000 tree species and 800 bird species, in addition to a wide variety of fish and other life forms. Therefore, the Cerrado, in addition to the Atlantic Forest, is considered one of the world’s hotspots, being one of the planet’s richest but also, most threatened biomes (Mittermeier et al., 2011).
With a tropical savanna type formation, the Cerrado covers about 2 million km2 in Central Brazil,
approximately 24% of the national territory (MMA, 2015). The most common physiognomy is an open formation of low trees and shrubs coexisting with a grassy ground layer. There are, however, several other physiognomies, ranging from clean fields to tree formations. In the Espinhaço Chain, formations of rupestrian cerrado are the dominant vegetation cover, growing on boulders or rocks, in shallow or stony soils of recent origin, or in sandy deposits (Kamino et al., 2008). The Diamantina municipality is located in the region of Espinhaço Meridional with predominance of rocky and sandy soils (Abreu et al., 2005). Some authors (Giulietti et al., 2009; Carmo & Jacobi, 2013) cite rare species distributed in these environments. Thus, it is expected that the edaphic and climatic characteristics in these areas of the Cerrado biome influence tree distribution and consequently, the floristic pattern.
A series of studies has already been carried out to explain the relationships between environmental factors and vegetation, and the results have been diverse and sometimes divergent. Goodland & Pollard (1973) emphasized that soil fertility may not necessarily be the cause of the physiognomic gradient in a closed environment. Silva et al. (2015), when studying the relationship between soil and vegetation in an area of the Cerrado biome located in the triple border between Minas Gerais, Goiás and Bahia, concluded that fine sand, clay and aluminum are responsible for 93.7% of variability in the relationship between soils and phytophysiognomies. Terra et al. (2015) assessed the correlations of vegetation aspects with top-soil-climatic
variables in a forest remnant in Bocaina de Minas, Serra da Mantiqueira, MG, and concluded that soil fertility was the variable that most explained species distribution variability.
Knowing how vegetation variables behave throughout a biome has direct implications for conservation initiatives and recovery of degraded areas. Anthropic pressures in the Cerrado have been increasing, which makes understanding environmental relationships and plant population distribution even more important to develop conservation methods.
The goal of the present study was to investigate the physical and chemical soil characteristics that most influence the population distribution of species with greater relative density in a vegetation section of cerrado rupestre in the Diamantina municipality – MG. A canonical correspondence analysis (CCA) was performed to identify species that may be used in environments presenting restrictive conditions. Studies of this nature may assist in developing forestry and environmental activities, as well as in recovering degraded areas.
2. MATERIAL AND METHODS
The sampled area is located at Sítio Santa Helena, 5 km from Diamantina, a municipality located in the Southern Espinhaço region. Its altitude is 1,149 m, latitude 18° 17’S, and longitude 43° 34’W. The climate of the region, according to the Köppen classification, is Cwb: its temperate is humid, with dry winter and summer rains. The predominant formations are rupestrian and cerrado rock, the latter of which corresponds to the environment studied. Soils are classified as neossolo quartzarênico órtico típico according to the Brazilian Soil Classification System - SiBCS (EMBRAPA, 2013). The vegetation of the area is in a healthy state in terms of conservation and natural regeneration.
always intentionally measuring above any morphological adaptation that the plant presented at this point. As an inclusion criteria, individuals with stem circumference equal to or greater than 3.0 cm were sampled. Species and family name were recorded for each individual sampled. Individual identification was carried out in the field. Unidentified individuals had their botanical material collected to identify them later on using specialized literature (Silva et al., 2005) and by comparison with known species, studied and registered in the samples of the Dendrological Herbarium Jeanini Felfili (HDJF) of the Federal University of the Jequitinhonha and Mucuri Valleys. Species of the Velloziaceae family were excluded for the standardization of the analysis, since only woody species were considered.
Six simple soil samples were collected, from a depth of 0 to 20 cm, forming a composite sample for each plot (Ribeiro et al., 1999). The physicochemical analysis was performed after the samples were air dried, homogenized and sieved in a 2 mm mesh.
The phytosociologic parameters assessed in structure analysis were: number of individuals (NI), absolute density (DA), relative density (DR), absolute frequency (FA), relative frequency (FR), and plot unit in which a species was verified (UP). Martins (1993) cited the formulas used for the calculation.
For the granulometric analysis of the soils (coarse sand, fine sand, silt and clay fractions), the EMBRAPA methodology was used (EMBRAPA, 2011). Water pH was measured using 1: 2.5 (v/v) soil proportions: solution. The total organic carbon content was determined by the Walkley-Black method (Walkley & Black, 1934) and, subsequently, the organic matter content was determined by multiplying the values of total organic carbon by the conversion factor of 1.724 (Walkley & Black, 1934). The exchangeable Ca2+, Mg2+ and Al3+
cations were extracted by KCl 1.0 mol L-1 solution
and the Ca2+ and Mg2+ contents were determined by
titration with EDTA 0.01 molc L-1 and the Al3+ contents
by titration with NaOH 0.025 mol L-1 (Silva et al.,
2009). The P, K, Zn, Fe, Cu were extracted by solution Mehlich-1 and B extracted in hot water, the contents determined by spectrophotometry (Silva et al., 2009). The potential acidity (H+Al) was extracted by 0.5 mol L-1 in a calcium acetate solution at pH 7.0, and
determined by titration (Silva et al., 2009). The sum of bases (SB), the effective cation exchange capacity (t) - CTC, aluminum saturation (m), and base saturation (V) were calculated (Alvarez et al., 1999).
Initially, the environmental matrix included 20 variables. This data set was reduced with the
principal component analysis (MCA) (Regazzi, 2001), because fewer variables could explain the variability of species occurrence better. Transforming the original variable set into a new one that maintains maximum variability, achieves the reduction. Thus, quantitative data obtained from soil analysis, which best explained set variability according to the MCA, was related to the 10 plots by means of an order generated by the canonical correspondence analysis (CCA). This analysis detects the measured environmental variable that can supposedly better explain variation patterns found in each plot’s data (Cruz Ruggiero et al., 2002; Cruz et al., 2012). All processing was performed with R software (R Core Team, 2014), Vegan package (Oksanen et al., 2013).
Pearson correlation coefficients were calculated for the main variables identified by principal component analysis, and the three axes of ordering the canonical correspondence analysis to verify the relationships between them.
3. RESULTS AND DISCUSSION
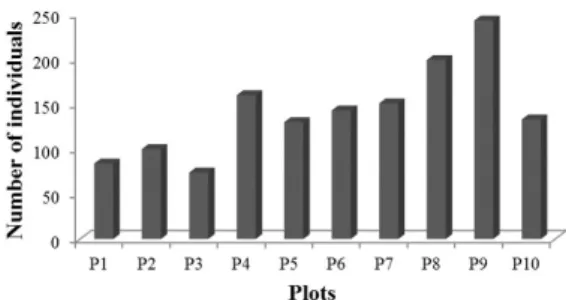
A total of 1417 individuals were recorded and distributed in ninety species and thirty families, representing a density of 1417 ind/ha. The number of individuals in each plot ranged from 74 to 243 in the P3 and P9 plots, respectively (Figure 1).
Families with the greatest diversity (number of species/family/ha) were Fabaceae (9), Myrtaceae (8), Asteraceae (7), Melastomataceae (7), Lauraceae (6) and Rubiaceae representing 46.7% of local richness, similar to results from other studies (Oliveira et al., 2015;
Torres et al., 2017). Therefore, most of the local diversity is concentrated in a few families.
The richness and abundance of the Fabaceae family in the cerrado has been verified in other studies (Carvalho & Marques-Alves, 2008; Lima et al., 2015). These studies consider this family to be a predominant
one in the savanna flora, given its high density in all cerrado phytophysiognomies. Cordeiro (2000) attributed this behavior to the nodulation capacity of its species, which promotes greater adaptability in regions with low nitrogen content. This is an advantage over other species, mainly in the Cerrado, where the soil is poor in nutrients.
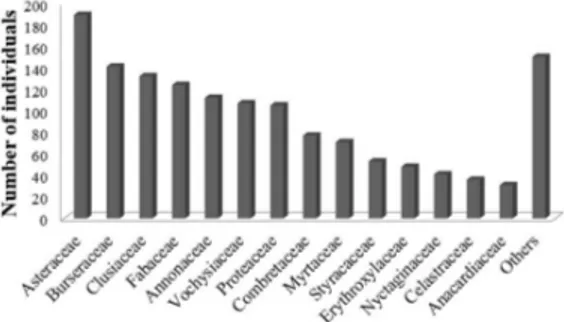
The greatest abundance was concentrated in the Asteraceae (189), Burseraceae (141), Clusiaceae (132), Fabaceae (124), Vochysiaceae (107) and Protoaceae (105) families (Figure 2). These seven families together held 64.22% of registered individuals, while the other 23 families accounted for the remaining 35.78%, evidencing a lower abundance of individuals of these families.
The Asteraceae family was mainly characterized by the high number of individuals sampled from
Eremanthus incanus (147) species (Table 1). Popularly known as candeia. Eremanthus incanus, together with
Figure 2. Number of individuals per family in a rupestrian cerrado area in Diamantina, MG.
Table 1. Species of higher occurrence in a rupestrian cerrado area in Diamantina, MG.
Species Families NI DA DR% UP FA% FR%
Eremanthus incanus Asteraceae 147 1470 10.37 10 100 3.58
Kielmeyera lathrophyton Clusiaceae 96 960 6.77 10 100 3.58
Xylopia sericea Annonaceae 80 800 5.65 4 40 1.43
Terminalia sp Combretaceae 76 760 5.36 9 90 3.23
Protium spruceanum Burseraceae 75 750 5.29 3 30 1.08
Protium heptaphyllum Burseraceae 70 700 4.94 4 40 2.15
Roupala montana Proteaceae 69 690 4.87 9 90 3.23
Qualea grandiflora Vochysiaceae 56 560 3.95 9 90 3.23
Erythroxylum suberosum Erythroxylaceae 48 480 3.39 9 90 3.23
Vochysia discolor Vochysiaceae 45 450 3.18 7 70 2.51
Myrcia guianensis Myrtaceae 38 380 2.68 8 80 2.87
Roupala sp. Proteaceae 36 360 2.54 4 40 1.43
Plenckia populnea Celastraceae 32 320 2.26 8 80 2.87
Bowdichia virgilioides Fabaceae Faboideae 31 310 2.19 7 70 2.51
Tapirira guianensis Anacardiaceae 31 310 2.19 4 40 1.43
Guapira noxia Nyctaginaceae 30 300 2.12 7 70 2.51
Styrax oblongus Styracaceae 30 300 2.12 2 20 0.72
Dalbergia miscolobium Fabaceae Faboideae 28 280 1.98 8 80 2.87
Platymiscium sp. Fabaceae Faboideae 28 280 1.98 6 60 2.15
Piptocarpha rotundifolia Asteraceae 27 270 1.91 3 30 1.08
Xylopia aromatica Annonaceae 23 230 1.62 2 20 0.72
Clusia criuva Clusiaceae 21 210 1.48 5 50 1.79
Copaifera langsdorffii Fabaceae Caesalpinioideae 21 210 1.48 5 50 1.79
Pera sp. Peraceae 18 180 1.27 4 40 1.43
Styrax camporum Styracaceae 15 150 1.06 5 50 1.79
Calophyllum brasiliense Clusiaceae 15 150 1.06 3 30 1.08
Other species - 231 2310 16.30 - - 43.73
Total - 1417 14170 100 - - 100.00
Eremanthus erythropappus, it is the most important candeia species in Minas Gerais (Scolforo et al., 2008). Candeia is a native species and belongs to the ecological group of pioneers, being considered a precursor in field invasion (Longhi et al., 2009). It can easily and quickly develop in inhospitable environments, with shallow and sandy soils, resulting in the formation of stands and occupation of the area. The species is an important option for the recovery of degraded areas, frequent in the Southern Espinhaço region (Scolforo et al., 2008). The pedological variables, through main component analysis, were reduced from twenty to eight. The variables
that best explain the variation of the distribution in the plots were P-rem, organic matter, T, V, Mg, m, SB and K. The canonical correspondence order analysis (COA) explained a large part of the total variation in the first three axes, 42.48; 16.11 and 13.93%, presenting a total of 72.52%. This value can be considered high and suggests a causal relationship between the vegetation and chemical and physical soil attributes in the area. Several factors can influence species distribution, such as microclimate, relief, water availability, etc. However, this study only assessed the influence of edaphic factors.
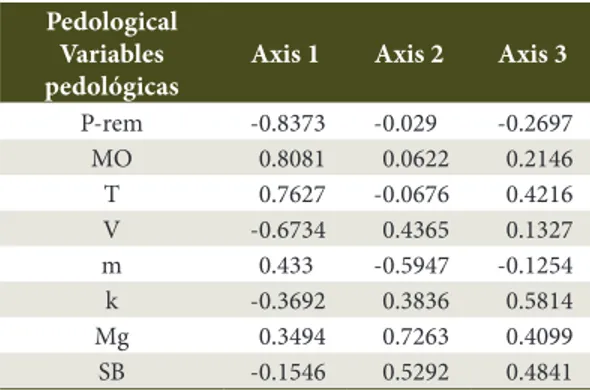
The variables had stronger correlations (r > 0.6) in the CCA, at a significance level of 5% with axis 1 (Table 2); in a descending order, P-rem (r = 0.837), organic matter (r = 0.808), T (r = 0.763), and V (r = 0.673). With the second axis, the strongest correlations (r > 0.3) in a descending order were Mg (r = 0.726), m (r = 0.595), SB (r = 0.529), V (r = 0.436), and k (r = 0.384).
In the ordering diagram produced by the CCA (Figure 3), numbers represent the plots, and vectors represent the environmental variables showing changing direction for these variables in the ordering space (Ter Braak, 1987).
Parcels 1, 2, 3, 4 and 5, grouped in the northeastern quadrant of the diagram (Figure 3), are positively
Table 2. Pearson correlation coefficients between the pedological variables and the three ordering axes of canonical correspondence analysis in a rupestrian cerrado gradient in Diamantina-MG.
Pedological Variables pedológicas
Axis 1 Axis 2 Axis 3
P-rem -0.8373 -0.029 -0.2697
MO 0.8081 0.0622 0.2146
T 0.7627 -0.0676 0.4216
V -0.6734 0.4365 0.1327
m 0.433 -0.5947 -0.1254
k -0.3692 0.3836 0.5814
Mg 0.3494 0.7263 0.4099
SB -0.1546 0.5292 0.4841
related to base saturation (V), potassium (K), sum of bases (SB) and remaining phosphorus (P-rem), which were the variables with the highest values. According to the Fifth Approach (Ribeiro et al., 1999), there was no difference between these plots in the classification of V and SB contents. The values considered to be low for V (less than 5%) and SB (lower than 0.33 cmolc/dm3) were verified, corroborating the
soil dystrophy described for cerrado soils (Haridasan, 2008) and low natural fertility.
Regarding potassium, there was a variation from 26 to 93 mg/dm3. Plots 1 to 5 had medium
(41 to 70 mg/dm3) to good (71 to 120 mg/dm3) levels,
whereas in plots 6 to 10, low K levels were observed (16 to 40 mg/dm3). There is an expressive relationship
between lowest K levels and highest T levels. As already pointed out by Camargos et al. (2008), K, T and soil texture are directly related. The level of exchangeable potassium suitable for plants is higher in clayey soils with higher T than in sandy soils with low T, as in the case of plots 1 to 5.
The remaining phosphorus values obtained in this study presented a wide range, varying from 15.5 to 40.2 mg/L. This shows that, even at small distances, soils have different potentials for phosphorus fixation. A negative relationship between aluminum saturation and P-rem and K levels was observed. Goodland & Pollard (1973) and Gianotti et al. (2013) also observed this in their studies: they suggested that aluminum’s main effect on soil would be competing with exchangeable bases via the same exchange sites in the soil colloidal complex, further impoverishing it. The organic matter and the cation exchange capacity at pH 7.0 (T) presented a great variation between plots (Table 3) and a positive relation, which can be attributed to the fact that organic matter is most responsible for cation retention in Brazilian soils, especially in sandier soils (Ribeiro et al., 1999).
The significant variation in organic matter content (from 2.43 to 8.96) may be associated with the vegetation cover. In the plots with higher individual densities and, consequently, greater litter deposition, there is a tendency to increase the organic matter content and, therefore, favor the development of existing species or the emergence of new ones. According to Silva et al. (2015), the accumulation capacity of organic matter is
one of the main processes of differentiation between the studied environments, which, together with the texture, directly influence the pattern of vegetation cover present in the area.
In plots 1 to 5, there was a great predominance
of Eremanthus incanus, Kielmeyera latrofhyton,
Terminalia sp. and Vochysia discolor. These correlated to the highest K and P-rem levels, and to the lowest organic matter and CTC contents. In a study carried out in Mogi-Guaçu, Batista & Couto (1990), a correlation between potassium content and vegetation variables was also observed, where K was the most influential edaphic variable in the development of fifteen of the most important native species in the area. The species
Xylopia sericea, Protium spruceanum and Protium heptaphyllum were exclusively predominant in the plots located on the right side of axis 1, thus demonstrating tolerance to higher aluminum saturation levels and a preference for sites with higher organic matter and T levels.
However, the Roupala montana, Qualea grandiflora
and Erythroxylum suberosum species did not show any distribution related to soil conditions. Instead, they varied uniformly in all plots. Ratter et al. (1996, 2003) highlighted Q. grandiflora as an important species with wide distribution in the cerrado, present in 85% of the studies evaluated by these authors. This can be attributed to the fact that the species is an aluminum accumulator, which gives it a competitive advantage in the acidic soils of this biome (Felfili et al., 1993).
7/9
So
il I
nfl
uen
ces o
n T
re
e S
pe
cies…
m
bien
te 2018; 25(4): e20170605
Plot Ca2+
H2O mg dm-3 cmol
cdm
-3 % dagkg-1 mgL-1 mg dm-3 g kg-1
1 4.5 1.6 30 0.0 0.05 1.10 6.1 0.13 1.23 1.23 2.1 89.4 2.56 40.2 3.17 116 0.09 330 530 40 100 2 4.3 1.6 41 0.0 0.06 1.30 4.9 0.16 1.46 1.46 3.2 89.0 2.56 38.2 2.08 88.9 0.12 240 600 30 130 3 4.6 1.6 93 0.0 0.09 1.40 6.6 0.33 1.73 1.73 4.8 80.9 2.81 38.9 3.42 74.2 0.01 270 560 40 130 4 4.5 1.7 41 0.0 0.06 1.40 5.9 0.16 1.56 6.06 2.6 89.7 2.43 38.2 1.38 102.7 0.00 260 610 00 130 v 4.3 2.3 44 0.0 0.08 1.60 7.1 0.19 1.79 7.29 2.6 89.4 3.20 32.3 1.07 87.4 0.02 310 520 70 100 6 4.5 2.5 48 0.0 0.06 2.40 12.2 0.18 2.58 12.4 1.5 93.0 6.08 25.4 1.13 81.7 0.24 270 540 20 170 7 4.5 1.8 37.5 0.0 0.06 1.95 8.9 0.16 2.11 9.06 1.7 92.5 4.42 30.5 1.29 104.5 0.05 230 600 45 120 8 4.8 2.3 29 0.0 0.06 1.35 7.85 0.13 1.48 7.98 1.65 91.4 4.67 29.3 1.60 116.2 0.00 260 570 55 110 9 4.6 2.5 26 0.0 0.07 2.15 12.6 0.14 2.29 12.7 1.15 93.5 6.31 23.3 1.52 96.4 0.00 220 510 155 110 10 4.6 1.8 56.5 0.0 0.11 2.25 15.2 0.26 2.51 15.5 1.9 88.3 8.96 15.5 1.44 329.6 0.05 200 550 70 180
4. CONCLUSION
The differences in the distribution and abundance of the species throughout the studied section are related to variations in chemical fertility and soil acidity.
The species observed showed good adaptation to environments with restrictive conditions, such as high acidity and low fertility, and were found to be important alternatives for use in areas with conditions similar to those studied in this research.
ACKNOWLEDGEMENTS
À Fundação de Amparo à Pesquisa do Estado de Minas Gerais – FAPEMIG, pelo apoio financeiro.
SUBMISSION STATUS
Received: 8 oct., 2017 Accepted: 26 oct., 2017
CORRESPONDENCE TO
Daniel Dantas
Departamento de Ciências Florestais,
Universidade Federal de Lavras -UFLA, Campus Universitário, CP 3037, CEP 37200-000, Lavras, MG, Brasil
e-mail: [email protected]
FINANCIAL SUPPORT
Fundação de Amparo à Pesquisa do Estado de Minas Gerais – FAPEMIG.
REFERENCES
Abreu PAA, Silva AC, Pedreira LCVSF. Serra do Espinhaço Meridional, paisagens e ambientes. Belo Horizonte: O Lutador; 2005.
Alvarez VVH, Novais RF, Barros NF, Cantarutti RB, Lopes AS. Interpretação dos resultados das análises de solos. In: Ribeiro AC, Guimarães PTG, Alvarez VAV, editor. Recomendações para o uso de corretivos e fertilizantes em Minas Gerais. Viçosa: CFSEMG; 1999. p.25-32
Batista EA, Couto HTZ. Influência de fatores químicos e físicos do solo sobre o desenvolvimento da vegetação de Cerrado na Reserva Biológica de Moji-Guaçu, SP. Revista do Instituto Florestal 1990; 2: 69-86.
Camargos VL, Silva AF, Meira JAA No, Martins SV. Influência de fatores edáficos sobre variações florísticas na Floresta Estacional Semidecídua no entorno da Lagoa Carioca, Parque Estadual do Rio Doce, MG, Brasil. Acta Botanica Brasílica 2008; 22(1): 75-84. http://dx.doi. org/10.1590/S0102-33062008000100010.
Carmo FF, Jacobi CM. A vegetação de canga no Quadrilátero Ferrífero, Minas Gerais: caracterização e contexto fitogeográfico. Rodriguésia 2013; 64(3): 527-541. http:// dx.doi.org/10.1590/S2175-78602013000300005. Carvalho AR, Marques-Alves S. Diversidade e índice sucessional de uma vegetação de cerrado sensu stricto na Universidade Estadual de Goiás-UEG, campus de Anápolis. Revista Árvore 2008; 32(1): 81-90. http://dx.doi. org/10.1590/S0100-67622008000100010.
Carvalho DA, Oliveira AT Fo, Vilela EA, Curi N, Van Den Berg E, Fontes MAL et al. Distribuição de espécies arbóreo-arbustivas ao longo de um gradiente de solos e topografia em um trecho de floresta ripária do rio São Francisco em Três Marias, MG, Brasil. Brazilian Journal of Botany 2005; 28(2): 329-345. http://dx.doi.org/10.1590/ S0100-84042005000200013.
Cordeiro L. Fixação de nitrogênio em leguminosas ocorrentes no cerrado. In: Klein AL, editor. Eugen Warming e o Cerrado brasileiro: um século depois. São Paulo: Universidade Estadual de São Paulo; 2000. Cruz CD, Regazzi AJ, Carneiro PCS. Modelos biométricos aplicados ao melhoramento genético. 2. ed. Viçosa: UFV; 2012. Cruz Ruggiero PG, Batalha MA, Pivello VR, Meirelles ST. Soil-vegetation relationships in cerrado (Brazilian savanna) and semideciduous forest, Southeastern Brazil. Plant Ecology 2002; 160(1): 1-16. http://dx.doi. org/10.1023/A:1015819219386.
Deus MJ. Guia de campo: vegetação do Cerrado 500 espécies. Brasília: MMA/SBF; 2011.
Empresa Brasileira de Pesquisa Agropecuária – EMBRAPA. Manual de métodos de análise de solo. 2. ed. Rio de Janeiro: EMBRAPA; 2011.
Empresa Brasileira de Pesquisa Agropecuária – EMBRAPA. Sistema brasileiro de classificação de solos. 3. ed. Brasília: EMBRAPA; 2013.
Felfili JM, Silva MC Jr, Rezende AV, Machado JWB, Walter BMT, Silva PEN et al. Análise comparativa da florística e fitossociologia da vegetação arbórea do cerrado sensu stricto na Chapada Pratinha, DF-Brasil. Acta Botanica Brasílica 1993; 6(2): 27-46. http://dx.doi.org/10.1590/ S0102-33061992000200003.
Giulietti AM, Rapini A, Andrade MJG, Queiroz LP, Silva JMC. Plantas raras do Brasil. Belo Horizonte: Conservation International; 2009.
Goodland R, Pollard R. The Brazilian cerrado vegetation: a fertility gradient. Journal of Ecology 1973; 61(1): 219-224. http://dx.doi.org/10.2307/2258929.
Haridasan M. Nutritional adaptations of native plants of the cerrado biome in acid soils. Brazilian Journal of Plant Physiology 2008; 20(3): 183-195. http://dx.doi.org/10.1590/ S1677-04202008000300003.
Kamino LHY, Oliveira-Filho AT, Stehmann JR. Relações florísticas entre as fitofisionomias florestais da Cadeia do Espinhaço, Brasil. Megadiversidade 2008; 4: 39-49. Lima RAF, Rando JG, Barreto KD. Composição e diversidade no cerrado do leste de Mato Grosso do Sul, Brasil. Revista Árvore 2015; 39(1): 9-24. http://dx.doi. org/10.1590/0100-67622015000100002.
Longhi P, Souza A, Garcia R, Pioveza V. Estudo de caso do processo de extração do óleo essencial da madeira de Candeia no sul de Minas Gerais. Floresta 2009; 39(3): 555-570. http://dx.doi.org/10.5380/rf.v39i3.15355. Martins FR. Estrutura de uma floresta mesófila. 2. ed. Campinas: UNICAMP; 1993.
Ministério do Meio Ambiente – MMA. Mapeamento do uso e cobertura do cerrado: Projeto TerraClass Cerrado 2013. Brasília: MMA; 2015.
Mittermeier RA, Turner WR, Larsen FW, Brooks TM, Gascon C. Global biodiversity conservation: the critical role of hotspots. In: Zachos FE, Habel JC, editors. Biodiversity hotspots. Berlin: Springer; 2011. http://dx.doi. org/10.1007/978-3-642-20992-5_1.
Mueller-Dombois D, Ellenberg H. Aims and methods of vegetation ecology. New York: Wiley; 1974.
Oksanen J, Blanchet FG, Kindt R, Legendre P, Minchin PR, O’Hara RB et al. Vegan: Community Ecology Package. R package version 2.0-10 [online]. Vienna: CRAN; 2013 [cited 2015 Apr 02]. Available from: http://CRAN.R-project.org/package=vegan
Oliveira CP, Francelino MR, Cysneiros VC, Andrade FC, Booth MC. Composição florística e estrutura de um cerrado sensu stricto no oeste da Bahia. Cerne 2015; 21(4): 545-552. http://dx.doi.org/10.1590/01047760201 521041722.
R Core Team. R: A language and environment for statistical computing [online]. Vienna: R Foundation for Statistical Computing; 2014 [cited 2015 Apr 02]. Available from: http://www.R-project.org/
Ratter JA, Bridgewater S, Atkinson R, Ribeiro JF. Analysis of the floristic composition of the brasilian cerrado vegetation II: comparison of the woody vegetation of 98
areas. Edinburgh Journal of Botany 1996; 53(02): 153-180. http://dx.doi.org/10.1017/S0960428600002821. Ratter JA, Bridgewater S, Ribeiro JF. Analysis of the floristic composition of the Brazilian cerrado vegetation iii: comparision of the woody vegetation of 376 areas. Edinburgh Journal of Botany 2003; 60(1): 57-109. Regazzi AJ. INF 766 - Análise multivariada. Viçosa: Universidade Federal de Viçosa; 2001.
Ribeiro AC, Guimaraes PTG, Alvarez V VH. Recomendações para o uso de corretivos e fertilizantes em Minas Gerais – 5ª Aproximação. Viçosa: CFSEMG; 1999.
Scolforo JR, Oliveira AD, Silva CPC, Andrade IS, Camolesi JF, Borges LFR et al. O manejo da candeia nativa. Lavras: UFLA; 2008.
Silva FC, Eira PA, Raij B van, Silva CA, Abreu CA, Gianello C et al. Métodos de análises químicas para avaliação da fertilidade do solo. In: Silva FC, editor. Manual de análises químicas de solos, plantas e fertilizantes. Brasília: EMBRAPA; 2009. p. 107-189.
Silva MC Jr. 100 árvores do cerrado: manual de campo. Brasília: Rede de Sementes do Cerrado; 2005.
Silva RBM, Francelino MR, Moura PA, Moura TA, Pereira MG, Oliveira CP. Relação solo/vegetação em ambiente de cerrado sobre influência do grupo Urucuia. Ciência Florestal 2015; 25(2): 363-373. http://dx.doi. org/10.5902/1980509818455.
Souza JS, Espírito-Santo FDB, Fontes MAL, Oliveira-Filho AT, Botezelli L. Análise das variações florísticas e estruturais da comunidade arbórea de um fragmento de floresta semidecídua às margens do rio Capivari, Lavras-MG. Revista Árvore 2003; 27(2): 185-206. http://dx.doi. org/10.1590/S0100-67622003000200009.
Ter Braak CJF. The analysis of vegetation environment relationships by canonical correspondence analysis. Vegetatio 1987; 69(1-3): 69-77. http://dx.doi.org/10.1007/ BF00038688.
Terra MCNS, Mello JM, Mello CRM, Santos RM, Nunes ACR, Raimundo MR. Influência topo-edafo-climática na vegetação de um fragmento de Mata Atlântica na Serra da Mantiqueira, MG. Ambiente & Água 2015; 10: 928-942. http://dx.doi.org/10.4136/1980-993X.
Torres DM, Fontes MAL, Samsonas HP. Relações solo-vegetação na estruturação de comunidades de cerrado sensu stricto no sul de Minas Gerais, Brasil. Rodriguésia 2017; 68(1): 115-128. http://dx.doi.org/10.1590/2175-7860201768121.