Repositório ISCTE-IUL
Deposited in Repositório ISCTE-IUL:
2018-12-10Deposited version:
Post-printPeer-review status of attached file:
Peer-reviewedCitation for published item:
Antunes, A. L., Cardoso, E. & Barateiro, J. (2018). Adding value to sensor data of civil engineering structures: automatic outlier detection. In 1st Workshop on Machine Learning, Intelligent Systems and Statistical Analysis for Pattern Recognition in Real-life Scenarios, ML-ISAPR 2018. Zakynthos
Further information on publisher's website:
--Publisher's copyright statement:
This is the peer reviewed version of the following article: Antunes, A. L., Cardoso, E. & Barateiro, J. (2018). Adding value to sensor data of civil engineering structures: automatic outlier detection. In 1st Workshop on Machine Learning, Intelligent Systems and Statistical Analysis for Pattern Recognition in Real-life Scenarios, ML-ISAPR 2018. Zakynthos. This article may be used for non-commercial
purposes in accordance with the Publisher's Terms and Conditions for self-archiving.
Use policy
Creative Commons CC BY 4.0
The full-text may be used and/or reproduced, and given to third parties in any format or medium, without prior permission or charge, for personal research or study, educational, or not-for-profit purposes provided that:
• a full bibliographic reference is made to the original source • a link is made to the metadata record in the Repository • the full-text is not changed in any way
The full-text must not be sold in any format or medium without the formal permission of the copyright holders.
Serviços de Informação e Documentação, Instituto Universitário de Lisboa (ISCTE-IUL) Av. das Forças Armadas, Edifício II, 1649-026 Lisboa Portugal
Phone: +(351) 217 903 024 | e-mail: [email protected] https://repositorio.iscte-iul.pt
Adding value to sensor data of civil engineering
structures: Automatic outlier detection
Ant´onio Lorv˜ao Antunes
ISCTE- Instituto Universit´ario de Lisboaand LNEC- National Laboratory for Civil Engineering
Lisbon, Portugal antonio [email protected]
Elsa Cardoso
ISCTE- Instituto Universit´ario de Lisboa and INESC-ID
Lisbon, Portugal [email protected]
Jos´e Barateiro
LNEC- National Laboratory for Civil Engineering
and INESC-ID Lisbon, Portugal [email protected]
Abstract—This paper discusses the problem of outlier detection in datasets generated by sensors installed in large civil engi-neering structures. Since outlier detection can be implemented after the acquisition process, it is fully independent of particular acquisition processes as well as it scales to new or updated sensors. It shows a method of using machine learning tech-niques to implement an automatic outlier detection procedure, demonstrating and evaluating the results in a real environ-ment, following the Design Science Research Methodology. The proposed approach makes use of Manual Acquisition System measurements and combine them with a clustering algorithm (DBSCAN) and baseline methods (Multiple Linear Regression and thresholds based on standard deviation) to create a method that is able to identify and remove most of the outliers in the datasets used for demonstration and evaluation. This automatic procedure improves data quality having a direct impact on the decision processes with regard to structural safety.
Index Terms—outlier detection, sensor data, machine learning, data mining
I. INTRODUCTION
The safety control of large civil engineering structures, like dams and bridges, is key for controlling risks that may cause environmental, human and economic disasters. In order to manage these risks and act in a timely manner, these structures are monitored by different types of sensors that provide critical information for experts to check and ensure their structural safety. The structural safety assessment uses numeric and statistical models based on data collected by the monitoring system installed at each structure. As a consequence, the correct interpretation of the structural safety of each structure depends on the quality of the data collected. Therefore, it is essential to detect and remove noise and outliers from the data acquisition process. Failing to identify and remove these outliers may lead to bad evaluations about the current safety state of a structure [1].
The way data is gathered, transformed, visualized and used to attain knowledge about each structure is of most importance to structural engineers, and it is how structural safety is con-trolled. Due to the number of sensors, acquisition frequency, variety and volume, the analysis of sensor data can be treated as a Big Data scenario, where manual outlier detection would be highly time-consuming and an error-prone process. Thus,
it is desirable to find a reliable way to automatize the outlier detection on data produced by such acquisition systems.
This paper focuses on the problem of automatic outlier detection for data acquired by sensors installed on large civil engineering structures, based on real cases in Portuguese dams. In fact, by law the data must be acquired and stored by dam owners, complying with mandatory observation plans1
[2]. Thus, this paper does not focus on costs related to the acquisition process, but on the value that can be added to this data through automatic outlier detection based on machine learning techniques.
Indeed, the quality of this type of data is vital to ensure the safety control of critical civil engineering structures [3]. Figure 1 shows the data lifecycle presented in Ref. [3] that includes several steps that can impact quality of dam data.
Fig. 1. Data lifecycle in dams’ sensor data [3]
This paper focuses on the Processing & Data storage step of the data lifecycle, which is the step where data quality
1An observation plan establishes the set of sensors that must be installed,
improvements can be centrally implemented, independently of the instrumentation, technologies and procedures adopted at each specific dam. Note that the acquisition process runs locally at each facility, using a variety of instrumentation, procedures, methods and technologies. Also, since all decision processes occur after the Processing & Data storage step, data quality improvements at this step directly affect the quality of all decisions based on this type of data.
The research reported in this paper aims to develop a method for automatic outlier detection in data from the continuous monitoring of dams, applying Machine Learning (ML) tech-niques, following the Design Science Research Methodology (DSRM) [4]. Overall, we intend to study the following re-search question:
RQ. Can we find a method using ML techniques that detects outliers in sensor data of civil engi-neering structures that performs better than baseline methods?
The remainder of this paper is organized as follows. Section 2 presents relevant related work, followed by an overview of the case study in section 3. The Design & Development of the proposed solution is presented in section 4, demonstrated in section 5 and evaluated in section 6. Finally, section 7 shows the main conclusions of this work.
II. RELATEDWORK
Outlier detection is part of the data preparation stage of CRISP-DM [5] [6] and is used to detect anomalous records in datasets. It uses a set of techniques to detect failures and behavior deviations to prevent further consequences (a small error may escalate into an enormous problem in the future) [7].
In the particular case of structural engineering, the creation of statistical and predictive models for behavior and safety analysis is a current subject of study. In Ref. [8] a survey is presented with almost 60 case studies and methods for assessing the condition of a structure, however, there is little focus in Data Preparation. Although anomaly detection can be a part of abnormal behavior analysis, in most cases does not play a role on the Data Preparation phase. Another solution for anomaly classification in dams is presented in Ref. [9], where data is separated into the environmental variables and noise, allowing the creation of two models in order to identify relationships with those variables and the dam response. It looks for thresholds in data and uses SPE (Squared Prediction Error) to classify anomalies into several qualitative labels (extreme environmental value, global damage, malfunction or local damage).
Ref. [10] compare Artificial Neural Networks (ANN) and Finite Element Method Models (FEM) and conclude that ANN is capable of detecting anomalous seepage on dams. Ref. [11] uses PCA on monitoring data as a method to ensure dam safety, and identifies false alarms, data reduction and noise elimination as the three main problems encountered. BackPropagation Neural Networks (BPNN) are used to sim-ulate environmental effects and find relationships between
them, in order to find anomalous data that may need further analysis (create a system warning). It identifies as problems the limitations of the training samples and over-fitting [12].
Figure II shows the usage of Multiple Linear Regression models for dam behavior prediction, which uses as predictors the water level (represented as H), the temperature (represented as θ) and time (represented as a date) [13]. The time effect can also be represented as T (number of days since the beginning of the exploration phase). The model can be trained to predict several effects (e.g., Opening, Seepage, Displacement, Radial Displacement and Tangential Displacement).
Fig. 2. Multiple linear regression model used in dam behavior prediction
Usually, predictors are obtained through a function, as pre-sented in the equation below, where each predictor is obtained differently: Water Level effect is a polynomial function while Temperature is a linear combination of sinusoidal functions that depend on the day of the year (although it can be obtained by other sensors) [13].
y0(H, θ, t) = F (H) + F (θ) + F (t) (1)
Multiple Linear Regressions can be used for outlier de-tection defining a boundary (based on a specific number of standard deviations) where values outside these limits are identified as outliers [14] [15].
III. CASE STUDY
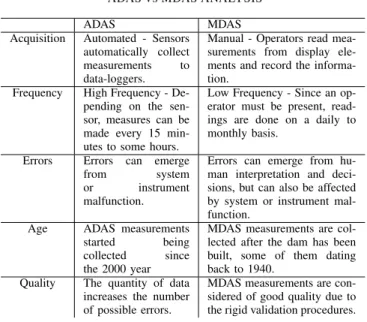
The gestBarragens system [16] is used in Portugal to manage the data captured by monitoring systems installed on large Portuguese dams. It also includes analytical and reporting tools that support dam safety specialists to assess the safety of these civil engineering structures. Ref. [1] and [16] both highlight the importance of safety control on dams and both agree that anomaly detection on these structures is key to ensure a good evaluation and response to problems that may lead to dangerous situations. Automated data acquisition systems (ADAS) are being continuously implemented in large dams. Automated measurements are compared with the man-ual ones (i.e. manman-ually acquired by dam operators) in order to assess the quality of ADAS data. A more detailed comparison between the manual data acquisition system (MDAS) and the ADAS can be seen in Table I. Note that the quality of data from the MDAS is highly reliable, as it follows a rigid process with multiple validations during the acquisition and the processing phase. This data is only made available when manually validated by a dam expert.
TABLE I
ADASVSMDAS ANALYSIS ADAS MDAS Acquisition Automated - Sensors
automatically collect measurements to data-loggers.
Manual - Operators read mea-surements from display ele-ments and record the informa-tion.
Frequency High Frequency - De-pending on the sen-sor, measures can be made every 15 min-utes to some hours.
Low Frequency - Since an op-erator must be present, read-ings are done on a daily to monthly basis.
Errors Errors can emerge from system or instrument malfunction.
Errors can emerge from hu-man interpretation and deci-sions, but can also be affected by system or instrument mal-function.
Age ADAS measurements started being collected since the 2000 year
MDAS measurements are col-lected after the dam has been built, some of them dating back to 1940.
Quality The quantity of data increases the number of possible errors.
MDAS measurements are con-sidered of good quality due to the rigid validation procedures.
IV. DESIGN AND DEVELOPMENT
During this phase of the research, we tested several baseline methods (like whiskers box-plot and other extreme value anal-ysis methods) and several unsupervised clustering algorithms (K-Means [17] , Local Outlier Factor [18] and DBSCAN [19] , doing, in total, more than 5000 different analysis, with different predictive variables). The methods were used in real datasets from a specific Portuguese dam managed by the gestBarragens system and the programming language chosen was R. Since the datasets are not labeled with regard to being an outlier, classification metrics were not available to assess the algorithms’ performance. An expert in dam safety analysis was asked to analyze the results in four datasets, each containing a different response variable, with a total of 196 analysis per dataset. The DBSCAN (Density-based spatial clustering of applications with noise) algorithm showed to be the most useful clustering algorithm in the datasets, so was the one used in the presented solution.
This section presents the proposed method for outlier detec-tion and a comparative model to assess its performance against baseline method commonly used in dam safety.
A. MDAS Algorithm for outlier detection
Based on extreme value analysis methods and the compar-ison of MDAS measurements against ADAS, we created an algorithm able to classify sensor data as outliers depending on the distance between the ADAS value and the correspond-ing MDAS value (this association is time-based). The main rationale is to obtain the mean distance between MDAS and ADAS values and use it with limits calculated using the mean and the standard deviation from the MDAS values times a K parameter, to classify outliers. As seen in Figure 3 the algorithm deals very well with extreme outliers.
Fig. 3. Left: Results with outlier pointed out as red crosses with K=2. Right: Outlier Removal after the algorithm. MDAS are presented as orange points.
B. Method for outlier identification and treatment
A method was developed combining algorithms and tech-niques able to detect extreme outliers and algorithms capable of detecting other outliers based on previous experience from the predictors, in this case, DBSCAN.
The presented method consists of three different steps: 1) MDAS Algorithm: this step uses the manual data
acquisition dataset as a reference to remove extreme outliers.
2) DBSCAN: being the clustering algorithm with the best results in our tests, DBSCAN is used to identify most of the outliers, using information not only about the variable but several predictors like temperature and water level.
3) Standard Deviation: a baseline method that uses a pre-dictive method (in this case Multiple Linear Regression) and a threshold based on the standard deviation. The threshold is used to observe if all values are near their predicted match. The technique is used as the last safety net for any remaining outliers.
C. Comparative model
Due to the classification setting, confusion matrices (CM) were used to obtain information about the performance of both the baseline metrics and the presented method. Using the CM’s metrics, we are able to obtain Precision (percentage of identified outliers that are actual outliers), Recall (percentage of outliers identified) and Accuracy (correctly identified points, both outliers and non outliers). Additionally, combined metrics that allow a distinct performance study were used, in specific the F-Measure, that combines both Precision and Recall. However, since our objective was to detect most of the outliers, we also used the F2-Measure (see eq. 2), that weight more the Recall metric.
F 2 − M easure = 3 ∗ P recision ∗ Recall
V. DEMONSTRATION
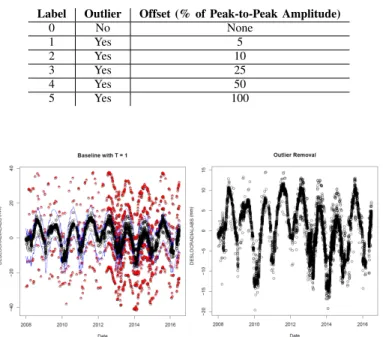
To demonstrate the performance of the methods, three datasets were created from original datasets without outliers, each one with a different percentage of outliers (1, 5 and 10%). The original dataset includes the radial displacement variable (values in mm) and the predictors (water level, temperature and time). Then, outliers were introduced in the data by creating offsets of the radial displacement from the original values. The offset values (+/-, at random, 5, 10, 25, 50 and 100% of peak-to-peak amplitude) were picked to represent different possibles outliers. The dataset was labeled according to the offset of each point, as seen in Table II.
TABLE II OUTLIER TYPES CREATED
Label Outlier Offset (% of Peak-to-Peak Amplitude) 0 No None 1 Yes 5 2 Yes 10 3 Yes 25 4 Yes 50 5 Yes 100
Fig. 4. Baseline method on dataset with 10% of outliers. Left: outlier identification with T=1 (outliers can be seen in red and the threshold is showed as the blue lines; Right: outlier removal after the baseline method
The considered baseline method is commonly used by dam safety experts and consists of using multiple linear regression (MLR) models with temperature estimated as a sinusoidal function of sin (SEND) and cos (COSD), and water level (H4) as predictors, then using the standard deviation times T to obtain the threshold. The best results were obtained using T = 1, based on the F2-Metrics (T was varied between 1 and 5 in the three datasets). The results in the dataset with 10% of outliers can be seen in Figure 4. As we can see, most of the extreme outliers were identified and removed.
A. Method for Outlier Identification and Treatment
Before the proposed method was applied to three datasets, preliminary tests were done to identify the best set of pa-rameters for each dataset, based on the F2-Measure. In total, 18000 different analysis were done in each dataset by varying K (MDAS Algorithm) and T (Standard Deviation) between 1
and 5, and running DBSCAN with 720 different parameter combinations, including normalization and scaling of some of the predictors (in order to manually increase or decrease their weight in the algorithm). In Table III we can see the predictors used and their average results.
The first step of the method presented in Section IV-B consists of using the Outlier Detection Algorithm using MDAS to remove most of the extreme outliers. For the dataset with 10% of outliers, the MDAS algorithm was used with K=2 (meaning that the threshold was defined as the standard devi-ation of MDAS measurements value times 2). After removing the outliers identified in the previous step, DBSCAN made use of the predictor information to detect most of the remaining outliers. The predictive set used (3) contained time (T, age of dam in days) and water level (H) information, with Epsilon = 0.5 and a MinPoints value of 2. In the end, the Standard Deviation (Baseline Method) was utilized to detect remaining outliers, with T=1. The impact of the method on the dataset can be seen in Figure 5.
TABLE III
RESULTS PERPREDSET(MEAN VALUES FROM ALL DIFFERENT ANALYSIS) PredSet F2-Measure Accuracy Predictor
4 0.522152 83.31290 COSD SEND H 9 0.515326 82.14180 SCALEDCOSD SCALEDSEND NORMH 6 0.501121 86.11785 NORMT NORMH 12 0.497407 78.68506 SCALEDCOSD SCALEDSEND H NORMT 10 0.495818 78.26938 SCALEDCOSD SCALEDSEND NORMH T 11 0.495818 78.26938 SCALEDCOSD SCALEDSEND H T 5 0.491344 84.43801 NORMT H 8 0.4689578 78.64226 SCALEDCOSD SCALEDSEND H 3 0.442441 78.13292 T H 7 0.4424414 78.13292 T NORMH 2 0.4423763 84.86358 H 1 0.406106 87.82597 None
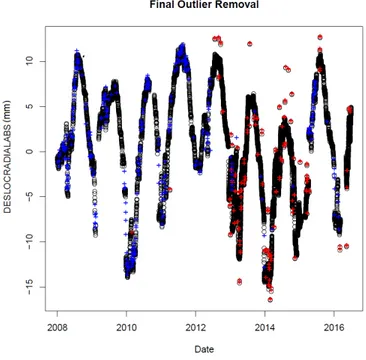
Fig. 5. Impact of the Method on the Dataset with 10% of Outliers. Left -Original Dataset; Right - Final Result after outlier removal
VI. EVALUATION
The Baseline method was able to detect most or all of Type 4 and 5 outliers (Extreme outliers) in the three different datasets. While accuracy values were high, the F2-Measure values were around 60, finding 50% of total outliers (Recall), as seen in Table IV.
TABLE IV BASELINE RESULTS’METRICS
Percentage of Outlier Caught Dataset Type 1 Type 2 Type 3 Type 4 Type 5
0,01 0 1.818 47.273 100 100
0,05 0.366 3.650 52.555 100 100
0,1 0 0.730 44.607 98.721 100
Classification Metrics Dataset Recall(%) Accuracy(%) F2
0,01 49,817 97.482 59,302
0,05 51,316 87.558 61,203
0,1 48,794 74.882 58,819
Using the proposed method, a problem was identified in all datasets: the results are dissimilar, having completely different results before and after 2012. In the end, we can observe that most of the outliers were removed in the three datasets. However we can also see that we have a lot of False Positives (removed points that are not outliers) before 2012, while the False Negatives (outliers not identified) appear mostly after the year 2012, as we can see in Figure 6, representing the results obtained in the dataset with 10% outliers.
Fig. 6. Final result in the dataset with 10% of outliers.
In Table V the Confusion Matrix is presented, showing the cumulative impact of each step of the method in the
dataset with 10% outliers. Note that the method identified 357 False Positives. Observe that the MDAS algorithm was able to identify all of type 5 outliers, however it missed most of the type 4, even with a low threshold (K = 2). In the end, the method was able to detect all type 4 and 5, and most of the other types, having DBSCAN as the main step (the most impacting step).
TABLE V
CONFUSION MATRIX EVOLUTION IN THE DATASET WITH10%OF OUTLIERS
MDAS Algorithm DBSCAN Standard Deviation TYPE FALSE TRUE FALSE TRUE FALSE TRUE
0 24631 0 24316 315 24274 357 1 547 0 92 455 92 455 2 548 0 69 479 63 485 3 547 0 67 480 30 517 4 369 178 44 503 0 547 5 0 547 0 547 0 547
The method was able to classify correctly 93% of the outliers, with a F2-Measure of 91.3 (as seen in Table VI). All of extreme outliers (type 4 and 5) were caught, 94.5% of type 3 but was not capable to get over than 90% of type 1 and 2 outliers caught. As we can see in Figure 6, most of outliers remaining are not distinguishable from the remaining points. Besides the type 1 and 2, we still have 30 type 3 outliers.
TABLE VI
RESULTS METRICS STEP BY STEP(DATASET WITH10%OF OUTLIERS)
Percentage of Outlier Caught Step Type 1 Type 2 Type 3 Type 4 Type 5
MDAS 0 0 0 32.541 100
DBSCAN 83.181 87.409 87.751 91.956 100
SD 83.181 88.504 94.516 100 100
Final 83.181 88.504 94.516 100 100 Classification Metrics
Step Recall(%) Accuracy(%) F2
MDAS 26,499 72.661 35,098
DBSCAN 90,058 77.864 89,589
SD 93,238 78.028 91,325
Final 93,238 78.028 91,325
Table VII compares the impact of the presented method against the baseline in the three datasets, showing an increase of 30 on the F2-Measure value in every one. Again note that DBSCAN is responsible for detecting most of the outliers, while Standard Deviation algorithm slightly improves the performance of the method (except in the dataset with 1% of outliers).
TABLE VII
COMPARISON BETWEENF2-MEASURE
Dataset MDAS DBSCAN SD Final Baseline 1 37,079 90,315 90,315 90,315 59,302
5 26,4 89,49 90,583 90,583 61,203
VII. CONCLUSION
The main objective of this research was to detect, in an au-tomated setting, outliers in sensor data from civil engineering structures. Three different clustering algorithms were used to detect outliers in real dam’s sensor datasets (see Section 4). DBSCAN proved to be very useful when detecting outliers, increasing recall values to nearly 90% in every evaluated datasets, as seen in Table VII.
Clustering algorithms, like DBSCAN, can be heavy influ-enced by variable selection. Based on the known impact of environmental variables on the dam static response, several parameter sets were tested (results can be consulted in Table III). When using environmental variables, the overall perfor-mance of the method was improved.
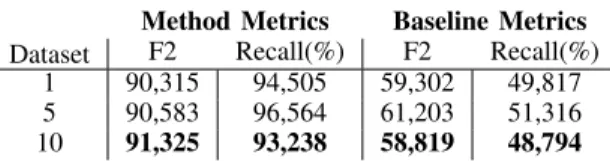
A Method for Outlier Detection and Treatment was devel-oped and was able to detect between 93% to 96% of outliers in our demonstration, with F2 values above 90. In the end, this method’s performance was better than the Baseline Methods, as we can see in Table VIII.
TABLE VIII
COMPARISON BETWEENF2-MEASURE
Dataset
Method Metrics Baseline Metrics F2 Recall(%) F2 Recall(%) 1 90,315 94,505 59,302 49,817 5 90,583 96,564 61,203 51,316 10 91,325 93,238 58,819 48,794
Outliers of Type 1 and 2 have a very small offset, which make them very hard to detect, especially when the sensors already have a small error threshold. A more calibrated com-parative model, that could increase the weight/cost of other types of outliers while disregarding the smaller outliers, can be used.
Additionally, unbalanced datasets, such as the one presented in Section V, raise several challenges to the use of DBSCAN. Since DBSCAN is a density based algorithm, changes in the acquisition frequency or missing data (due inoperative or malfunctioning sensor) may lead it to behave differently throughout the dataset.
The presented results proved to be very promising, leading this research’s future work to a generalization perspective where all datasets (all sensors for all dams) can be subject to such strategy for outlier detection. As a consequence, the resulting added value to sensor data due to the detection and annotation of outliers will directly impact the data analysis in the dam safety engineering oversight. Therefore, improved dam safety assessment contributes to avoid potential environ-mental, human and economic disasters that can cause not only economic costs, but also environmental and human losses.
REFERENCES
[1] A. T. Castro and J. Barateiro, “Sistemas de informac¸˜ao no controlo de seguranc¸a de barragens de bet˜ao,” Construc¸˜ao Magazine, no. 70, pp. 16–21, 2015.
[2] RSB, “Dam safety regulation. dl n.344/2007,” October 15th. DR, Lisbon, 2007.
[3] M. Ljunggren, T. Logan, and P. Campbell, “Is your dam as safe as your data suggest,” in Proceedings of the NZSOLD/ANCOLD conference, vol. 1, 2013.
[4] K. Peffers, T. Tuunanen, M. A. Rothenberger, and S. Chatterjee, “A design science research methodology for information systems research,” Journal of management information systems, vol. 24, no. 3, pp. 45–77, 2007.
[5] C. Shearer, “The crisp-dm model: the new blueprint for data mining,” Journal of data warehousing, vol. 5, no. 4, pp. 13–22, 2000. [6] R. Wirth and J. Hipp, “Crisp-dm: Towards a standard process model for
data mining,” in Proceedings of the 4th international conference on the practical applications of knowledge discovery and data mining, 2000, pp. 29–39.
[7] V. Hodge and J. Austin, “A survey of outlier detection methodologies,” Artificial intelligence review, vol. 22, no. 2, pp. 85–126, 2004. [8] F. Salazar, R. Mor´an, M. ´A. Toledo, and E. O˜nate, “Data-based models
for the prediction of dam behaviour: a review and some methodological considerations,” Archives of Computational Methods in Engineering, vol. 24, no. 1, pp. 1–21, 2017.
[9] L. Cheng and D. Zheng, “Two online dam safety monitoring models based on the process of extracting environmental effect,” Advances in Engineering Software, vol. 57, pp. 48–56, 2013.
[10] G. Tayfur, D. Swiatek, A. Wita, and V. P. Singh, “Case study: Finite element method and artificial neural network models for flow through jeziorsko earthfill dam in poland,” Journal of Hydraulic Engineering, vol. 131, no. 6, pp. 431–440, 2005.
[11] H. Yu, Z. Wu, T. Bao, and L. Zhang, “Multivariate analysis in dam mon-itoring data with pca,” Science China Technological Sciences, vol. 53, no. 4, pp. 1088–1097, 2010.
[12] N. Li, P. Li, X. Shi, K. Yan, and W. Ren, “Outlier identify based on bp neural network in dam safety monitoring,” in Informatics in Control, Automation and Robotics (CAR), 2010 2nd International Asia Conference on, vol. 2. IEEE, 2010, pp. 210–214.
[13] J. Mata, “Interpretation of concrete dam behaviour with artificial neural network and multiple linear regression models,” Engineering Structures, vol. 33, no. 3, pp. 903–910, 2011.
[14] J. Mata, A. Tavares de Castro, J. S´a da Costa, J. Barateiro, and P. Miranda, “Threshold definition for internal early warning systems for structural safety control of dams. application to a large concrete dam,” 2012.
[15] Swiss Committee on Dams, “Methods of analysis for the prediction and the verification of dam behaviour,” 21st International Congress on Large Dams, ICOLD, Montreal, Canada, June 2003.
[16] E. Portela, C. Pina dos Santos, A. Silva, H. Galhardas, and J. Barateiro, “A modernizac¸ao dos sistemas de informac¸ao de barragens: o sistema gestbarragens,” 2005.
[17] J. MacQueen, “Some methods for classification and analysis of multivariate observations,” in Proceedings of the Fifth Berkeley Sympo-sium on Mathematical Statistics and Probability, Volume 1: Statistics. Berkeley, Calif.: University of California Press, 1967, pp. 281–297. [Online]. Available: https://projecteuclid.org/euclid.bsmsp/1200512992 [18] M. M. Breunig, H.-P. Kriegel, R. T. Ng, and J. Sander, “Lof: identifying
density-based local outliers,” in ACM sigmod record, vol. 29, no. 2. ACM, 2000, pp. 93–104.
[19] M. Ester, H.-P. Kriegel, J. Sander, X. Xu et al., “A density-based algorithm for discovering clusters in large spatial databases with noise.” in Kdd, vol. 96, no. 34, 1996, pp. 226–231.
![Figure 1 shows the data lifecycle presented in Ref. [3] that includes several steps that can impact quality of dam data.](https://thumb-eu.123doks.com/thumbv2/123dok_br/18080243.865455/2.918.499.825.653.948/figure-shows-lifecycle-presented-includes-steps-impact-quality.webp)
![Figure II shows the usage of Multiple Linear Regression models for dam behavior prediction, which uses as predictors the water level (represented as H), the temperature (represented as θ) and time (represented as a date) [13]](https://thumb-eu.123doks.com/thumbv2/123dok_br/18080243.865455/3.918.546.773.305.372/multiple-regression-prediction-predictors-represented-temperature-represented-represented.webp)