Plant Breeding |
Article
fiber yield in cultivars of upland cotton
Laíse Ferreira de Araújo (1*); Wener Santos de Almeida (2); Cândida Hermínia Campos de Magalhães Bertini (2); Francisco das Chagas Vidal Neto (3); Ervino Bleicher (2)
(1) Universidade Federal do Ceará (UFC), Departamento de Engenharia Agrícola, 60021-970 Fortaleza (CE), Brasil.
(2) UFC, Departamento de Fitotecnia, 60021-970 Fortaleza (CE), Brasil.
(3) Embrapa Agroindústria Tropical, 60511-110 Fortaleza (CE), Brasil.
(*) Corresponding author: [email protected]
Received: Febr. 25, 2012; Accepted: Aug. 21, 2012
Abstract
This study evaluated the relative contribution of agronomic and technological components on the fiber yield in upland cotton
cultivars. The experiment was carried out with 11 upland cotton cultivars in a completely randomized blocks design with three
replications. Initially, we performed analysis of variance, with the F test at 5% probability for the effect of cultivar as fixed ef
-fects as well as block and environment ef-fects as random. Then the values were ordered according to cluster test Scott-Knott, at 5% probability level. The significance of the null hypothesis that all possible canonical correlations are null was evaluated
using the chi-square test. The correlations were estimated through the path analysis. By examining the canonical correla-tions there was dependence between the two groups of variables and therefore it is possible to promote changes in certain
characteristics through the selection of others correlated. Plants of upland cotton with higher fiber yield were influenced by the decrease in average weight of the cotton boll. When there is a reduced fiber yield, there is also an increase in uniformity and strength thereof. The fiber resistance had negative indirect effects on the fiber uniformity and length.
Key words:Gossypium hirsutum, fiber quality, agronomic traits.
Correlações e análise de trilha em componentes da produtividade de fibra em
cultivares de algodoeiro herbáceo
Resumo
Objetivou-se avaliar a contribuição relativa dos componentes agronômicos e tecnológicos da fibra na variável produtivida
-de da fibra em cultivares -de algodoeiro herbáceo. O experimento foi realizado com 11 cultivares -de algodão herbáceo e o delineamento experimental utilizado foi o de blocos casualizados com três repetições. Inicialmente, realizou-se a análise de variância, com o teste F a 5% de probabilidade, considerando o efeito da cultivar como fixo e os efeitos de bloco e ambiente como aleatórios. Em seguida, os valores médios foram ordenados, segundo o teste de agrupamento Scott-Knott, a 5% de probabilidade. A significância da hipótese de nulidade em que todas as possíveis correlações canônicas são nulas foi avaliada
utilizando-se o teste χ2. As correlações foram estimadas através da análise de trilha. Pelo estudo de correlações canônicas,
há dependência entre os dois grupos de variáveis e, portanto, é possível promover alterações em determinadas caracterís
-ticas através da seleção para outras correlacionadas. Plantas de algodão herbáceo com maior produtividade da fibra são influenciadas pela diminuição da massa média de capulhos. Quando há diminuição da produtividade da fibra, há também aumento na uniformidade e no comprimento. A resistência da fibra possui efeitos indiretos positivos sobre a uniformidade e o comprimento da fibra.
Palavras-chave:Gossypium hirsutum, qualidade da fibra, características agronômicas.
1. INTRODUCTION
The study on canonical correlations has as main goal the identification and quantification of the linear rela-tionships between two sets of multiple variables, met-rics or not (Johnson and Wichern, 2002). Cruz and Carneiro (2003) argued that the great advantage of this technique is the possibility to assist the breeder in the study involving more than one dependent variable,
allowing the efforts to be directed to traits of high heri-tability, easily measured, and with lower complexity in the grain production in plant breeding.
between several traits of the plant and determines the trait on which the selection can be based, to improve yield, earli-ness, and fiber quality (Iqbal et al., 2003).
The canonical correlation analysis is a multivariate statistics procedure that allows examining the relation-ships between two sets of variables (X and Y) (Abreu and Vetter, 1978). This analysis is widely used in exploratory studies by researchers who have a large number of vari-ables, but are able to study those linear combinations whose correlation is higher (Silva et al., 2007).
Aiming to better understand the reasons involved in the association of characters, Wright (1921) proposed a method of unfolding the correlations into direct and indirect effects of the variables on a base variable, called path analysis, which measures the direct influence of one variable on another that is independent of the others. Then the path analysis can be done from phenotypic, ge-netic or environmental correlations (Cruz, 2001). This methodology has been used in several species (Silva et al., 2005; Amorim et al., 2008), among them the cotton (Tyagi et al., 1998; Iqbal et al., 2003).
In this way, Hoogerheide et al. (2007) evaluated the relationships between technological traits of the cot-ton fiber and yield through path analysis. These authors verified that the highest direct effect on the yield is pro-moted by the fineness or micronaire index, and the fiber strength, length and elongation have secondary effects. Considerable emphasis has been given upon the inter re-lationship between yield and yield components in cotton. The understanding of the correlation of factors influenc-ing yield is a pre-requisite for designinfluenc-ing an effective plant breeding programme (Salahuddin et al., 2010).
The goal of the present study was (i) to evaluate the canonical correlations between two groups, agronomic and technological traits of the fiber, aiming to verify the associations and the interdependence between them; and (ii) to analyze the relationships between technological and agronomic traits on the cotton fiber and identify their direct and indirect effects, by path analysis, to assist the breeding process.
2. MATERIAL AND METHODS
The field experiment was carried out in Fortaleza (CE), Brazil. The climate of the region is Aw (tropical rainy), according to Köeppen classification, with an annual mean temperature of 26 ºC, 34 ºC maximum and 21 ºC mini-mum. The annual mean rainfall is 1,600 mm, with dry winter and abundant rain in autumn (Inmet, 2008). The soil of the experimental area is sandy, with the following
chemical attributes (cmolc kg-1), according to soil analysis:
0.70 Ca++; 0.50 Mg++; 0.03 Na+; 0.04 K+; 0.33 H+ + Al3+;
0.10 Al3+; pH (water) 6.1 and 4.03 g kg-1 OM. The
fertil-ization was performed according to soil analysis and the
experiment was undertaken in 2010, between April and August. The treatments consisted of 11 cultivars of up-land cotton (BRS Cedro, BRS Aroeira, BRS Itaúba, BRS Araçá, BRS Ipê, BRS Acácia, BRS Araripe, BRS Seridó, CNPA ITA 190, CNPA Precoce 1, LD Frego), cultivars developed by the Breeding Program of Embrapa Cotton.
A completely randomized blocks design was used with three replications. The experimental plot was made up by two rows 2.5 m length, with 10 plants each, spacing 0.25m x0.70 m, with useful area of 10 central plants in the plots, removing those at the ends. The culture system adopted was the conventional and the soil was prepared with a plowing followed by harrowing. The watering was made by conventional sprinkler and the harvesting was done manually. The cotton seeds were extracted using a cotton gin machine.
Two sets of traits were established, the group I formed by the agronomic traits, i.e., fiber yield (Fiberyield), boll mean weight (Wmeanboll), percentage of fiber (Percfiber) and weight of 100 seeds (W100seeds), the group II was formed by the technological traits of the fiber, i.e., length (UHM), uniformity (UNF), strength (STR), elongation (ELG), micronaire (MIC), maturity (MAT), reflectance (Rd), degree of yellowness (+b), and count strength prod-uct (CSP) of the cotton fiber.
The canonical correlation analyses were estimated as a measure of association according to the overall consider-ations of Cruz and Carneiro (2003), whereby there are two sets of variables, X and Y, defined as:
X’ = [ x1 x2 ... xp] is the vector of measures of p traits
forming the group I, and
Y’ = [ y1 y2 ... yp] is the vector of measures of q traits
forming the group II.
One way to express a canonical correlation can be de-termined by a linear combination between x and y:
X1 = a1x1 + a2x2 + ... + apxp Y1 = b1y1 + b2y2 + ... + bpyp
Where:
a’ = [ a1 a2 ... ap] is the vector 1 x p of weights of the
traits of the group I; and
b’ = [ b1 b2 ... bq] is the vector 1 x q of weights of the
traits of the group II.
In this way, the first canonical correlation will be the
one that maximizes the relationship between X1 and Y1.
The functions X1 and Y1 constitute the first canonical pair
associated with the canonical correlation expressed by:
r1= Côv(X1,Y1)
^
(√V(X1). V(Y1)^
Thus:
Côv (X1, Y1) = a’ S12 b;
^
^
V(Y1) = b’ S22 b.
In this way:
S11 is the matrix p x p of covariances between the
traits of the group I;
S22 is the matrix q x q of covariances between the traits
of the group II;
S12 is the matrix p x q of covariances between the
traits of the group I and II.
For the cases that use standardized variables, S11 = R11,
S22 = R22 and S12 = R12, where R is a correlation matrix.
And R is the correlation matrix of the two sets of
vari-ables, corresponding to (R21= R12):
R1= R11 R12
[ ]
R21 R22The estimate of the vectors a and b is achieved by maximizing the function r, subjected to the constraint
that a’R11a = b’R22b = 1. These constraints are necessary
to provide single estimators of a and b, and indicate that each linear combination has a variance equal to 1 (Cruz and Carneiro, 2003). The first step is the determination
of the eigenvalues (λ) of the equations:
| R11-1R 12R22
-1 R
21 – λI | = 0 and
| R22-1R 21R11
-1R
12 – λI | = 0;
Then, it is calculated their respective eigenvalues as-sociated. The eigenvalues can be estimated by two distinct and characteristic equations, from two different matrices, one of order p and another of order q. In the case that p
= q and the variables X1, X2, ... Xp, and the variables Y1,
Y2, ... Yq are linearly independent, then, there will be p=q
non-null eigenvalues and p=q canonical pairs.
Nevertheless, if for example p<q, we have p-q null
ei-genvalues of the matrix R22R22-1R
11 -1R
12 and only p
canon-ical pairs. Thus, the system of linear equations is given by:
(R11-1R 12R22
-1R
21 – λI) a = θ,
(R22-1R 21R11
-1R
12 – λI) a = θ.
Thus: (1) the first canonical correlation (r1) between
the linear combination of the traits of the groups I and
II is given by: r = (λ1)0.5 where λ1 is the highest
eigen-value of the matrix R11-1R
12R22 -1R
12, which is square and
in general non-symmetric of order p; (2) the first
canon-ical factor is given by X1 = a’ X and Y1 = b’ Y, where:
a is the eigenvector associated to the first eigenvalue of R11-1R
12R22 -1R
12 and b is the eigenvector associated to the
first eigenvalue of R22-1R
12R11 -1R
12; and (3) the other
cor-relations and canonical factors are estimated by using the eigenvalues and eigenvectors of the expressions described, of order corresponding to p or q-th estimated correlation.
The significance of the null hypothesis that all pos-sible canonical correlations are null was evaluated using
the chi-square test (χ2). Also it was performed
canoni-cal correlations analyses to verify the associations between the group of agronomic traits (group I) and technological traits of the fiber (group II).
To investigate the effects of cultivars on these charac-ters, analysis of variance was used, with the F test at 5% probability for the effect of cultivar as fixed effects as well as block and environment effects as random. Then the values were ordered according to cluster test Scott-Knott (Scott and Knott, 1974), at 5% probability level.
Estimates of genotypic (rg) and phenotypic (rf)
cor-relations, between the characters were obtained accord-ing to Mode and Robinson (1959), tested at 1 and 5% probability by t test. Correlations were made between the variable fiber yield and agronomic and technological fiber characteristics, combining the data of the variables in all possible ways, with the purpose of obtaining information about the nature and intensity between them.
Two multicollinearity diagnoses were made for the independent variables, first for the group of agronomic traits and second for the group of technological traits of the fiber. The degree of singular X’X multicollinear-ity matrix was based on the condition number (CN), which is the ratio between the largest and smallest ei-genvalue of the matrix. If CN<100, multicollinearity is called weak and does not put a problem for the analysis, if 100<CN<1000, multicollinearity is considered mod-erate to strong, and if CN>1000, is considered severe (Cruz and Carneiro, 2003).
The path analysis was performed according to Li (1975) to determine the direct and indirect effect of the secondary components of yield. This analysis was based on the estimation of the matrix of genetic correlation coeffi-cients. For all these tests the significance level was set at 5%. All these statistical analyses were performed using the software GENES (Cruz, 2006).
3. RESULTS AND DISCUSSION
All variables have a significant effect of genotypes (Table 1) and the coefficient of experimental variation ranged from 4.86% (W100seeds) to 20.56% (Fiberyield). For the technological characteristics of the fiber, all variables showed a significant effect among cultivars (Table 2). The coefficient of variation experimental ranged from 0.83% (MAT) to 6.30% (ELG). Ge et al. (2008) report that the lowest coefficient of variation associated with variables representing the quality of the fiber is due to the smaller number of genes influencing their responses.
(Table 3). Analyzing the first canonical pair, through its coefficients, it was verified that plants with higher count strength product (CSP) and indices of fiber maturity (MAT), variables of the group II, have been associated to increased weight of 100 seeds (W100seeds) and boll mean weight (Wmeanboll), variables of the group I. Also, the second canonical pair (Table 3) showed that the decrease in fiber length (UHM) and strength (STR), together with the increase of micronaire index (MIC) and count strength product, contributed to the increase of fiber yield (Fiberyield).
In the third canonical pair was possible to observe that the upland cotton plants with higher boll mean weight and lower yield values are influenced by a re-duced count strength product and micronaire index, in-creasing thus the strength, length (UHM), degree of yel-lowness (+b) and the fiber uniformity. Then when there is a decrease in the fiber yield, there is also an increase in its length uniformity. The uniformity trait is very im-portant for the consumer market of cotton, since the higher index, the lower the losses in spinning processes (Fonseca and Santana, 2002).
Table 1. Analysis of variance with the boll mean weight (Wmeanboll), fiber yield (Fiberyield), percentage of fiber (Percfiber) and weight
of 100 seeds (W100seeds) in different cultivars of upland cotton
Mean squares
Source of variation DF Wmeanboll (g) Fiberyield (kg ha-1) Percfiber (%) W100seeds (g)
Block 2 0.60 1387186.12 16.79 0.28
Treatment 10 1.22** 360357.43* 35.92** 3.50**
Residual 20 0.12 151696.68 4.36 0.31
Mean 5.29 1894.71 41.13 11.51
CVe (%) 6.71 20.56 5.08 4.86
nsNon-significant. **; *: Significant at 1% and 5% levels respectively by the F test.
Table 2. Analysis of variance with the fiber length (UHM), fiber uniformity (UNF), strength (STR), elongation to break (ELG), micronaire
(MIC), fiber maturity (MAT), reflectance (Rd), degree of yellowness (+b) and count strength product (CSP) in different cultivars of upland cotton
Mean square Source of variation DF UHM
(mm) UNF (%)
STR
(gf tex-1) ELG (%)
MIC
(µg pol-1) MAT (%) Rd +b CSP
Block 2 0.27 0.04 4.30 0.02 0.02 0.63 6.95 0.31 11889.44
Treatment 10 2.79** 4.29** 15.79** 1.22** 0.64** 4.82** 10.43** 0.87** 307369.97**
Residual 20 0.18 0.70 3.14 0.06 0.06 0.56 2.40 0.10 26370.64
Mean 30.16 85.63 33.80 4.09 5.55 90.82 74.80 7.99 2886.70
CVe(%) 1.44 0.98 5.24 6.30 4.64 0.83 2.07 3.99 5.63
nsNon-significant. **; *: Significant at 1% and 5% levels respectively by the F test.
Table 3. Canonical correlations estimated between the agronomic (group I) and technological (group II) traits in upland cotton
Traits Canonical pairs
1st 2nd 3rd 4th
Group I
Wmeanboll (g) 0.2820 0.2310 2.0138 0.9741
Fiberyield (kg ha-1) -0.1171 1.4157 -1.8827 -1.0675
Percfiber (%) -0.3004 -0.41354 -0.0499 2.0136
W100seeds (g) 0.6070 -1.6612 -0.2457 1.9172
Group II
UHM (mm) -0.0189 -7.7819 2.0305 22.0368
UNF (%) 0.3959 -2.7496 2.0330 52.2427
SFI (%) 2.4980 -7.8301 2.8881 56.7091
STR (gf tex-1) 0.0470 -2.4180 0.5512 -1.2378
ELG (%) -0.9712 5.4255 -3.5305 -48.1832
MIC (µg pol-1) -1.0906 1.4621 -0.6318 6.7265
MAT (%) -0.1882 -0.06708 0.1297 -0.43801
Rd 0.3695 -3.3821 3.3733 -2.2729
+b -1.8242 15.4820 -5.0595 -137.8316
R² 1.00** 0.99** 0.96** 0.37**
Α 1% 1% 1% 1%
Examining the fourth canonical pair, the decrease of fiber yield, together with the increase of percentage of fiber (Percfiber) are affected by the increased of unifor-mity and fiber strength. A greater boll mean weight and percentage of fiber may be not reflected in higher fiber yield, once the bolls produced at the tip are the lightest, with lowest yield in processing and poorest quality of fi-ber (Rosolem, 2001).
The knowledge about correlations between cotton traits allows measuring the magnitude of the relationship among multiple traits and determines the trait to guide the selection, in order to improve the yield, earliness, and fiber quality (Iqbal et al., 2003).
The genotypic correlations were higher than pheno-typic correlations, for most cases (Table 4). According to Gonçalves et al. (1996), this superiority is seen as a result of modifying effects of the environment in the as-sociation of genetic traits.
As shown in table 4, the characters that displayed significant correlations with the fiber yield were: mean weight of bolls (0.87) and weight of 100 seeds (0.71). The fiber percentage variable was not significant in relation to yield, having also a negative correlation. According to Fuzatto (1999) for the case of negative correlations, the major consequence is that the selection pressure to im-prove one trait may result in losses of others, thus the achievement of a superior genotype is quite difficult, es-pecially due to associations among traits, frequently with these undesirable correlations.
As for the other characters (Table 4), the highest phe-notypic correlations were: fiber percentage x weight of
100 seeds (-0.84) and boll mean weight x weight of 100 seeds (0.71), in which all were significant.
Genotypic correlations were higher than phenotypic (Table 5). The variables which showed significant correla-tion with fiber yield were: length (0.67), uniformity (0.70), strength (0.69) and count strength product of the fiber (0.75).
From these results, it is seen that the fiber yield is directly related to all variables mentioned above, absent any negative correlation, and, therefore, does not show an inverse association between the characters. Such cor-relations do not indicate difficulty in selecting materials that will have high yield, length, uniformity and count strength product of the fiber.
Regarding the other characters in table 5, the high-est phenotypic correlations found were: count strength product x length (0.97); count strength product x uni-formity (0.96); micronaire x maturity (0.94); strength x
Table 4. Estimates of phenotypic (rf) and genotypic (rg) correlations
coefficients between the traits: boll mean weight (Wmeanboll), fiber yield (Fiberyield), percentage of fiber (Percfiber) and weight of 100 seeds (W100seeds)
Trait Correlation Fiberyield Percfiber W100seeds
Wmeanboll rf 0.87** -0.59ns 0.71*
rg 1.17** -0.67
ns 0.77**
Fiberyield rf - -0.51ns 0.76**
rg - -0.74** 1.08**
Percfiber rf - - -0.84**
rg - - -0.96**
nsNon-significant. **; *: Significant at 1% and 5% level, respectively, by the F test.
Table 5. Estimates of phenotypic (rf) and genotypic (rg) correlations coefficients between the traits: fiber yield (Fiberyield), fiber length
(UHM), fiber uniformity (UNF), fiber strength (STR), elongation to break (ELG), micronaire (MIC), fiber maturity (MAT), reflectance (Rd), degree of yellowness (+b) and count strength product of the fiber (CSP)
Trait Correlation UHM UNF STR ELG MIC MAT Rd +b CSP
Fiberyield f 0.67* 0.70* 0.69* -0.42ns -0.25ns -0.12ns 0.08ns -0.59ns 0.75**
g 0.89** 1.14** 1.23** -0.61* -0.34
ns -0.14ns 0.05ns -0.87** 1.16**
UHM f - 0.93** 0.81** -0.76** -0.33ns -0.06ns 0.08ns -0.57ns 0.97**
g - 1.02** 0.94** -0.80** -0.36
ns -0.05ns 0.10ns -0.59ns 1.02**
UNF f - - 0.87** -0.68* -0.17ns 0.06ns -0.05ns -0.45ns 0.96**
g - - 0.97** -0.75** -0.28
ns -0.02ns 0.01ns -0.52ns 1.00**
STR f - - - -0.64* 0.16ns 0.37ns -0.25ns -0.25ns 0.84**
g - - - -0.68* 0.21
ns 0.43ns -0.23ns -0.24ns 0.84**
ELG f - - - - -0.02ns -0.33ns 0.34ns 0.03ns -0.65*
g - - - - -0.03
ns -0.35ns 0.39ns 0.01ns -0.67*
MIC f - - - 0.94** -0.80** 0.84** -0.37ns
g - - - 0.94** -0.95** 0.92** -0.40
ns
MAT f - - - -0.82** 0.77** -0.12ns
g - - - -0.97** 0.84** -0.14
ns
Rd f - - - -0.74** 0.14ns
g - - - -0.87** 0.22
ns
+b f - - - -0.64*
g - - - -0.67*
uniformity (0.87) e strength x elongation to break (-0.76), in which all were significant and, mostly, positive.
In order to obtain the direct and indirect effects of path analysis, it is necessary that the X’X matrix is well conditioned. Multicollinearity problems may turn it unique, and, therefore, make the minimal square estima-tives not feasible (Cruz, 2006). The phenotypic correla-tion matrix multicollinearity diagnosis for the group of independent agronomic variables indicated weak mul-ticollinearity, causing no problems for path analysis. Regarding the technological characteristics of the fiber, multicollinearity was severe.
According to Carvalho et al. (1999), the adverse effects of performing the diagnosis of multicollinearity are reduced by eliminating variables from the regression model. Thus, the elimination of the elongation to break, maturity, reflectance and count strength product vari-ables was made, in order to multicollinearity be classified as weak (CN<100). Shrivastava and Sharma (1976), working with rice path analysis, verified that, with the elimination of the length of panicle variable, all others contributed positively.
In table 6 and 7 are shown the direct and indirect effects and the coefficients of genotypic correlation be-tween agronomic and technological traits of the fiber with the yield of 11 upland cotton cultivars. The
coef-ficient of determination (R2) and the residual effect
in-dicated how much the explanatory variables determine the fiber yield. The coefficients of determination were de 0.850 and 0.696, and the residual effects, 0.386 and 0.550 for agronomic (Table 6) and technological traits of the fiber (Table 7), respectively.
Analyzing the correlation coefficient of the Table 6, it is possible to verify that the fiber yield is positively correlated with all agronomic traits: boll mean weight (0.677), weight of 100 seeds (0.597) and percentage of fiber (0.388), indicating that the increases in these traits are positively reflected on the yield. According to Makhdoom et al. (2010), boll mean weight per plant
is the key independent yield component and play prime role in managing seed cotton yield. Boll mean weight per plant has a direct influence on the yield and positively correlated with seed cotton yield.
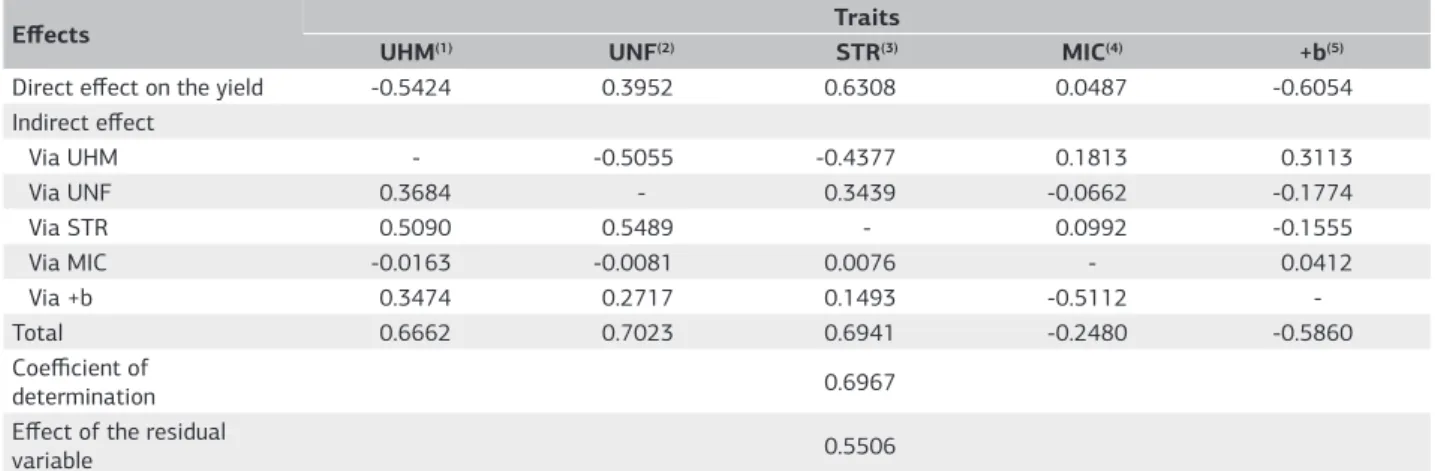
The traits, resistance (0,630) and fiber uniformity (0.395) had positive correlation with the fiber yield (Table 7). The length (-0.542), elongation to break (-0.605) were negatively correlated with the yield. The trait micronaire index had low effect on the fiber yield, therefore, the variable with the highest positive effect with fiber yield was the resistance. The strongest negative effect was registered with the degree of yellowness (Table 7).
Hoogerheide et al. (2007), examining correlations, have concluded that the technological traits have influ-ence on the cotton fiber yield. These authors affirmed that the micronaire index featured direct effect on the fiber yield (0.54) and high positive correlation (0.77), not found in this study, since the correlation was low and negative (-0.248) (Table 7). This result indicates that the selection based on this trait may not provide satisfactory gain in fiber yield.
Table 6. Estimate of the direct and indirect effects of the fiber
yield in upland cotton and the components Wmeanboll, Percfiber and W100seeds
Effects
Traits
Wmeanbol (1) Percfiber(2) W100seeds(3)
Direct effect on
the yield 0.6770 0.3887 0.5976
Indirect effect
Via Wmeanboll - -0.3975 0.4860
Via Percfiber -0.2282 - -0.3245
Via W100seeds 0.4290 -0.4990
-Total 0.8779 -0.5079 0.7592
Coefficient of
determination 0.8507
Effect of the
residual variable 0.3863
(1) Boll mean weight. (2) Percentage of fiber. (3) Weight of 100 seeds.
Table 7. Estimate of the direct and indirect effects of the fiber yield in upland cotton and the components UHM, UNF, STR, MIC and +b
Effects Traits
UHM(1) UNF(2) STR(3) MIC(4) +b(5)
Direct effect on the yield -0.5424 0.3952 0.6308 0.0487 -0.6054
Indirect effect
Via UHM - -0.5055 -0.4377 0.1813 0.3113
Via UNF 0.3684 - 0.3439 -0.0662 -0.1774
Via STR 0.5090 0.5489 - 0.0992 -0.1555
Via MIC -0.0163 -0.0081 0.0076 - 0.0412
Via +b 0.3474 0.2717 0.1493 -0.5112
-Total 0.6662 0.7023 0.6941 -0.2480 -0.5860
Coefficient of
determination 0.6967
Effect of the residual
variable 0.5506
In this case, the best strategy according to Cruz and Carneiro (2003) may be the simultaneous selection of traits, with emphasis on those with non-significant indi-rect effects; i.e., an indiindi-rect selection by means of the fiber resistance, which presented a positive correlation of 0.694 and direct effect on fiber yield of 0.630. The fiber uni-formity had high positive correlation (0.702) and direct more low effect (0.395) (Table 7). This indicates that this higher correlation was caused by indirect effects, and that the fiber resistance showed the greatest contribution via indirect (0.548), with about 78% of the direct effect on the uniformity on fiber yield.
Given the above, it is observed that the correlations between agronomic and technological traits of the fiber had different magnitudes. Cabral et al. (2011) com-mented that the study of the correlations is an association measure and not allow conclusions on the study of the cause-effect relationship. Silva et al. (2005) affirmed that the path analysis provides details of the direct and indi-rect effects of the influences of the involved traits, supple-menting thus the information given by the correlation.
Regarding the direct effects on the yield, the boll mean weight (0.677) was the trait with the highest effect, followed by the fiber resistance (0.630) and weight of 100 seeds (0.597), with this, these traits tend to be a good strategy to improve fiber yield (Tables 6 and 7).
In general, the selection through traits with indirect effects performed among technological components on the fiber is not a good strategy for genetic breeding, since in the majority of studied components the indirect ef-fects were negative and of low order. The occurrence of negative indirect effects shows the difficulty to select only based on the behavior of the main variable. Vencovsky and Barriga (1992) reported that apparently there is not yet an adequate method to maximize the response to se-lection and consider only the main components of the main variable. Therefore, when the selection process is only based on the yield, there may be loss of control on the behavior and on the harmonious balance that should exist among its components, a basic requirement that characterizes a good cultivar of cotton plant.
4. CONCLUSION
There is a dependency between the two sets of variables (agronomic and technological of the fiber), promoting changes in certain traits through the selection of other traits correlated. Plants of upland cotton with higher fiber yield are influenced by the decrease in number and mean weight of bolls. When there is a reduced fiber yield, there is also an increase in uniformity and strength thereof. The fiber resistance had negative indirect effects on the fiber uniformity and length.
REFERENCES
ABREU, M.A.; VETTER, D. A análise de relações entre conjuntos de variáveis na matriz geográfica: correlação canônica. In: FAISSOL, S. Tendências atuais na geografia urbano/regional: teorização e quantificação. Rio de Janeiro: IBGE, 1978. p.133-144.
AMORIM, E.P.; RAMOS, N.P.; UNGARO, M.R.G.; KIIHL, T.A.M. Correlações e análise de trilha em girassol. Bragantia, v.67, p.307-316, 2008.
CABRAL, P.D.S. SOARES, T.C.B.; LIMA, A.B.P.; SOARES, Y.J.B.; SILVA, J.A. Análise de trilha do rendimento de grãos de feijoeiro (Phaseolus vulgaris L.) e seus componentes. Revista Ciência Agronômica, v.42, p.132-138, 2011.
CARVALHO, C.G.P.; OLIVEIRA, V.R.; CRUZ, C.D.; CASALI, V.W.D. Análise de trilha sob multicolinearidade em pimentão. Pesquisa Agropecuária Brasileira, v. 34, p.603-613, 1999.
CRUZ, C.D. Programa GENES versão Windows: aplicativo computacional em genética e estatística. Viçosa, MG: UFV, 2006. 642p.
CRUZ, C.D.; CARNEIRO, P.C.S. Modelos biométricos aplicados ao melhoramento genético. Volume 2. Viçosa: Editora UFV, 2003. 585p.
FONSECA, R.G.; SANTANA, J.C.F. Resultados de Ensaio HVI e suas interpretações (ASTM D-4605). Campina Grande: Embrapa Algodão, 2002. 13p. (Circular Técnica, 66)
FUZATTO, M.G. Melhoramento genético do algodoeiro. In: CIA, E.; FREIRE, E.; SANTOS, W.J. (Ed.). Cultura do algodoeiro. Piracicaba: POTAFOS, 1999. p.15-34.
GE, Y.; THOMASSON, J.A.; SUI, R.; MORGAN, C.L.; SEARCY, S.W.; PARNELL, C. B. Spatial variation of fiber quality and associated loan rate in a dryland cotton field. Precision Agriculture, v.9, p.181-194, 2008.
GONÇALVES, P.S.; MARTINS, A.L.M.; BORTOLLETO, N.; TANZIZI, M.R. Estimates of genetic parameters and correlations of juvenile characters based on open pollinated progenies of Hevea. Brazilian Journal of Genetics, v.19, p.105-111, 1996.
HOOGERHEIDE, E.S.S.; VENCOVSKY, R.; FARIAS, F.J.C.; FREIRE, E.C.; ARANTES, E.M. Correlações e análise de trilha de caracteres tecnológicos e a produtividade de fibra de algodão. Pesquisa Agropecuária Brasileira, v.42, p.1401-1405, 2007.
INMET, 2008. Disponível em: <http://www.inmet.gov.br/>. Acesso em: 20/10/2011.
IQBAL, M.; CHANG, M.A.; IQBAL, M.Z. Correlation and path coefficient analysis of earliness and agronomic characters of upland cotton in Multan. Pakistan Journal of Agronomy, v.2, p.160-168, 2003.
JOHNSON, R.A.; WICHERN, D.W. Applied multivariate statistical analysis. 5.ed. New Jersey: Prentice Hall, 2002. 767p.
LI, C.C. Path analysis: a primer. Boxwood: Pacific Grove, 1975.
D.; RAZIUDDIN; SAJJAD, M.; KHAN, N. Genetic aptitude and correlation studies in Gossypium hirsutum L. Pakistan Journal of Botany, v.42, p.2011-2017, 2010.
MODE, J.C.; ROBINSON, H.F. Pleiotropism and the genetic variance and covariance. Biometrics, v.15, p.518-537, 1959.
ROSOLEM, C.A. Ecofisiologia e manejo da cultura do algodoeiro. Piracicaba: POTAFOS, 2001. 9p. (Informações Agronômicas, n. 95)
SALAHUDDIN, S.; ABRO, S.; REHMAN, A.; IQBAL, K. Correlation analysis of seed cotton yield with some quantitative traits in upland cotton (Gossypium hirsutum L.). Pakistan Journal of Botany, v.42, p.3799-3805, 2010.
SHRIVASTAVA, M.N.; SHARMA, K.K. Analysis of path coefficients in rice. Zeitschrift fuer Pflanzenzuechtung, v.77, p.174-177, 1976.
SILVA, S.A.; CARVALHO, F.I.F.; NEDEL, J.L.; CRUZ, P.J.; SILVA, J.A.G.; CAETANO, V.R.; HARTWIG, I.; SOUZA, C.S.
Análise de trilha para os componentes de rendimento de grãos em trigo. Bragantia, v.64, p.191-196, 2005.
SILVA, J.W.; SOARES, L.; FERREIRA, P.V.; SILVA, P.P.S.; SILVA, M.J.C.S. Correlações canônicas de características agroindustriais em cana-de-açúcar. Acta Scientiarum Agronomy, v.29, p.345-349, 2007.
SCOTT, A.; KNOTT, M. Cluster-analysis method for grouping means in analysis of variance. Biometrics, v.30, p.507-512, 1974.
TYAGI, A.P.; MOR, B.R.; SINGH, D.P. Path analysis in upland cotton (Gossypium. hirsutum L.). Indian Journal of Agricultural Research, v.22, p.137-142, 1998.
VENCOVSKY, R.; BARRIGA, P. Genética Biométrica no Melhoramento. Ribeirão Preto: Sociedade Brasileira de Genética, 1992. 496p.