1 Pontifical Catholic University of Ecuador in Esmeralda, Food Safety and Quality Research Group, Department of Agroindustry. Eugenio Espejo y Santa Cruz, s/n., P.O. Box. 08-01-0065, Esmeraldas, Ecuador. Correspondencia para/Correspondence to: S MATEOS-MARCOS. E-mail: <[email protected]>.
2 University of Cordoba, Agrifood Campus of Excellence International, Department of Food Science and Technology. Córdoba, Spain.
Nutritional assessment of Esmeraldan
adult population (Ecuador)
Avaliação nutricional da população adulta
de Esmeraldas (Equador)
Sonia MATEOS-MARCOS1 María Pilar VILLENA-ESPONERA1,2 Rafael MORENO-ROJAS2
A B S T R A C T
Objective
To analyse the nutritional status of the adult population in Esmeraldas by means of anthropometric measurements, the input of macro and micronutrients in the diet, and the adequacy estimation of nutrient intake by hispanic Dietary Reference Instakes along with the sex and the age influence.
Methods
Nutrient intake data were obtained by personal interview with the application of two 24 hour recalls (weekend and weekday). The anthropometric indicators analysed were body mass index, waist circumference and blood pressure. Nutriplato version 2.0 software was used for the two 24-hours food recall surveys data processing, and for the respective calculations of macronutrients, micronutrients and Dietary Reference Intakes. Means and standard deviations were calculated for anthropometry, nutrient intakes and Dietary Reference Instakes. The General Linear Model was applied to identify differences in relation to nutrient intakes considering sex, profession, body mass index, group, origin and day of the week as factors.
Results
Conclusion
Priority nutrition actions and interventions are needed to be developed in Esmeraldas adult population.
Keywords: Anthropometry. Nutrition. Recomended Dietary Allowances.
R E S U M O
Objetivo
Analisar o estado nutricional da população adulta de Esmeraldas utilizando medições antropométricas, o aporte dietético de macro e micronutrientes, e a estimação da adequação da ingestão de nutrientes por ingestão diária de referência hispânicos, juntamente com sexo e idade.
Métodos
Os dados de ingestão de nutrientes foram obtidos através de uma entrevista pessoal com a aplicação de dois lembretes de 24 horas (o fim de semana e o dia da semana). Os indicadores antropométricos analisados foram índice de massa corporal, circunferência da cintura e pressão arterial. O software Nutriplato versão 2.0 para o processamento dos dados obtidos com os dois lembretes de alimentos 24 horas e para os cálculos respectivos de macronutrientes, micronutrientes e ingestão diária de referência. As medias e desvios-padrão foram calculados para antropometria, ingestão de nutrientes e ingestão diária de referência. O General Linear Model foi aplicado para identificar diferenças na ingestão de nutrientes levando em consideração gênero, profissão, índice de massa corporal, grupo, origem e dia da semana como fatores.
Resultados
A análise estatística mostrou diferenças significativas principalmente em carboidratos, fibras, cálcio, fósforo, ferro, sódio, iodo e vitamina E. As ingestões dietéticas foram comparadas com a Ingestão Diária de Referência de Federación Española de Sociedades de Nutrición, Alimentación y Dietética e para todos os subgrupos e todas as idades não foram alcançadas a referência dietética para cálcio, potássio, iodo, riboflavina, ácido pantatênico, biotina, vitamina D, vitamina E, fibra e ácidos graxos monoinsaturados e poliinsaturados. Os resultados antropométricos obtidos indicaram que 67.0% da população estava com sobrepeso e obesidade, 87.7% dos adultos sofriam de pré-hipertensão e a circunferência da cintura indicou que 73.0% dos indivíduos apresentavam risco de doença cardiovascular.
Conclusão
Conclui-se que precisam de ações e intervenções prioritárias em nutrição para aplicá-las na população adulta de Esmeraldas.
Palavras-chave: Antropometria. Nutrição. Recomendações nutricionais.
I N T R O D U C T I O N
Nutrition in one of the most important public health problem in the world. To meet the challenges of nutrition, a wide source of information is required, so a nutritional assessment is of utmost importance to detect the possible health consequences derived from unhealthy eating patterns. The programs and the policies to be implemented and oriented toward the well-being based on previous nutritional information are fundamental for economic and human development.
Adults between ages of 20 and 65 support the production and services of a society, as well
as the responsibility of care and dependency of children and adolescents under 20 years, which are mostly in processes of physical and intellectual training. Therefore, the nutritional description of the adult group is without-doubt of social importance from the health status viewpoint.
A lack of nutrition studies within the adult population is a problem in Ecuador but not in Food and Agriculture Organization of the United Nations and World Health Organization (WHO) general studies. However, in 2013 an Ecuadorian nutritional assessment and a nutrition mortality association papers were published by Sánchez-Llaguno et al. [2] and Neira-Mosquera et al. [3]. Recently, an Ecuadorian nutritional status quo report was divulged by the Encuesta Nacional de Salud y Nutrición (ENSANUT-ECU, National Health and Nutrition Survey of Ecuador) [4]. It should be added that chronic noncommunicable diseases such as cardiovascular disease, stroke, diabetes Mellitus, liver disease and colon cancer, had the highest mortality rate in the period 2001–2008 in Ecuador [3]. More recently, in 2013, the leading causes of death were diabetes Mellitus and hypertensive diseases with 4,695 and 4,189 cases according to the Instituto Nacional de Estadística y Censos [5].
Because of the non-existence of specific studies, the present work analyse anthropometric measurements, the input of macro and micronutrients in the diet and the adequacy nutrient intake of the adult population of Esmeraldas segregated by sex and age.
M E T H O D S
A total of 74 adults were surveyed: 40 women and 34 men. Individuals were classified by sex and five age categories: 20–29 years, 30–39 years, 40–49 years, 50–59 years and ≥60 years. Nutrient quantity intake information was collected by personal interview with a completion of 2 x 24–hours dietary recalls. These questionnaires were conducted on the weekend and on a weekday, and age, sex, place of residence and professional information were also recorded. Weight, waist and hip circumference data were collected by triplicate, blood pressure by duplicate and height by a single measure. The anthropometric indicators analysed were the Body Mass Index (BMI) and the waist
circumference. Waist circumference measure is used for the assessment of cardiovascular risk in overweight or obesity in adults [6]. Values for men and women above those established by the International Diabetes Federation (IDF) grouped individuals with abdominal obesity at high risk of cardiovascular disease [7]. The IDF set as cutoff point values for waist circumference ≥94cm in men and ≥80cm in women [7]. Weight was measured with a Beure BG39 scale, height was measured with a Gima wall tape, blood pressure was measured with an automatic arm sphygmomanometer Comfort Visomat 20/40 and the waist circumference was measured with a Seca 203 measuring tape. Nutriplato version 2.0 (Universidad de Córdoba, Córdoba, Spain) software was used for the two 24-hours food recall surveys data processing, and the macronutrients, micronutrients and respective Dietary Reference Instakes (DRIs) calculations. There is not a baseline data on recommended dietary intakes for the Ecuadorian population, therefore the obtained data were compared with the Federación Española de Sociedades de Nutrición Alimentación y Dietética (Fesnad, Federation of Nutrition, Food and Dietetics) recommended dietary intakes [8].
Statistical analyses were performed using Statistical Package for the Social Sciences (SPSS Inc., Chicago, Illinois, United States) version 15.0 software. Means and standard deviations were calculated for anthropometry, intakes and DRIs. The General Linear Model (GLM) was applied to identify differences in relation to nutrient intake considering sex (male/female), profession, BMI (normal range, overweight and obese), group (sex versus age), origin (Downtown/Las Palmas) and day of the week (weekday/weekend) as factors. Women dietary intakes less than 500kcal and higher than 3500kcal, and men dietary intakes less than 850kcal and higher than 4000kcal were excluded from the sample [9].
R E S U L T S
The study sample fell to 73 people because one individual was excluded for presenting intakes outside the range mentioned in materials and methods. Among them, 45% were male and the 55% were female. Tables 1 and 2 show the mean ± standard deviations of the anthropometric data segregated by age and sex. According to BMI classification, 67% of the sample was overweight or obese. No person participating in the study showed low weight. Men aged 20–29 years was the only group with no obesity but some overweight. Among the group of men between 50–59 years, none had a normal weight. Women are more likely to be overweighed and obese than men, 15 women versus 10 men were overweighed
Table 1. Mean (M) values ± Standard Deviation (SD) for age and anthropometry in men.
Variables 20–29 years (n=7) 30–39 years (n=7) 40–49 years (n=8) 50–59 years (n=4) ≥60 years (n=7)
M SD M SD M SD M SD M SD
Age 024,29 ± 03,04 035,43 ± 02,70 044,88 ± 02,17 054,50 ± 2,65 068,86 ± 11,10
Height (m) 001,75 ± 00,03 001,68 ± 00,07 001,66 ± 00,06 01,68 ± 00,03 01,64 ± 0,04
Weight (kg) 072,71 ± 11,13 085,03 ± 24,93 078,25 ± 19,92 087,38 ± 06,86 68,05 ± 11,44
BMI 023,86 ± 03,84 029,84 ± 07,29 027,99 ± 05,76 030,98 ± 02,59 25,19 ± 4,27
Sys. Press. 123,71 ± 12,88 125,07 ± 08,87 128,06 ± 18,03 141,63 ± 11,90 130,71 ± 19,08
Dias. Press. 076,50 ± 10,62 079,43 ± 05,62 082,06 ± 16,74 092,00 ± 07,95 74,86 ± 6,68
Hip (cm) 100,13 ± 07,07 108,29 ± 12,72 103,85 ± 12,04 106,33 ± 04,15 97,39 ± 6,80
Waist (cm) 081,70 ± 08,94 097,43 ± 18,46 098,00 ± 13,88 106,00 ± 10,04 92,47 ± 8,51
Note: BMI: Body Mass Index; Sys. Press: Systolic Pressure; Dias.Press: Diastolic Pressure.
and 14 women against 8 men were obese. Women aged 60 or older had the highest rate of obesity, followed by women aged 40–49 years. Overweight prevailed in women from 20 to 39 years. As stated by the sample, women had a tendency to be obese throughout all the stages of their life. No trend can be pointed in the normal range weight. Certain homogeneity was noted among subgroups except for 40–49 years women. In men aged 30, unlike women, an increase in the number of individuals with a normal weight and a reduction of obesity was observed.
The blood pressure values indicated that individuals had no hypertension symptoms except for 50–59 years aged men, but the range of 115mmHg is exceeded in all other subgroups excepting women aged 30–39 years.
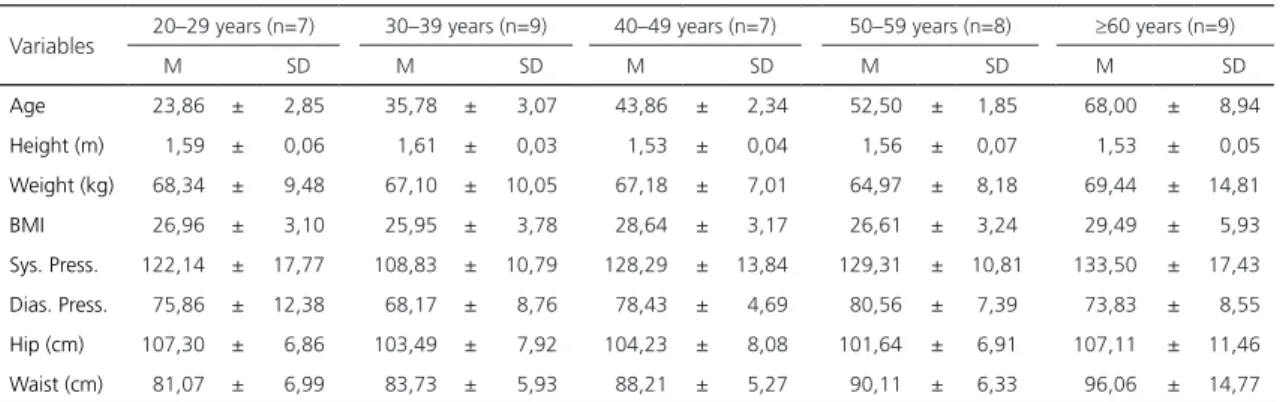
Table 2. Mean (M) values ± Standard Deviation (SD) for age and anthropometry in women.
Variables 20–29 years (n=7) 30–39 years (n=9) 40–49 years (n=7) 50–59 years (n=8) ≥60 years (n=9)
M SD M SD M SD M SD M SD
Age 023,86 ± 02,85 035,78 ± 03,07 043,86 ± 02,34 052,50 ± 1,85 068,00 ± 08,94
Height (m) 001,59 ± 00,06 001,61 ± 00,03 001,53 ± 00,04 001,56 ± 0,07 001,53 ± 00,05
Weight (kg) 068,34 ± 09,48 067,10 ± 10,05 067,18 ± 07,01 064,97 ± 8,18 069,44 ± 14,81
BMI 026,96 ± 03,10 025,95 ± 03,78 028,64 ± 03,17 026,61 ± 3,24 029,49 ± 05,93
Sys. Press. 122,14 ± 17,77 108,83 ± 10,79 128,29 ± 13,84 129,31 ± 10,81 133,50 ± 17,43
Dias. Press. 075,86 ± 12,38 068,17 ± 08,76 078,43 ± 04,69 080,56 ± 7,39 073,83 ± 08,55
Hip (cm) 107,30 ± 06,86 103,49 ± 07,92 104,23 ± 08,08 101,64 ± 6,91 107,11 ± 11,46
Waist (cm) 081,07 ± 06,99 083,73 ± 05,93 088,21 ± 05,27 090,11 ± 6,33 096,06 ± 14,77
Twelve percent of men showed hypertension and the 87.7% of the adult population showed prehypertension.
Men ≥60 years had the lower waist circumference index, and no person in the 20–29 years men group was over the cutoff point. All women subgroups had cases that exceeded waist circumference cutoff points, and it was observed that at an older age, a greater number of cases surpassed the waist circumference index. In this study 53 people were at risk of cardiovascular disease and 20 individuals were in normal ranges.
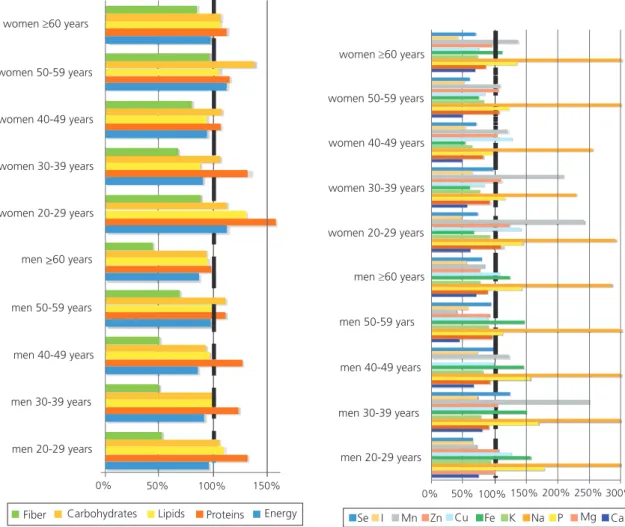
The Dietary Reference Instakes results are shown in Figures 1 and 2. In the different
Figure 1. Contributions to Dietary Reference Instakes for fiber, carbohidrates, lipids, proteins, energy, Se: Selenium; I: Iodine; Mn: Manganese; Zn: Zinc; Cu: Cuprum; Fe: Iron; K: Potassium; Na: Sodium; P: Phosphorus; Mg: Magnesium; Ca: Calcium.
age and gender subgroups very similar intake patterns were observed. Ten nutrients (calcium, potassium, iodine, riboflavin, pantothenic acid, biotin, vitamin D, vitamin E, monounsaturated fatty acids and polyunsaturated fatty acids) were below the recommended dietary reference intakes in all age and gender subgroups and fiber is also in deficit for the entire population. Vitamin A intake was low for men 30 to 59 years and, as in many studies, women bore the burden of be under the recommended iron values [10].
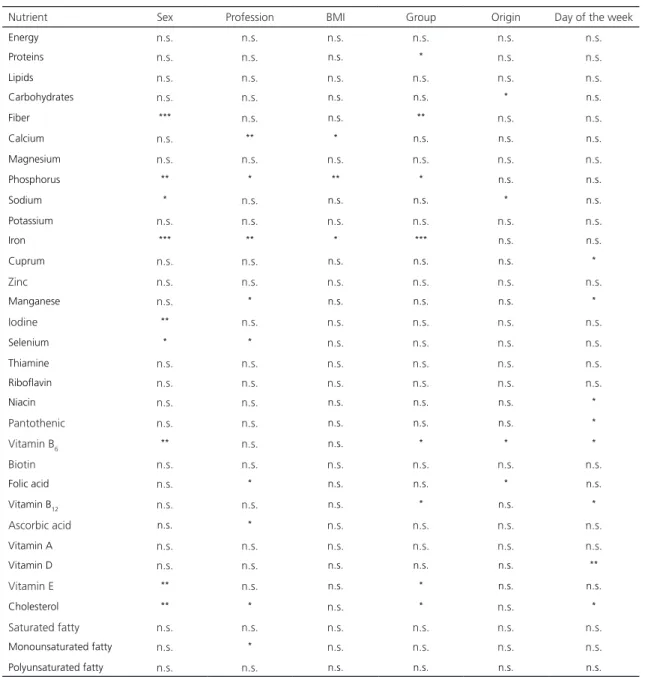
Table 3 shows the statistical results of the GLM analyses for all the studied variables and six ranking factors (sex, profession, BMI, group, origin and day of the week). No significant differences (p>0.05) were seen in any of the factors indicated
women 60 years
women 50-59 years
women 40-49 years
women 30-39 years
women 20-29 years
men >60 years_
men 50-59 years
men 40-49 years
men 30-39 years
men 20-29 years
0% 50% 100% 150%
Fiber Carbohydrates Lipids Proteins Energy
women 60 years
women 50-59 years
women 40-49 years
women 30-39 years
women 20-29 years
men 60 years
Se I Mn Zn Cu Fe K Na P Mg Ca men 50-59 yars
men 40-49 years
men 30-39 years
men 20-29 years
for: energy, lipids, magnesium, potassium, zinc, thiamine, riboflavin, biotin, vitamin A, saturated fatty acids and polyunsaturated fatty acids.
Intakes in energy were 92% in men and 101% in women, while lipid intakes were 100% and 105% for men and women. Significant differences (p<0.05) were seen in protein among population subgroups. In both genders, the DRI percentage decreases along age. Significant differences for the origin factor (p<0.05) were found in the carbohydrate macronutrient.
Figure 2. Contributions to DRI for vitamin E, vitamin D, vitamin A, ascorbic acid, vitamin B12, folic acid, biotin, vitamin B6, panthotenic, Niacin, Riboflavin, Thyamine, cholesterol, poliunsaturated fatty, monounsaturated fatty and saturated fatty.
For fiber, significant differences at sex (p<0.001) and group (p<0.01) were appreciated. It should be taken into account that, age and sex were both included the group factor. In this sense, men consumed less fiber (54%) than women (84%) and higher fiber intakes were observed in the 50–59 years group for both sexes. Anyway, fiber consumption was below de settled DRIs for fiber in both gender.
Significant differences in calcium intake were shown for the profession factor (p<0.01),
women 60 years
women 50-59 years
women 40-49 years
women 30-39 years
women 20-29 years
men 60 years
men 50-59 yars
men 40-49 years
men 30-39 years
men 20-29 years
0% 100% 200% 300% 400%
Vitamin E
Ascorbic acid
Biotin
Niacin
Vitamin B
Vitamin B
Vitamin D Vitamin A
Folic acid
Pantothenic
Thyamina 12
6
women 60 years
women 50-59 years
women 40-49 years
women 30-39 years
women 20-29 years
men 60 years
men 50-59 yars
men 40-49 years
men 30-39 years
men 20-29 years
0% 50% 100% 150% 200% 250%
Cholesterol
Monounsatured Fatty
Poliunsaturated fatty
Table 3. Summary of the General Linear Model statistical analysis application.
Nutrient Sex Profession BMI Group Origin Day of the week
Energy n.s. n.s. n.s. n.s. n.s. n.s.
Proteins n.s. n.s. n.s. * n.s. n.s.
Lipids n.s. n.s. n.s. n.s. n.s. n.s.
Carbohydrates n.s. n.s. n.s. n.s. * n.s.
Fiber *** n.s. n.s. ** n.s. n.s.
Calcium n.s. ** * n.s. n.s. n.s.
Magnesium n.s. n.s. n.s. n.s. n.s. n.s.
Phosphorus ** * ** * n.s. n.s.
Sodium * n.s. n.s. n.s. * n.s.
Potassium n.s. n.s. n.s. n.s. n.s. n.s.
Iron *** ** * *** n.s. n.s.
Cuprum n.s. n.s. n.s. n.s. n.s. *
Zinc n.s. n.s. n.s. n.s. n.s. n.s.
Manganese n.s. * n.s. n.s. n.s. *
Iodine ** n.s. n.s. n.s. n.s. n.s.
Selenium * * n.s. n.s. n.s. n.s.
Thiamine n.s. n.s. n.s. n.s. n.s. n.s.
Riboflavin n.s. n.s. n.s. n.s. n.s. n.s.
Niacin n.s. n.s. n.s. n.s. n.s. *
Pantothenic n.s. n.s. n.s. n.s. n.s. *
Vitamin B6 ** n.s. n.s. * * *
Biotin n.s. n.s. n.s. n.s. n.s. n.s.
Folic acid n.s. * n.s. n.s. * n.s.
Vitamin B12 n.s. n.s. n.s. * n.s. *
Ascorbic acid n.s. * n.s. n.s. n.s. n.s.
Vitamin A n.s. n.s. n.s. n.s. n.s. n.s.
Vitamin D n.s. n.s. n.s. n.s. n.s. **
Vitamin E ** n.s. n.s. * n.s. n.s.
Cholesterol ** * n.s. * n.s. *
Saturated fatty n.s. n.s. n.s. n.s. n.s. n.s.
Monounsaturated fatty n.s. * n.s. n.s. n.s. n.s.
Polyunsaturated fatty n.s. n.s. n.s. n.s. n.s. n.s.
Note: BMI: Body Mass Index; n.s.: not significant, p>0,05; *p<0,05; **p<0,01; ***p<0,001.
but a clear grouping criteria could not be established by the large number of professions included. Calcium intake also showed significant differences for BMI (p<0.05) and the Tukey’s test (p<0.05) distinguished a group with the highest calcium intake of the micronutrient formed by normal weighted (79% below DRI) and overweight (61% below DRI) individuals and a group with a lower calcium intake formed by overweight (located in both groups)
and obese (56% below DRI) individuals. This demonstrated that higher reserves are given with a lower calcium intake. Neither calcium nor vitamin D reached the recommendations for DRIs. The vitamin D ingestion were under the recommendations with a 28% in men and 31% in women respectively.
(p<0.01) and group (p<0.05). Men consumed more phosphorus (152% above DRI) than women (124% above DRI), it was observed that at older age the phosphorus consumption is lower. In relation to BMI, two groups were created by the Tukey’s post hoc test (p<0.05): a group of higher intake formed by normal weight individuals and a group of lower intake formed by overweight and obese individuals.
Factors involving iron intake were sex (p<0.001), profession (p<0.01), BMI (p<0.05) and group (p<0.001). The Tukey test for BMI (p<0.05) showed that a group of normal weight with 131% of the recommended iron intake and the obese individuals with an intake of 104%, and another group composed by obese individuals (located in both groups) and overweight individuals with 93% of the iron DRI. There were also gender differences and men consumed 145% of the iron DRI compared to the lower intake of women with a 74% of the iron DRI. The 77.5% of women were below the DRIs recommendations but not the ≥60 years women subgroup. However, every men subgroups came up to the recommendations.
Differences in sodium (p<0.05) were significant for the sex and origin factors. Men and women consumed 339% and 293% of the sodium DRI respectively and data also showed that individuals from Las Palmas area consumed 348% compared to the 273% consumed by the individuals from the Downtown area.
Sex is the only factor that showed significant differences (p<0.01) in iodine intake. 65% of the iodine DRI was set for men and 52% of the iodine DRI was set for women. Riboflavin, pantothenic acid and biotin are vitamins that function as coenzymes and were below the settled DRIs (Figure 2).
The most influential factors for vitamin E were sex (p<0.01) and group (p<0.05). Men had a consumption of 46% of the vitamin E DRI, ten percent more than women 36%. In the same way, the antioxidants phosphorus and iron also
presented a lower consumption as individuals age.
Saturated fatty acids exceeded the recommended dietary intakes (Figure 2). The saturated fat mean intake represents the 50%, a high percentage compared with the 10% of the daily energy recommendation.
D I S C U S S I O N
The great importance of nutrition in preventive medicine makes it decisive to be able to evaluate the nutritional status of a group. Malnutrition increases the morbidity and mortality, increases the frequency and length of hospital stays, decreases the quality of life and generates large economic health costs.
Most individuals included in this study were overweight and obese, but BMI is limited regards sex and age, for the same BMI value in women and men, women for their physiological characteristics have a higher body fat percentage, and analyzing young and old people subjects with the same BMI, old adults have higher body fat percentage [11]. In relation to the data obtained and as BMI is the largest international benchmark to group individuals in a weight range, that two-thirds of the sample presented obesity and overweight, it brings a serious concern and it would be a relevant evidence for a public health problem because overweight and obesity is associated with the so-called non-communicable diseases such as cardiovascular disease, hypertension, dyslipidemia, diabetes Mellitus, stroke and cancer among others [12,13]. This data is consistent with the data presented by ENSANUT-ECU, where the prevalence of overweight and obesity is 62.8% in the Ecuadorian population aged 20 to 60 years [4].
between 120 and 139mmHg and a diastolic blood between 80 and 89mmHg is defined as prehypertension [15]. It is also estimated that 49.0% of all heart diseases and 62.0% of all strokes result from a blood pressure higher than 115mmHg [16]. In the present research a high percentage of men and women suffered from prehypertension. Data from the ENSANUT-ECU study also showed that 15.6% of the Ecuadorian population between 18 and 59 years old have hypertension [4] and 4,189 deaths were caused by the hypertensive disease in 2013 [5].
Women are more likely to increase waist circumference above 80cm with increasing age, something that is also related to the body mass index. Men showed less vulnerability and the risk of having a larger waist circumference above 94cm begins at 30 years. Waist circumference is strongly associated to cardiovascular heart disease, the results showed that more than a half of the surveyed adult people were identified at high risk of developing cardiovascular disease.
Significant differences were showed for fiber at age and group factors, and DRIs weren’t reached for fiber in all population groups. Low fiber consumption involves the possibility of constipation, in addition, many studies have shown that an adequate fiber intake prevents the development of diabetes, cardiovascular disease (reduced blood cholesterol, improves control blood pressure), obesity, diabetes (decreased insulin resistance), digestive tract diseases along with others disorders [17-19]. The main food of the Esmeraldas diet is rice with 0.3g of fiber per 100g, whole fruit intake is low as the culinary culture offers a wide range of juices, and vegetable consumption is modest because it is a complement to the rice in the main course. Population accessibility to unrefined products such as whole grains is low and is not within the state of the diet culture of Esmeraldas.
For calcium no information on the best intake for the present population is set up, and due to sun exposure and physical activity, the needs of calcium are dissimilar, as the mineral
is also linked to vitamin D which promoted the calcium absorption [20]. Vitamin D in the Esmeraldas population should differ from the Fesnad recommendations for the Hispanic population as the vitamin D is synthesized by the skin exposure to sun. Tropical climate is beneficial for the synthesis of this vitamin, but other factors such as age, skin pigmentation and time of exposure of the skin to sunlight also play an important role [21].
As men and women age, the iron consumption is reduced. In this study, most of the women didn´t reach the recommended iron DRIs for many women subgroups, while men reached the recommended iron intake. The lack of iron in the body causes a low hemoglobin concentration, anemia, reduced work capacity and decreased immune system. Anemia is considered as a global public health problem that affects both the industrialized and developing countries. Anemia occurs in areas with a high incidence of malaria and parasitic diseases and when nutritional deficiencies and hemoglobinopathies are established. One of the best practices for locals would be mineral supplementation or iron fortification in many food products [22,23].
In the present work, for all gender and age subgroups sodium intake exceeded significantly the DRIs established for the cation. WHO establishes a sodium intake lower than 2g/day for adults (5g salt/day) [24]. Sodium is closely linked to blood pressure and studies show that reducing sodium intake lowers blood pressure in adults with or without hypertension [25]. Previous results point out that hypertension and prehypertension were common in the surveyed people. Thus, sodium intake below the values established by the WHO will imply lower blood pressure and a reduction of possible cardiovascular diseases [24,25].
established as the main iodine sources [27], although Esmeraldas is a coastal city, the study sample had low iodine consumption, condition that could be due to the low seafood consuming in the surveyed sample.
B vitamins are important for cognitive performance and a low intake of these vitamins could lead to a reduced mental and physical performance [28]. A low intake of biotin, pantothenic and riboflavin was identify. The rice is the staple grain in the Esmeralda diet, but the refining process causes the loss of most of the B vitamins, while the intake of pasta and vegetables is relatively low, and fortified foods present in most developed countries are almost nonexistent in Ecuador, are unreachable to the general population or do not fall within their consumption habits and food culture.
Vitamin A acts to preserve the proper role of vision, growth, immune system, bone metabolism, tooth development and reproduction among many other functions [26]. Bioavailability and storage of vitamin A is hampered by a lack of vitamin E [20], a situation that in this sample was set, as in both gender and all age groups vitamin E contribution is scarce, as well as vitamin A in all men group. WHO concluded that vitamin A deficiency is a matter of public health.
There is a notable consumption of saturated fatty acids in the target population, due to the african palm oil consumption [3], as Ecuador has a strong agricultural economy based on this product. For the excessive saturated fatty acid intake, it is notable to mention that an increased diet of polyunsaturated and monounsaturated fatty acids is a gateway to prevent cardiovascular disease [29]. Avocado would be a strong ally of the Ecuadorian diet to balance the excess of saturated fatty acids as it has a similar composition to olive oil fatty acids [30].
The results discussed here converge with the results of the Natioanl Health and Nutrition Survey conducted in Ecuador (ENSANUT-ECU) and along with Sánchez-Llaguno et al. [2]
and Neira-Mosquera et al. [3] studies, where phrosphrorus and sodium intakes are above recommendations, but not so for calcium, potassium, iron and iodine. The Sánchez-Llaguno et al. [2] study also showed deficiencies in pantothenic acid, biotin and D and E vitamins. The ENSANUT-ECU study revealed low intake of iron and fiber along with vitamin A. Anthropometric results expressed a high rate of overweight and obesity, a situation that increases the appearance of non-communicable diseases, and as Neira-Mosquera et al. [3] reported the highest number of deaths between 2001 and 2008 were derived from cardiovascular and cerebrovascular problems, a situation that is still present in Ecuador.
C O N C L U S I O N
It was observed that sex was a determining factor to establish significant differences in many nutrients. The nutritional assessment showed no DRIs achievement for fiber, calcium, potassium, iron and iodine and vitamins B, A, D and E. An inadequate saturated, polyunsaturated and monounsaturated fatty acid energy balance was observed and a DRI above the sodium level recommendation was detected.
It is crucial to measure and evaluate the proposed indicators in a large sample of subjects in order to verify the consistency of the results. More comprehensive studies are needed, to broad the study area to rural populations, as well as obtain additional information on biochemical data, physical activity and lifestyles.
The results indicate the need to develop nutritional health programs for the adult population in Esmeraldas, parallel to public and private actions to prevent health effects that can produce the detected signs.
C O N T R I B U T O R S
R E F E R E N C E S
1. Popkin BM. Global nutrition dynamics: The world is shifting rapidly toward a diet linked with noncommunicable diseases. Am J Clin Nutr. 2006;84(2):289-98.
2. Sánchez-Llaguno SN, Neira-Mosquera JA, Perez-Rodriguez F, Moreno Rojas R. Preliminary nutritional assessment of the Ecuadorian diet based on a 24-h food recall survey in Ecuador. Nutr Hosp. 2013;28(5):1646-56.
3. Neira-Mosquera JA, Pérez-Rodríguez F, Sánchez-Llaguno S, Moreno Rojas R. Study on the mortality in Ecuador related to dietary factors. Nutr Hosp. 2013;28(5):1732-40.
4. Freire WB, Ramírez-Luzuriaga MJ, Belmont P, Mendieta MJ, Silva-Jaramillo K, Romero N, et al.
Encuesta Nacional de Salud y Nutrición, Tomo 1. Quito: Ministerio de Salud Pública del Ecuador; 2014 [2015 Mayo 2]. Disponible en: http:// www.salud.gob.ec/encuesta-nacional-de-salud-y-nutricion-ensanut/
5. Instituto Nacional de Estadística y Censos. Diabetes y enfermedades hipertensivas entre las principales causas de muerte en el 2013. Quito: Instituto Nacional de Estadística y Censos; 2013 [2015 Mayo 2]. Disponible en: http://www.ecuadorencifras. gob.ec/diabetes-y-enfermedades-hipertensivas- entre-las-principales-causas-de-muerte-en-el-2013
6. Moreno González MI. Circunferencia de cintura: una medición importante y útil del riesgo cardiometabólico. Rev Chil Cardiol. 2010;29(1):85-7
7. Zimmet P, Alberti G, Shaw J. Una nueva definición mundial del síndrome metabólico propuesta por la Federación Internacional de Diabetes: fundamento y resultados. Rev Esp Cardiol. 2005;50(3):31-3.
8. Cuervo M, Federación Española de Sociedades de Nutrición A y D. Ingestas Dietéticas de Referencia (IDR) para la población española. Pamplona: Eunsa; 2010.
9. Dehghan M, López Jaramillo P, Dueñas R, Anaya LL, Garcia RG, Zhang X, et al. Development and validation of a Quantitative Food Frequency Questionnaire among rural- and urban-dwelling adults in Colombia. J Nutr Educ Behav. 2012; 44(6):609-13.
10. Zimmermann M, Hurrell R. Nutritional iron deficiency. Lancet. 2007;370(9586):511-20.
11. Gallagher D, Visser M, Spúlveda D, Pierson RN, Harris T, Heymsfield SB. How useful is body mass index for comparison of body fatness across age, sex, and ethnic groups? Am J Epidemiol. 1996;143(3):228-39.
12. World Healh Organization. Obesity and overweight. Geneva: WHO; 2015 [2015 May 2]. Available from: http://www.who.int/mediacentre/factsheets/ fs311/en/
13. Must A, Spadano J, Coakley EH, Field AE, Colditz G, Dietz WH. The disease Burden associated with overweight and obesity. JAMA. 1999;282(16):1523-9.
14. World Health Organization. Global health risks: Mortality and burden of disease attributable to selected major risks. Geneva: WHO; 2009.
15. Weber MA, Schiffrin EL, White WB, Mann S, Lindholm LH, Kenerson JG, et al. Clinical Practice Guidelines for the Management of Hypertension in the Community: A Statement by the American Society of Hypertension and the International Society of Hypertension. J Clin Hypertens. 2014;16(1):14-26.
16. Mackay J, Mensah G. The atlas of heart disease and stroke. Geneva: WHO; 2004.
17. Liu S, Willett WC, Manson JE, Hu FB, Rosner B, Colditz G. Relation between changes in intakes of dietary fiber and grain products and changes in weight and development of obesity among middle-aged women. Am J Clin Nutr. 2003;78(5):920-27.
18. Schulze MB, Liu S, Rimm EB, Manson JE, Willett WC, Hu FB. Glycemic index, glycemic load, and dietary fiber intake and incidence of type 2 diabetes in younger and middle-aged women. Am J Clin Nutr. 2004;80(2):348-56.
19. Eric B, Rimm, SD. Vegetable, fruit, and cereal fiber intake and risk of coronary heart disease among men. JAMA. 1996;275(6):447-51. https://doi.org/10. 1001/jama.1996.03530300031036
20. Gil A. Tratado de nutrición: Tomo 1. Bases fisiológicas y bioquímicas de la nutrición. 2ª ed. Madrid: Médica Panamericana; 2010.
21. González-Rodríguez L, Rodríguez-Rodríguez E. Situación en vitamina D y estrategias para alcanzar las ingestas recomendadas. Nutr Hosp. 2014;30(Supl.2):39-46.
22. De Benoist B, World Health Organization, Centers for Disease Control and Prevention (U.S.). Worldwide prevalence of anaemia 1993–2005 of WHO Global Database of anaemia. Geneva: WHO; 2008 [2015 May 20]. Available from: http://whqlibdoc.who.int/ publications/2008/9789241596657_eng.pdf
23. Lynch SR. Why nutritional iron deficiency persists as a worldwide problem. J Nutr. 2011;141(4):763S-8S.
[2015 May 20]. Available from: http://apps.who.int/ iris/bitstream/10665/77985/1/9789241504836_ eng.pdf?ua=1&ua=1
25. He FJ, MacGregor GA. Effect of longer-term modest salt reduction on blood pressure. In: The Cochrane Collaboration, editor. Cochrane Database of Systematic Reviews. Chichester: John Wiley & Sons; 2004. Available from: http://doi. wiley.com/10.1002/14651858.CD004937
26. World Health Organization, Food and Agriculture Organization of the United Nations, editors. Vitamin and mineral requirements in human nutrition. 2nd ed. Geneva: WHO; 2004.
27. Sumar S, Ismail H. Iodine in food and health. Nutr Food Sci. 1997;97(5):175-83.
28. Maggini S, Alaman MGP, Wintergerst ES. B-vitamins and cognitive function-what is the evidence? Nutr Hosp. 2009;1(24):74-81.
29. Mattson FH, Grundy SM. Comparison of effects of dietary saturated, monounsaturated, and polyunsaturated fatty acids on plasma lipids and lipoproteins in man. J Lipid Res. 1985;26(2):194-202. 30. Colquhoun DM, Moores D, Somerset SM,
Humphries JA. Comparison of the effects on lipoproteins and apolipoproteins of a diet high in monounsaturated fatty acids, enriched with avocado, and a high-carbohydrate diet. Am J Clin Nutr. 1992;56(4):671-7.